| Param | Original file | Final file |
|---|---|---|
| Filename | modeM0/AS1A09_131T01_9000004690_32190cztM0_level2.evt | modeM0/AS1A09_131T01_9000004690_32190cztM0_level2_quad_clean.evt |
| Size (bytes) | 636,203,520 | 100,238,400 |
| Size | 606.7 MB | 95.6 MB |
| Events in quadrant A | 3,024,274 | 660,583 |
| Events in quadrant B | 5,082,381 | 664,499 |
| Events in quadrant C | 3,999,105 | 653,978 |
| Events in quadrant D | 6,744,830 | 625,698 |
| Mode SS | |||
|---|---|---|---|
| Quadrant | BADHDUFLAG | Total packets | Discarded packets |
| A | 0 | 126 | 0 |
| B | 0 | 126 | 0 |
| C | 0 | 126 | 0 |
| D | 0 | 126 | 0 |
| Mode M0 | |||
|---|---|---|---|
| Quadrant | BADHDUFLAG | Total packets | Discarded packets |
| A | 0 | 13086 | 2 |
| B | 0 | 19833 | 1 |
| C | 0 | 16021 | 1 |
| D | 0 | 24488 | 1 |
| Mode M9 | |||
|---|---|---|---|
| Quadrant | BADHDUFLAG | Total packets | Discarded packets |
| A | 0 | 12 | 0 |
| B | 0 | 12 | 0 |
| C | 0 | 12 | 0 |
| D | 0 | 12 | 0 |
| Quadrant | Total seconds | Saturated seconds | Saturation percentage |
|---|---|---|---|
| A | 6169 | 36 | 0.583563% |
| B | 6169 | 127 | 2.058680% |
| C | 6169 | 700 | 11.347058% |
| D | 6169 | 437 | 7.083806% |
Noise dominated data is calculated using 1-second bins in cleaned event files. If a bin has >2000 counts, and if more than 50% of those come from <1% of pixels, then it is considered to be noise-dominated and hence unusable.
| Quadrant | # 1 sec bins | Bins with >0 counts | Bins with >2000 counts | High rate bins dominated by noise | Noise dominated (total time) | Noise dominated (detector-on time) | Marked lightcurve |
|---|---|---|---|---|---|---|---|
| A | 7339 | 6170 | 0 | 0 | 0.00% | 0.00% | 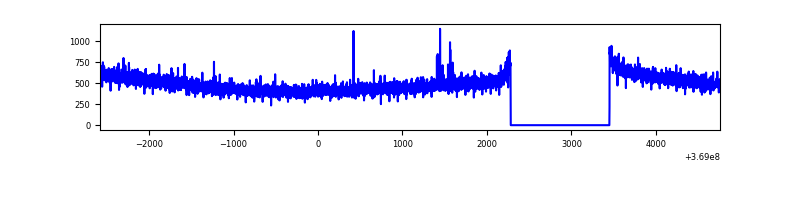 |
| B | 7339 | 6170 | 19 | 19 | 0.26% | 0.31% | 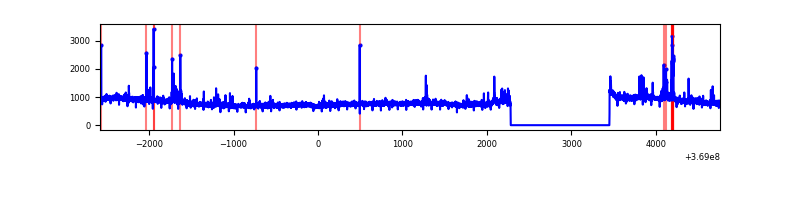 |
| C | 7339 | 6170 | 29 | 29 | 0.40% | 0.47% | 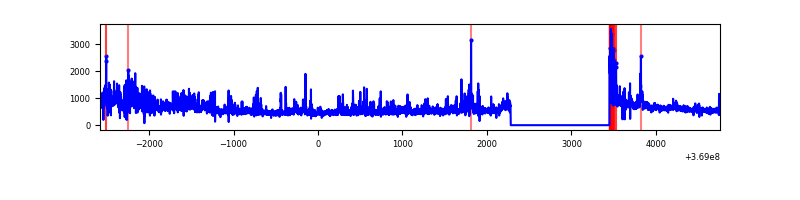 |
| D | 7339 | 6170 | 240 | 240 | 3.27% | 3.89% | 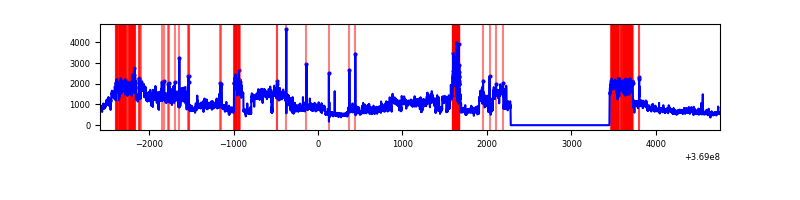 |
Top three noisy pixels from each quadrant. If the there are fewer than three noisy pixels in the level2.evt file, extra rows are filled as -1
| Pixel properties | Quadrant properties | ||||||
|---|---|---|---|---|---|---|---|
| Quadrant | DetID | PixID | Counts | Sigma | Mean | Median | Sigma |
| A | 13 | 6 | 14094 | 86.13 | 776 | 761 | 154.8 |
| A | 12 | 96 | 12906 | 78.45 | 776 | 761 | 154.8 |
| A | 13 | 254 | 11667 | 70.45 | 776 | 761 | 154.8 |
| B | 6 | 159 | 1842931 | 12784.44 | 774 | 756 | 144.1 |
| B | 0 | 190 | 53529 | 366.24 | 774 | 756 | 144.1 |
| B | 5 | 172 | 50145 | 342.75 | 774 | 756 | 144.1 |
| C | 0 | 10 | 325023 | 1932.39 | 731 | 738 | 167.8 |
| C | 3 | 233 | 280885 | 1669.38 | 731 | 738 | 167.8 |
| C | 14 | 238 | 270457 | 1607.24 | 731 | 738 | 167.8 |
| D | 8 | 195 | 3557338 | 19955.81 | 751 | 731 | 178.2 |
| D | 12 | 233 | 186552 | 1042.63 | 751 | 731 | 178.2 |
| D | 5 | 81 | 64192 | 356.07 | 751 | 731 | 178.2 |
Histogram calculated using DETX and DETY for each event in the final _common_clean file
| Quadrant A | 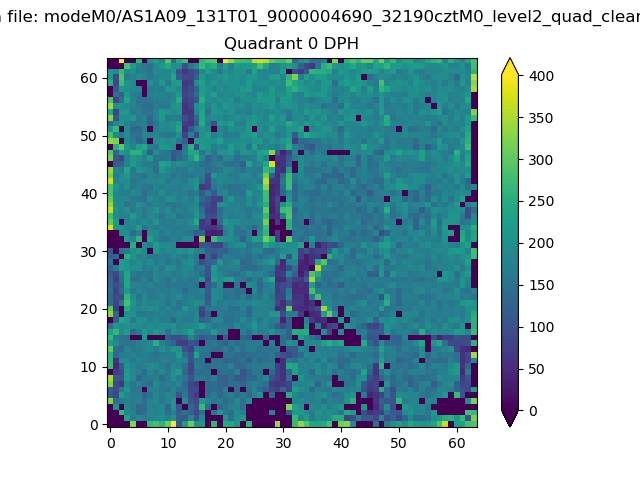 |
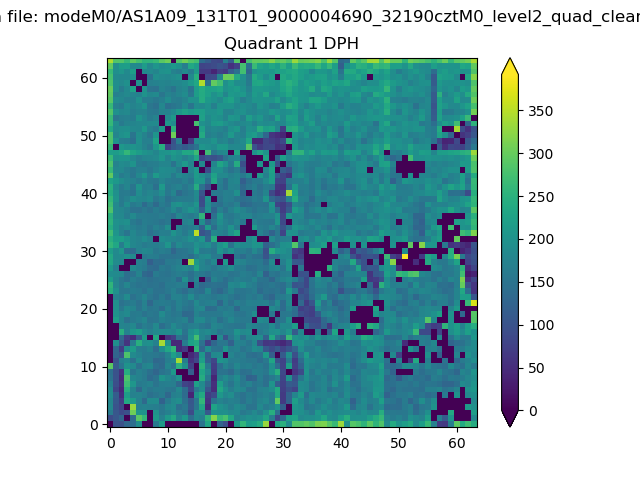 |
Quadrant B |
|---|---|---|---|
| Quadrant D | 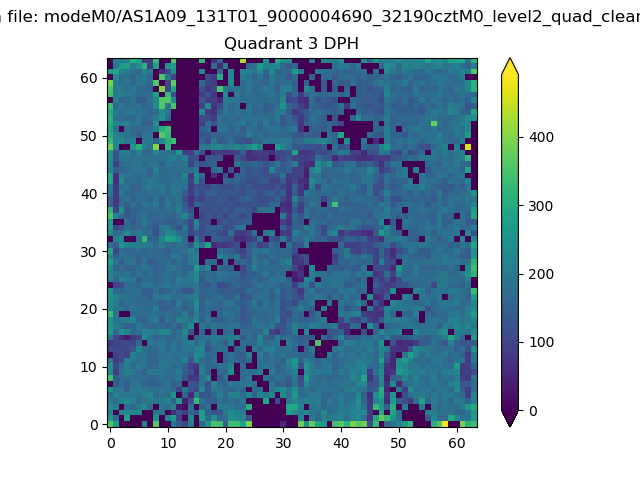 |
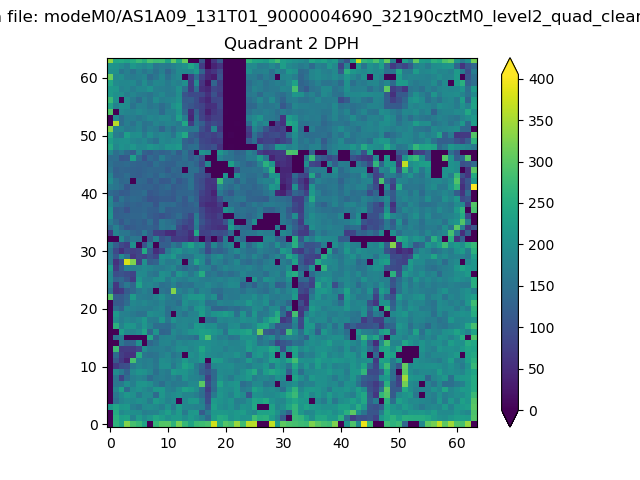 |
Quadrant C |
| Plot type | Count rate plots | Images |
|---|---|---|
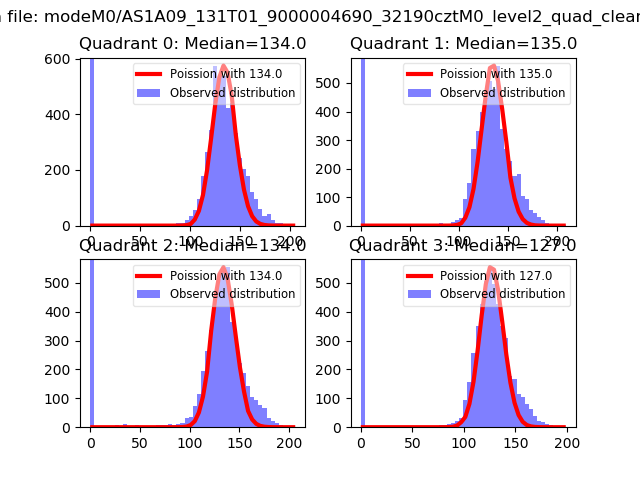
| Comparison with Poisson distribution Blue bars denote a histogram of data divided into 1 sec bins. Red curve is a Poisson curve with rate = median count rate of data. |
 |
 |
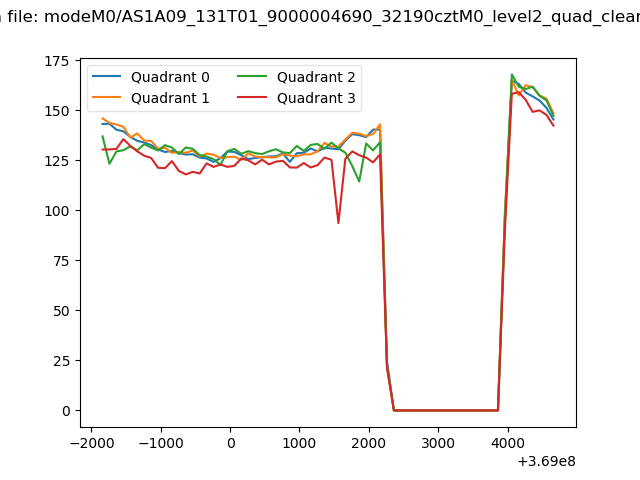
| Quadrant-wise count rates Data is divided into 100 sec bins |
 |
|
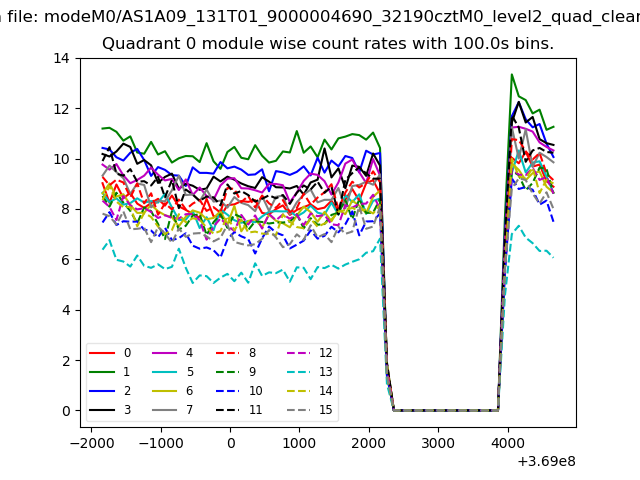
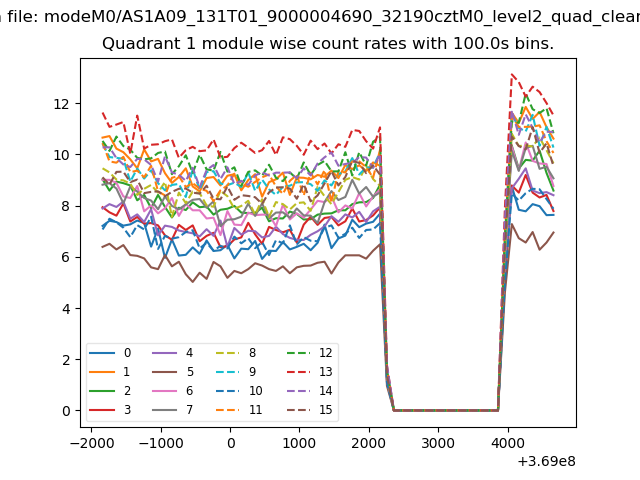
| Module-wise count rates for Quadrant A Data is divided into 100 sec bins |
 |
 |
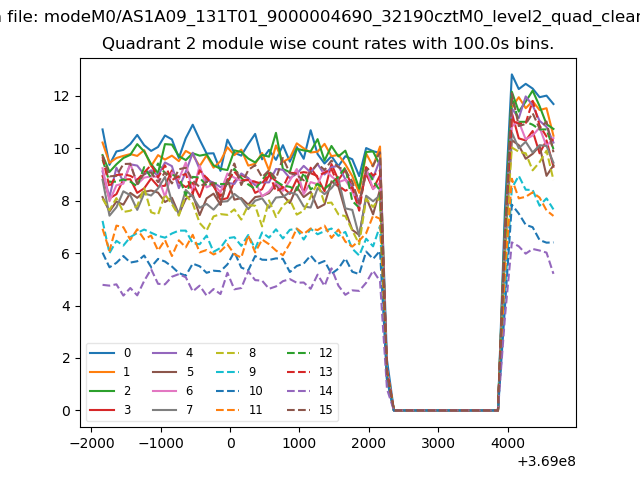
| Module-wise count rates for Quadrant B Data is divided into 100 sec bins |
 |
 |
| Module-wise count rates for Quadrant C Data is divided into 100 sec bins |
 |
 |
| Module-wise count rates for Quadrant D Data is divided into 100 sec bins |
 |
 |
| Parameter | Plot |
|---|---|
| CZT HV Monitor | 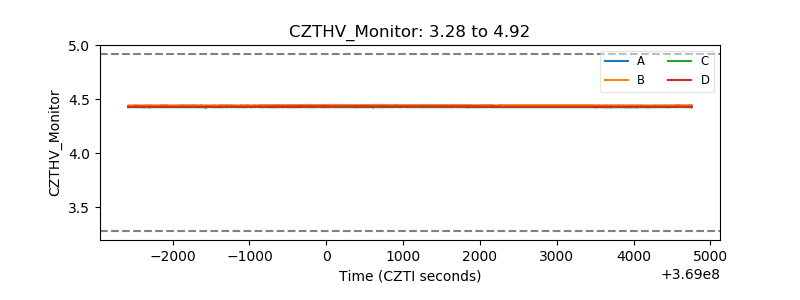 |
| D_VDD | 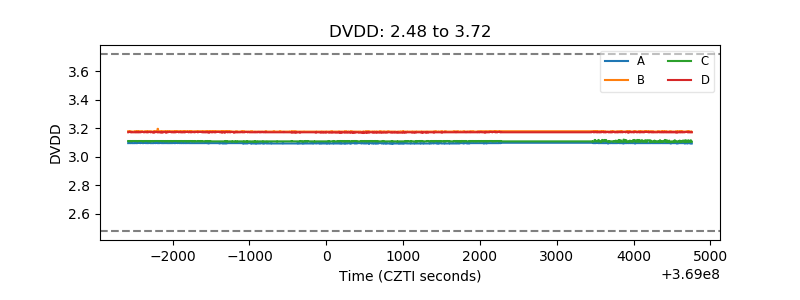 |
| Temperature 1 |  |
| Veto HV Monitor | 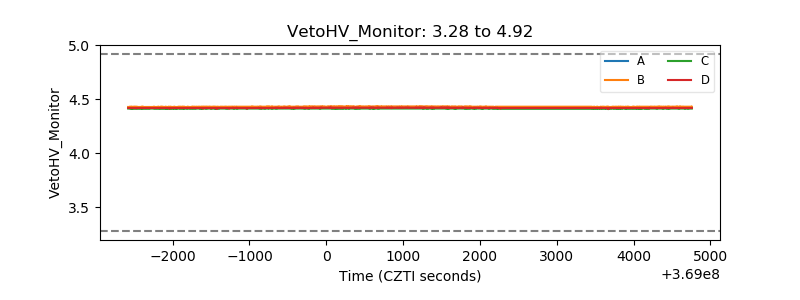 |
| Veto LLD | 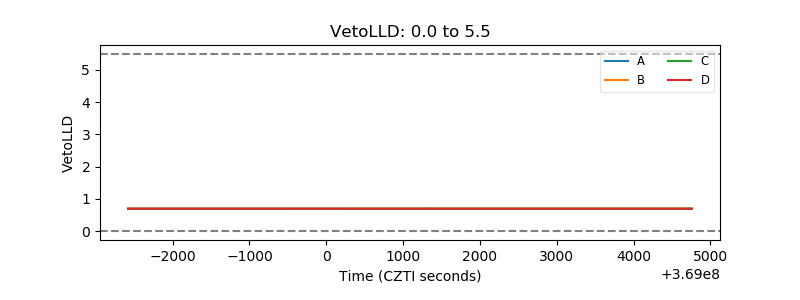 |
| Alpha Counter | 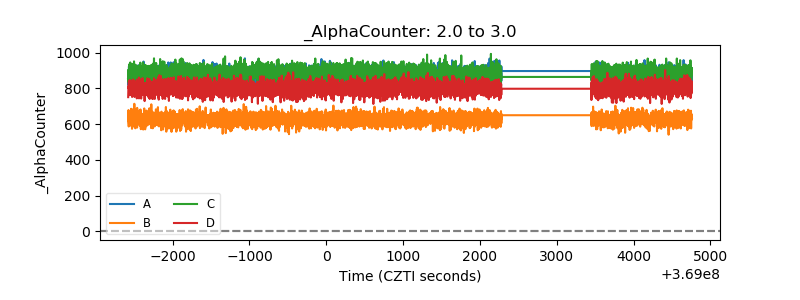 |
| _CPM_Rate | 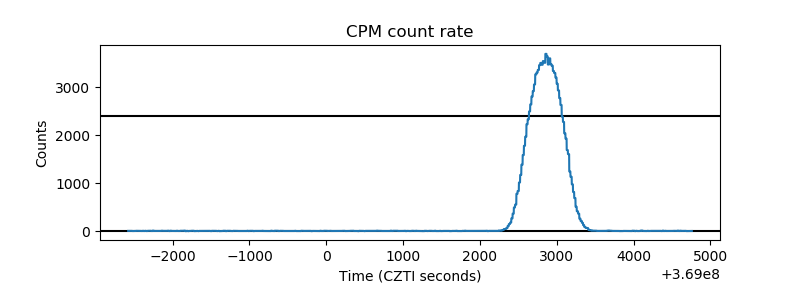 |
| CZT Counter | 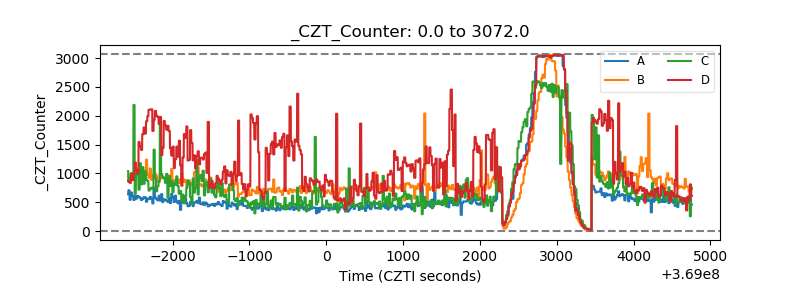 |
| +2.5 Volts monitor |  |
| +5 Volts monitor |  |
| _ROLL_ROT | 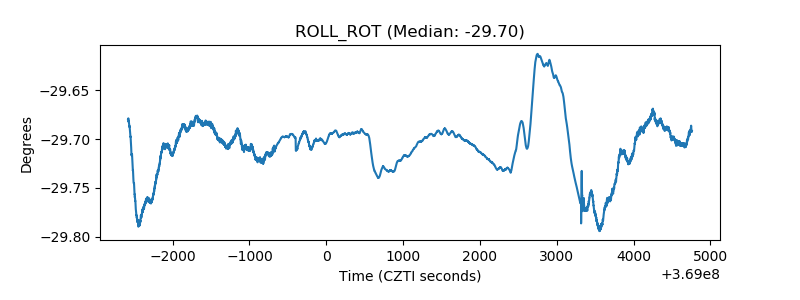 |
| _Roll_DEC | 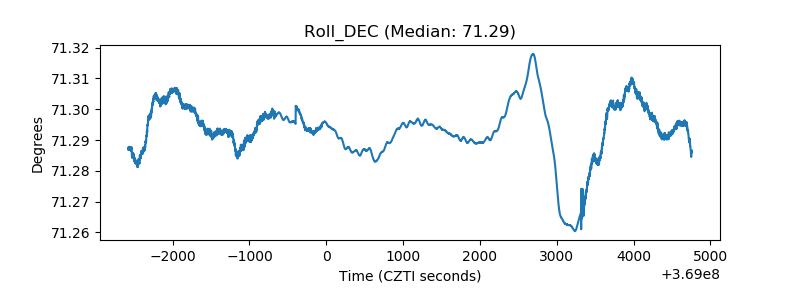 |
| _Roll_RA | 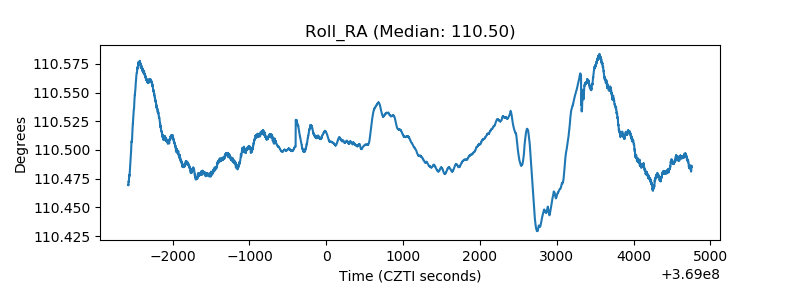 |
| Veto Counter |  |