| Param | Original file | Final file |
|---|---|---|
| Filename | modeM0/AS1A09_131T01_9000004690_32191cztM0_level2.evt | modeM0/AS1A09_131T01_9000004690_32191cztM0_level2_quad_clean.evt |
| Size (bytes) | 589,187,520 | 120,597,120 |
| Size | 561.9 MB | 115.0 MB |
| Events in quadrant A | 3,163,648 | 811,914 |
| Events in quadrant B | 5,268,754 | 825,806 |
| Events in quadrant C | 3,739,621 | 810,822 |
| Events in quadrant D | 5,250,416 | 769,508 |
| Mode SS | |||
|---|---|---|---|
| Quadrant | BADHDUFLAG | Total packets | Discarded packets |
| A | 0 | 126 | 0 |
| B | 0 | 126 | 0 |
| C | 0 | 126 | 0 |
| D | 0 | 126 | 0 |
| Mode M0 | |||
|---|---|---|---|
| Quadrant | BADHDUFLAG | Total packets | Discarded packets |
| A | 0 | 13525 | 3 |
| B | 0 | 20270 | 2 |
| C | 0 | 15154 | 2 |
| D | 0 | 19886 | 2 |
| Mode M9 | |||
|---|---|---|---|
| Quadrant | BADHDUFLAG | Total packets | Discarded packets |
| A | 0 | 18 | 0 |
| B | 0 | 18 | 0 |
| C | 0 | 18 | 0 |
| D | 0 | 19 | 0 |
| Quadrant | Total seconds | Saturated seconds | Saturation percentage |
|---|---|---|---|
| A | 6226 | 54 | 0.867331% |
| B | 6226 | 186 | 2.987472% |
| C | 6226 | 398 | 6.392547% |
| D | 6226 | 521 | 8.368134% |
Noise dominated data is calculated using 1-second bins in cleaned event files. If a bin has >2000 counts, and if more than 50% of those come from <1% of pixels, then it is considered to be noise-dominated and hence unusable.
| Quadrant | # 1 sec bins | Bins with >0 counts | Bins with >2000 counts | High rate bins dominated by noise | Noise dominated (total time) | Noise dominated (detector-on time) | Marked lightcurve |
|---|---|---|---|---|---|---|---|
| A | 7496 | 6228 | 0 | 0 | 0.00% | 0.00% | 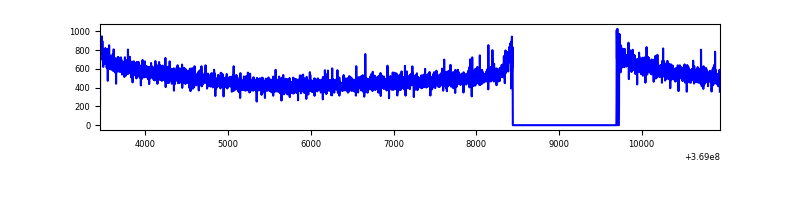 |
| B | 7496 | 6228 | 35 | 35 | 0.47% | 0.56% | 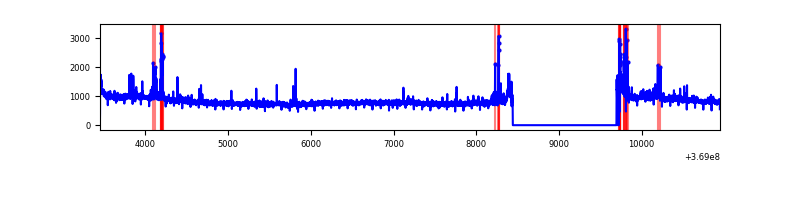 |
| C | 7496 | 6227 | 49 | 49 | 0.65% | 0.79% |  |
| D | 7496 | 6228 | 327 | 327 | 4.36% | 5.25% | 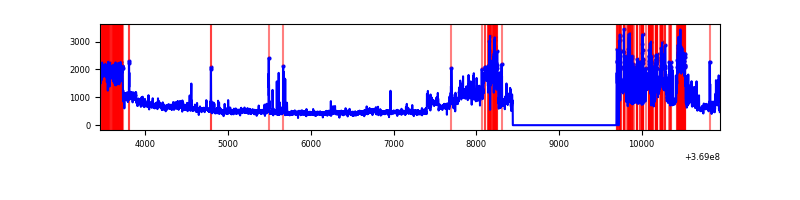 |
Top three noisy pixels from each quadrant. If the there are fewer than three noisy pixels in the level2.evt file, extra rows are filled as -1
| Pixel properties | Quadrant properties | ||||||
|---|---|---|---|---|---|---|---|
| Quadrant | DetID | PixID | Counts | Sigma | Mean | Median | Sigma |
| A | 13 | 6 | 12840 | 74.37 | 815 | 801 | 161.9 |
| A | 13 | 254 | 11622 | 66.84 | 815 | 801 | 161.9 |
| A | 3 | 137 | 7641 | 42.25 | 815 | 801 | 161.9 |
| B | 6 | 159 | 1797994 | 12007.0 | 814 | 796 | 149.7 |
| B | 5 | 172 | 126656 | 840.86 | 814 | 796 | 149.7 |
| B | 0 | 190 | 58446 | 385.15 | 814 | 796 | 149.7 |
| C | 0 | 10 | 255857 | 1423.49 | 783 | 790 | 179.2 |
| C | 14 | 238 | 171546 | 952.96 | 783 | 790 | 179.2 |
| C | 3 | 233 | 139332 | 773.18 | 783 | 790 | 179.2 |
| D | 8 | 195 | 1642925 | 8888.98 | 784 | 764 | 184.7 |
| D | 14 | 52 | 355688 | 1921.2 | 784 | 764 | 184.7 |
| D | 12 | 233 | 63696 | 340.65 | 784 | 764 | 184.7 |
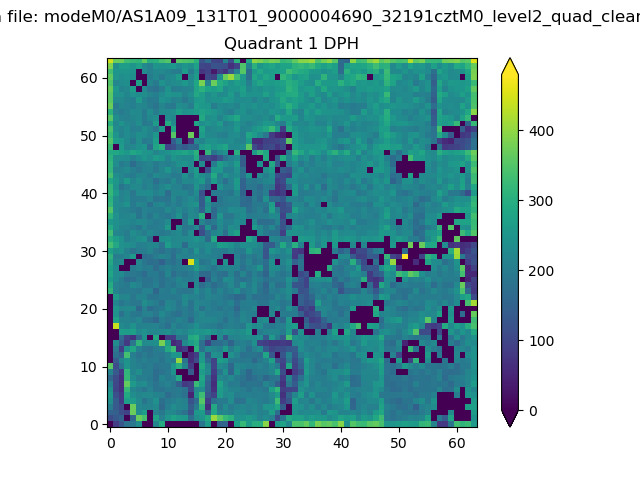
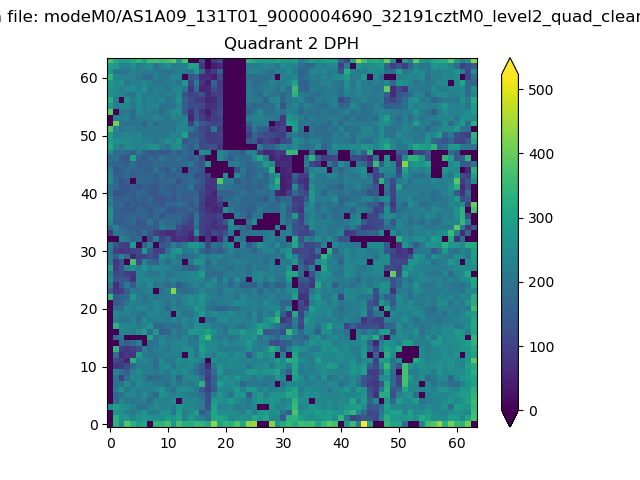
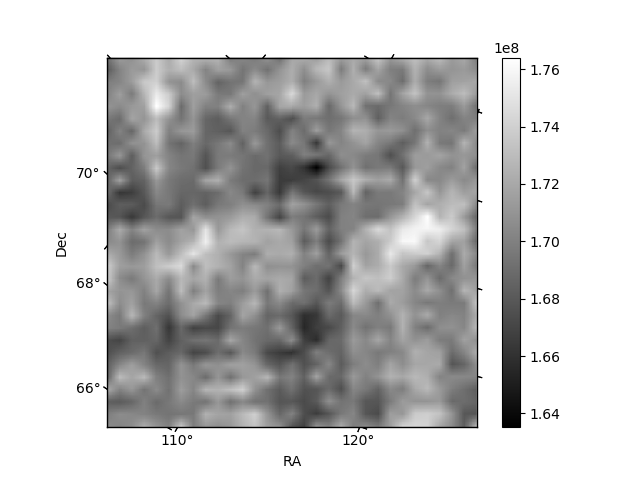
Histogram calculated using DETX and DETY for each event in the final _common_clean file
| Quadrant A | 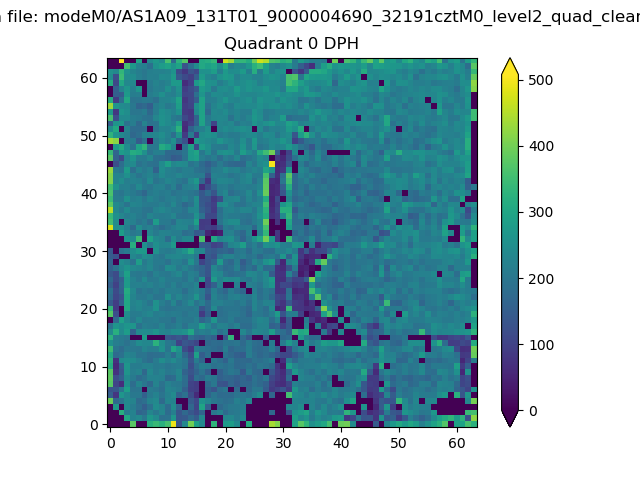 |
 |
Quadrant B |
|---|---|---|---|
| Quadrant D |  |
 |
Quadrant C |
| Plot type | Count rate plots | Images |
|---|---|---|
| Comparison with Poisson distribution Blue bars denote a histogram of data divided into 1 sec bins. Red curve is a Poisson curve with rate = median count rate of data. |
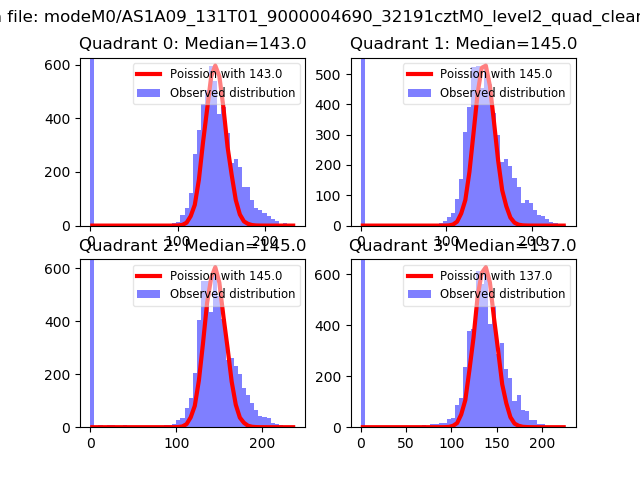 |
 |
| Quadrant-wise count rates Data is divided into 100 sec bins |
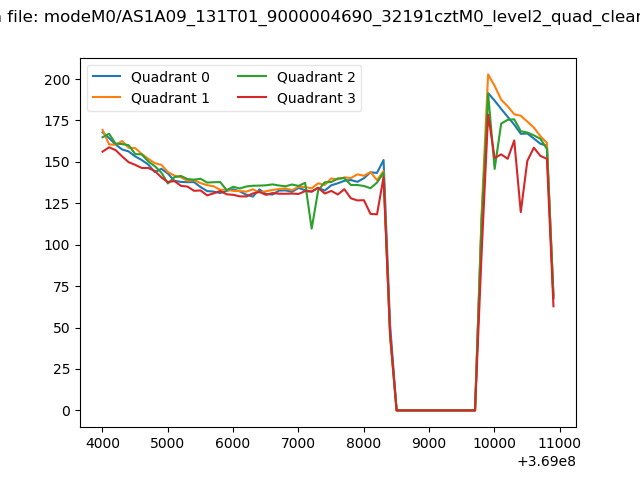 |
|
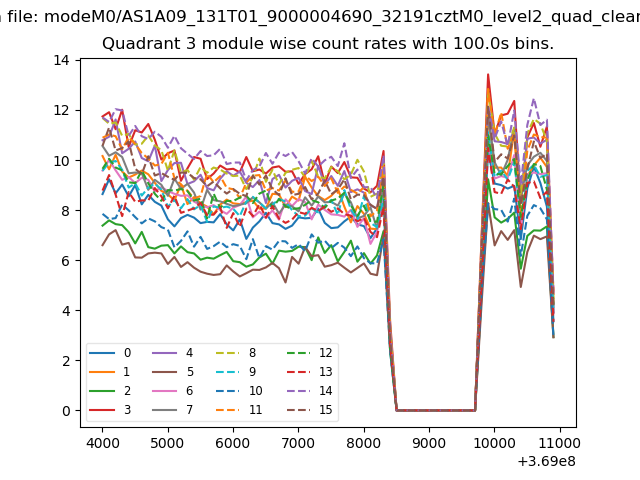
| Module-wise count rates for Quadrant A Data is divided into 100 sec bins |
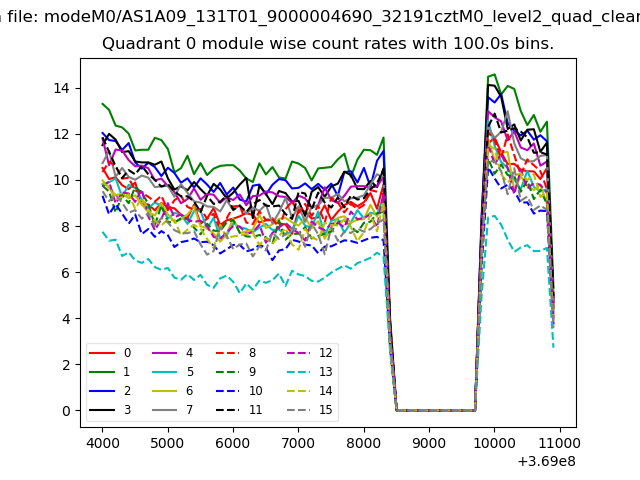 |
 |
| Module-wise count rates for Quadrant B Data is divided into 100 sec bins |
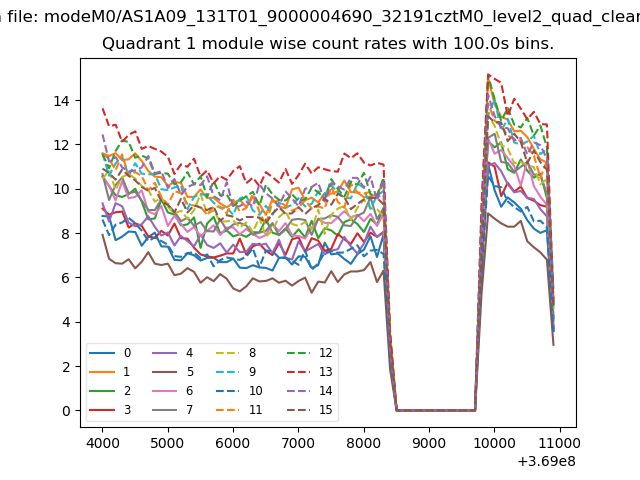 |
 |
| Module-wise count rates for Quadrant C Data is divided into 100 sec bins |
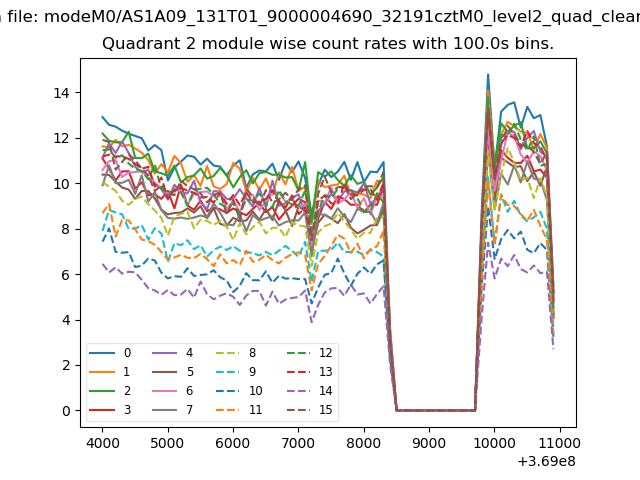 |
 |
| Module-wise count rates for Quadrant D Data is divided into 100 sec bins |
 |
 |
| Parameter | Plot |
|---|---|
| CZT HV Monitor |  |
| D_VDD | 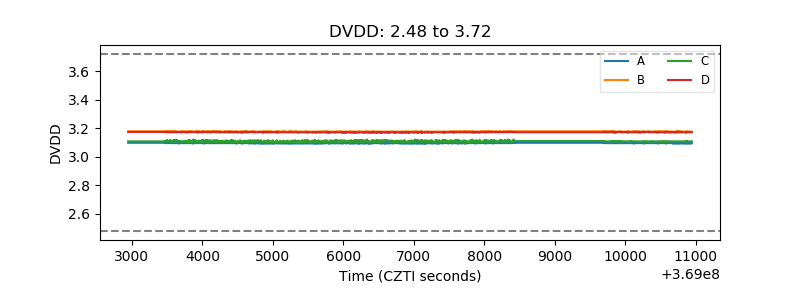 |
| Temperature 1 | 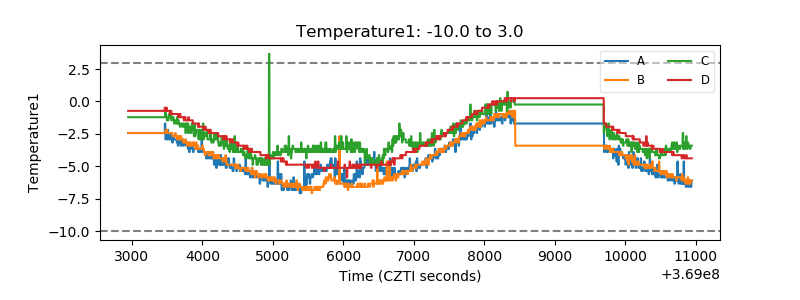 |
| Veto HV Monitor | 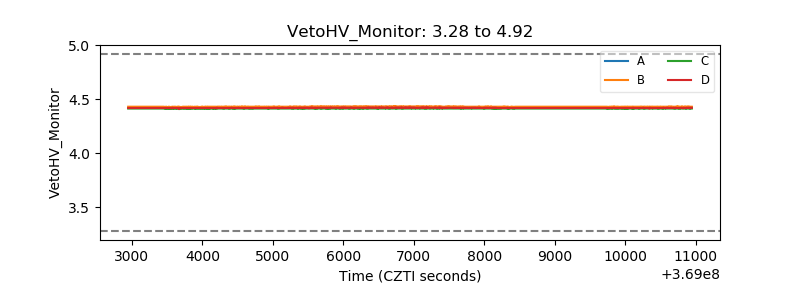 |
| Veto LLD | 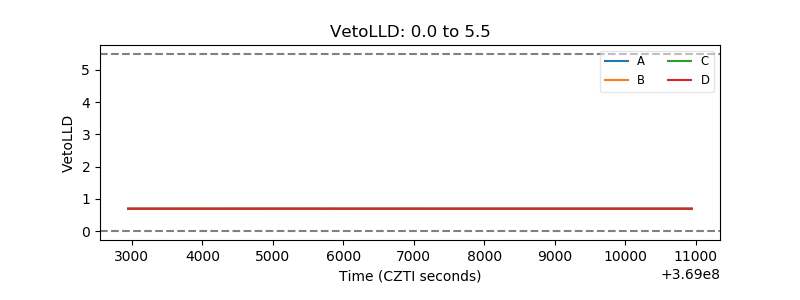 |
| Alpha Counter | 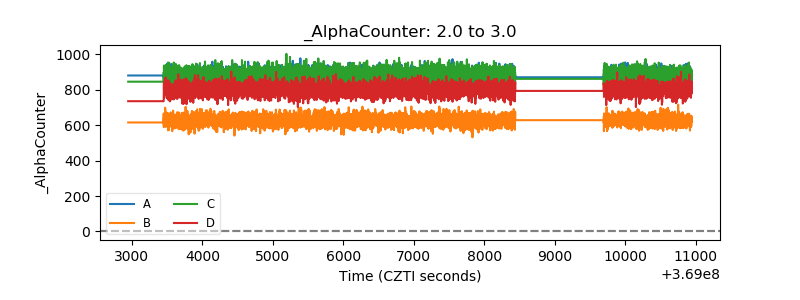 |
| _CPM_Rate | 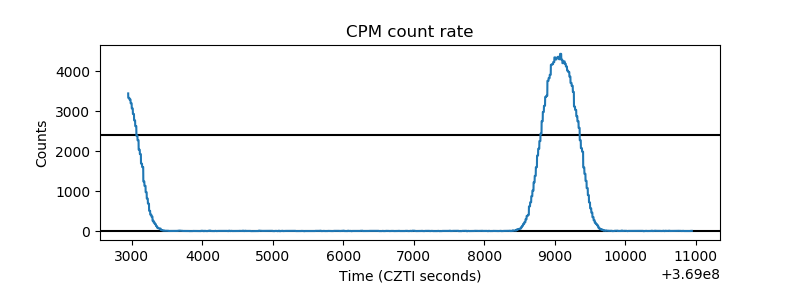 |
| CZT Counter | 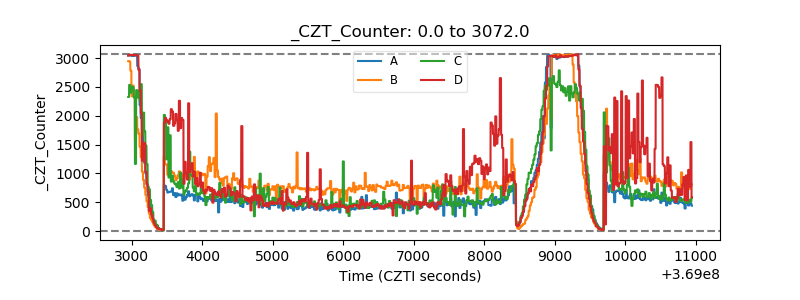 |
| +2.5 Volts monitor |  |
| +5 Volts monitor | 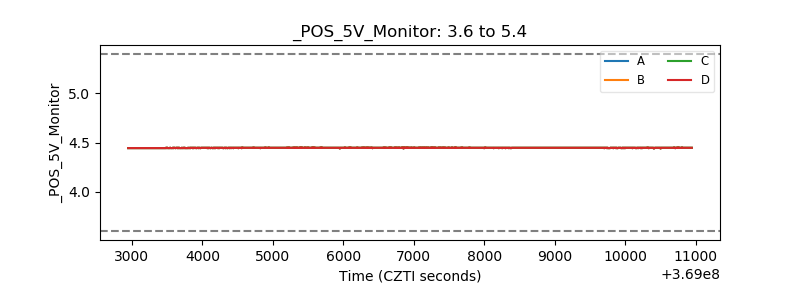 |
| _ROLL_ROT | 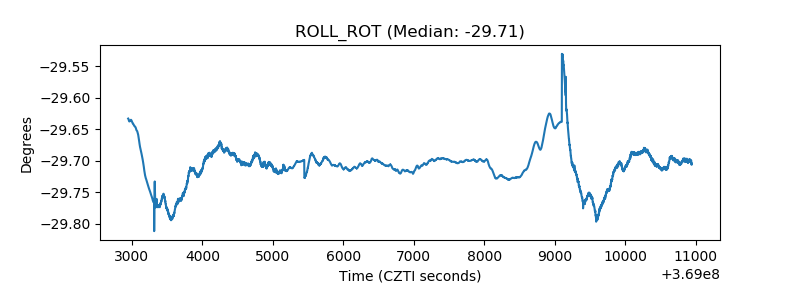 |
| _Roll_DEC | 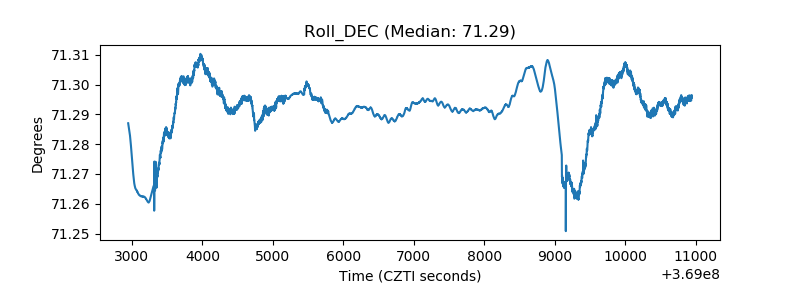 |
| _Roll_RA | 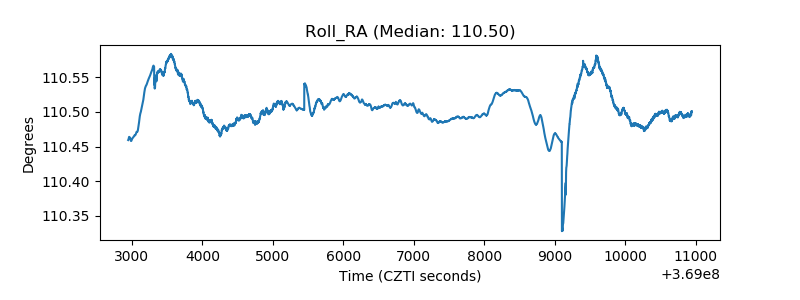 |
| Veto Counter | 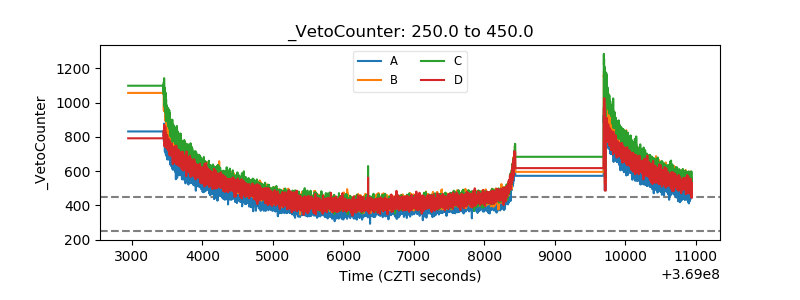 |