| Param | Original file | Final file |
|---|---|---|
| Filename | modeM0/AS1A09_131T01_9000004690_32192cztM0_level2.evt | modeM0/AS1A09_131T01_9000004690_32192cztM0_level2_quad_clean.evt |
| Size (bytes) | 586,998,720 | 134,035,200 |
| Size | 559.8 MB | 127.8 MB |
| Events in quadrant A | 3,188,788 | 922,568 |
| Events in quadrant B | 5,274,586 | 947,419 |
| Events in quadrant C | 3,680,071 | 911,209 |
| Events in quadrant D | 5,214,735 | 846,105 |
| Mode SS | |||
|---|---|---|---|
| Quadrant | BADHDUFLAG | Total packets | Discarded packets |
| A | 0 | 126 | 0 |
| B | 0 | 126 | 0 |
| C | 0 | 126 | 0 |
| D | 0 | 126 | 0 |
| Mode M0 | |||
|---|---|---|---|
| Quadrant | BADHDUFLAG | Total packets | Discarded packets |
| A | 0 | 13441 | 3 |
| B | 0 | 19848 | 2 |
| C | 0 | 14925 | 2 |
| D | 0 | 19586 | 2 |
| Mode M9 | |||
|---|---|---|---|
| Quadrant | BADHDUFLAG | Total packets | Discarded packets |
| A | 0 | 13 | 0 |
| B | 0 | 13 | 0 |
| C | 0 | 13 | 0 |
| D | 0 | 13 | 0 |
| Quadrant | Total seconds | Saturated seconds | Saturation percentage |
|---|---|---|---|
| A | 6194 | 39 | 0.629642% |
| B | 6194 | 202 | 3.261221% |
| C | 6194 | 355 | 5.731353% |
| D | 6195 | 590 | 9.523810% |
Noise dominated data is calculated using 1-second bins in cleaned event files. If a bin has >2000 counts, and if more than 50% of those come from <1% of pixels, then it is considered to be noise-dominated and hence unusable.
| Quadrant | # 1 sec bins | Bins with >0 counts | Bins with >2000 counts | High rate bins dominated by noise | Noise dominated (total time) | Noise dominated (detector-on time) | Marked lightcurve |
|---|---|---|---|---|---|---|---|
| A | 7534 | 6196 | 0 | 0 | 0.00% | 0.00% | 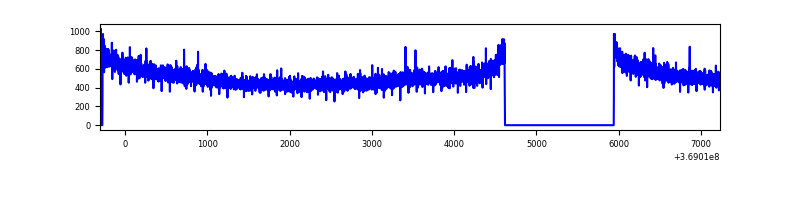 |
| B | 7534 | 6196 | 27 | 27 | 0.36% | 0.44% | 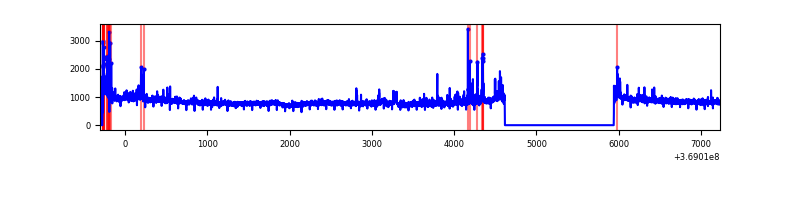 |
| C | 7534 | 6196 | 38 | 38 | 0.50% | 0.61% | 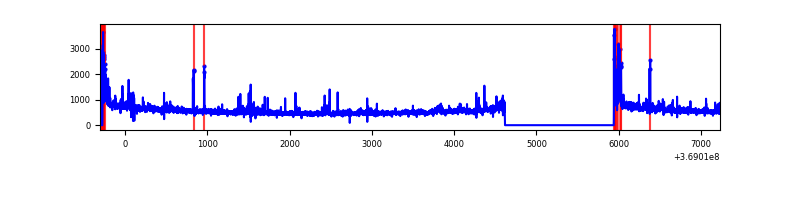 |
| D | 7535 | 6197 | 398 | 398 | 5.28% | 6.42% | 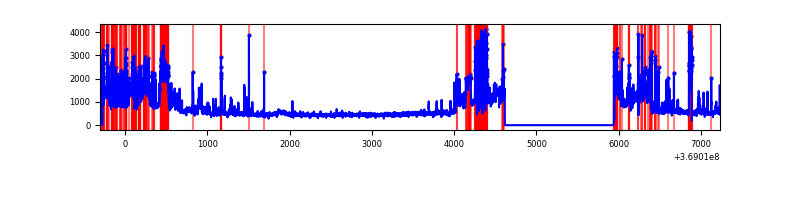 |
Top three noisy pixels from each quadrant. If the there are fewer than three noisy pixels in the level2.evt file, extra rows are filled as -1
| Pixel properties | Quadrant properties | ||||||
|---|---|---|---|---|---|---|---|
| Quadrant | DetID | PixID | Counts | Sigma | Mean | Median | Sigma |
| A | 13 | 6 | 17077 | 99.39 | 822 | 808 | 163.7 |
| A | 13 | 254 | 11825 | 67.31 | 822 | 808 | 163.7 |
| A | 3 | 137 | 7651 | 41.81 | 822 | 808 | 163.7 |
| B | 6 | 159 | 1769696 | 11565.13 | 824 | 803 | 153.0 |
| B | 5 | 172 | 90191 | 584.42 | 824 | 803 | 153.0 |
| B | 0 | 229 | 79803 | 516.51 | 824 | 803 | 153.0 |
| C | 0 | 10 | 208751 | 1149.54 | 791 | 799 | 180.9 |
| C | 14 | 238 | 177879 | 978.89 | 791 | 799 | 180.9 |
| C | 3 | 233 | 79365 | 434.31 | 791 | 799 | 180.9 |
| D | 8 | 195 | 1245845 | 6850.95 | 769 | 750 | 181.7 |
| D | 12 | 233 | 321941 | 1767.3 | 769 | 750 | 181.7 |
| D | 14 | 52 | 313311 | 1719.82 | 769 | 750 | 181.7 |
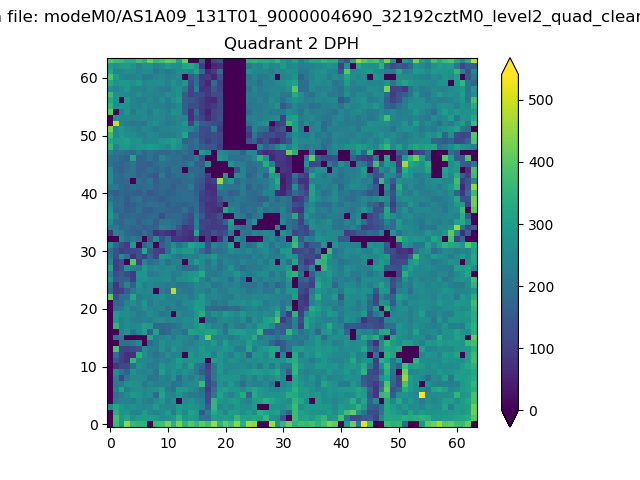
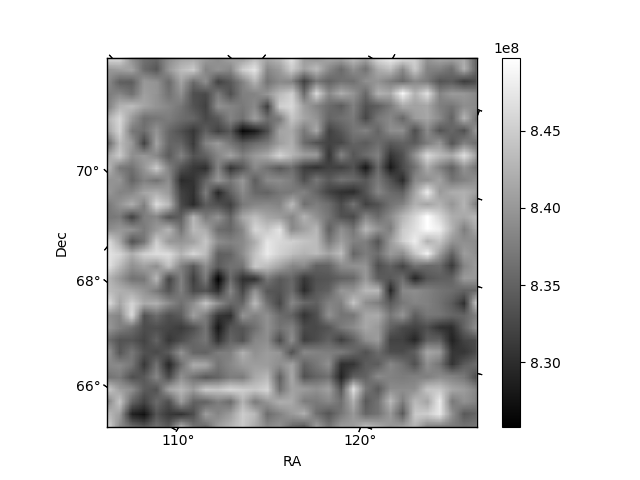
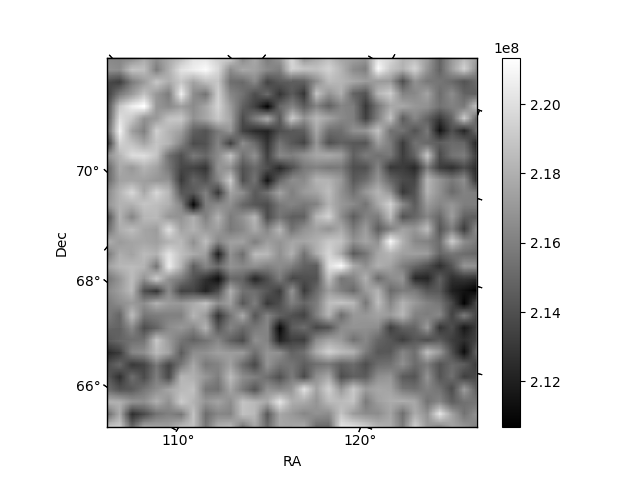
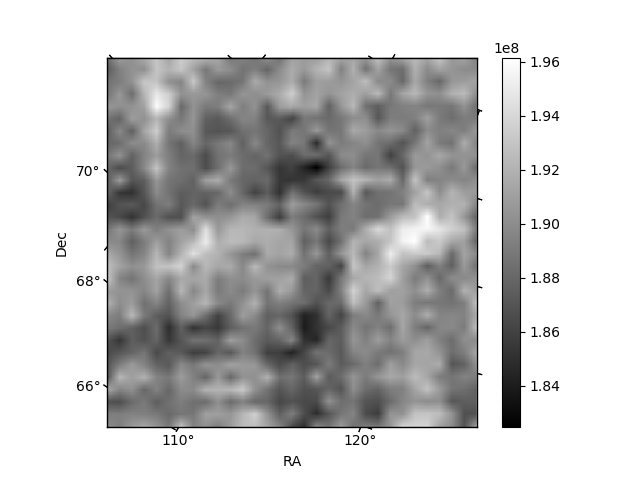
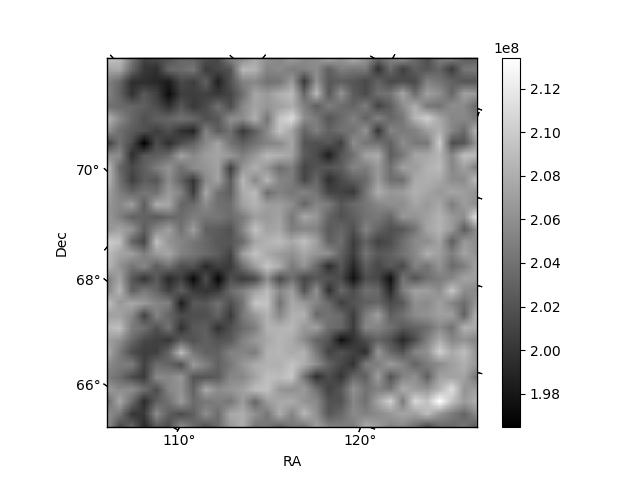
Histogram calculated using DETX and DETY for each event in the final _common_clean file
| Quadrant A | 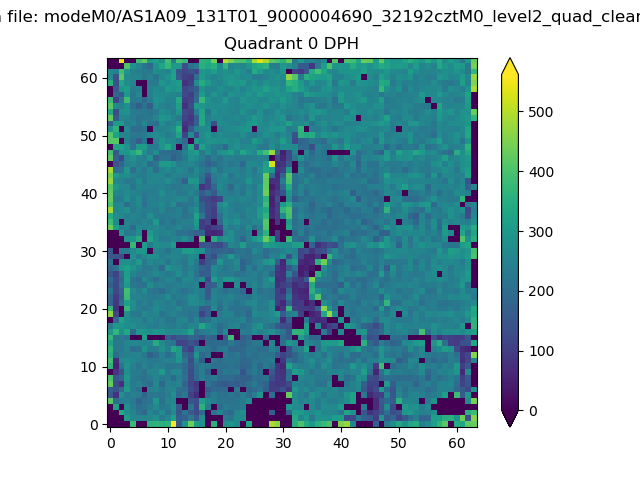 |
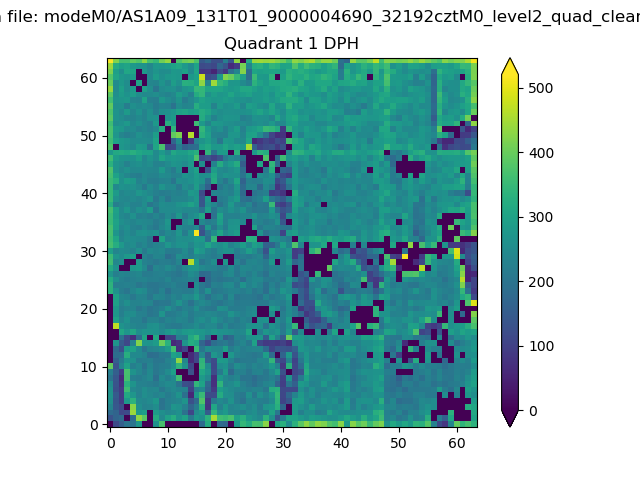 |
Quadrant B |
|---|---|---|---|
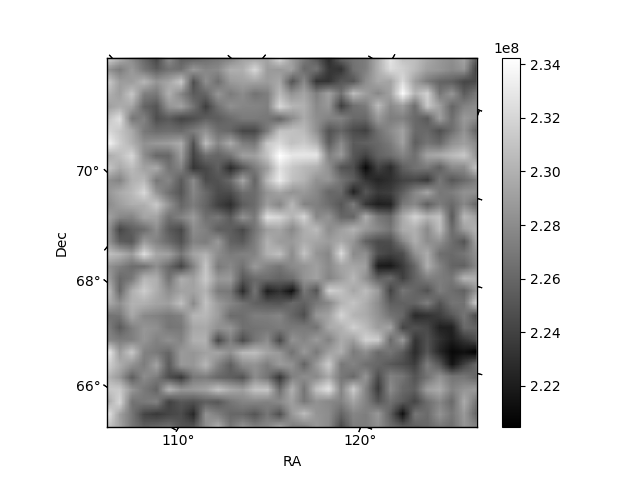
| Quadrant D | 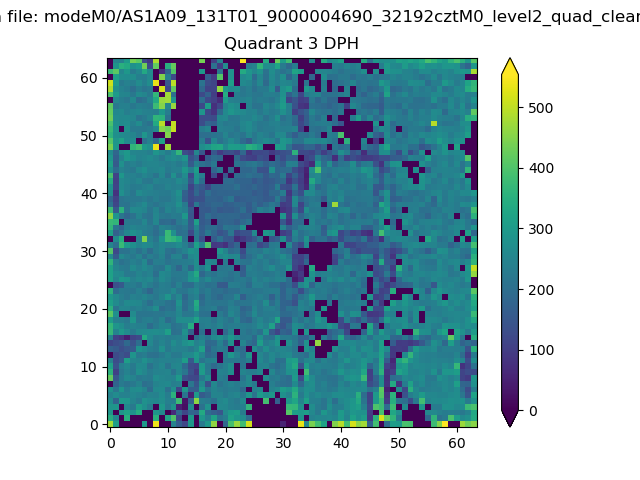 |
 |
Quadrant C |
| Plot type | Count rate plots | Images |
|---|---|---|
| Comparison with Poisson distribution Blue bars denote a histogram of data divided into 1 sec bins. Red curve is a Poisson curve with rate = median count rate of data. |
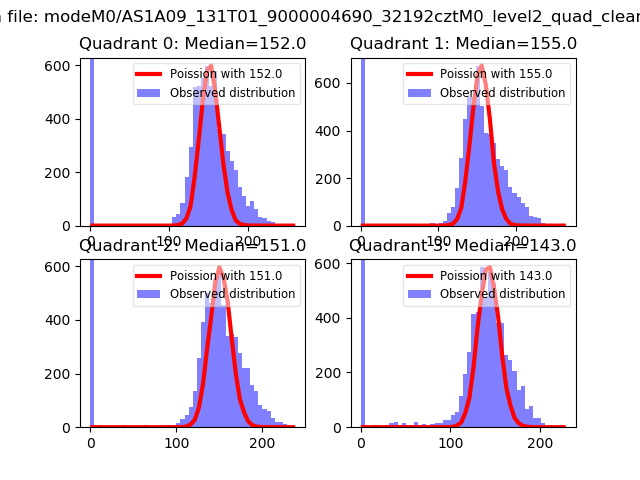 |
 |
| Quadrant-wise count rates Data is divided into 100 sec bins |
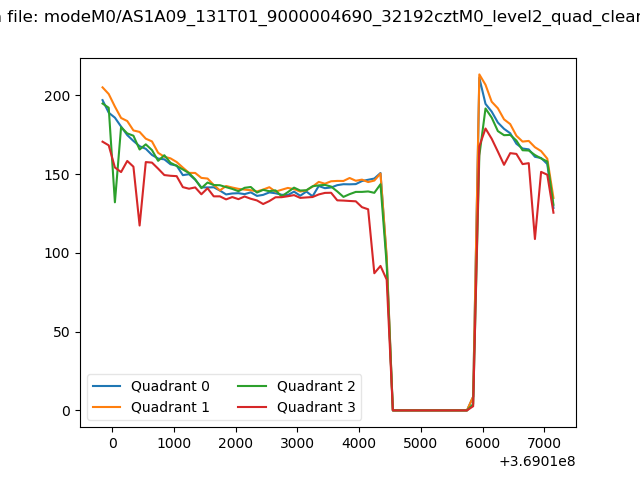 |
|
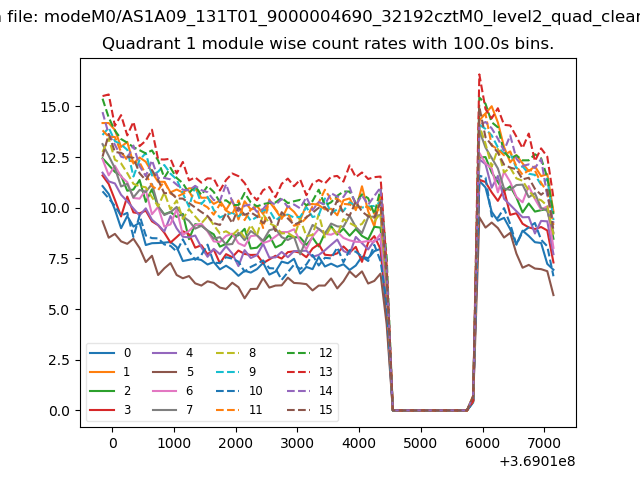
| Module-wise count rates for Quadrant A Data is divided into 100 sec bins |
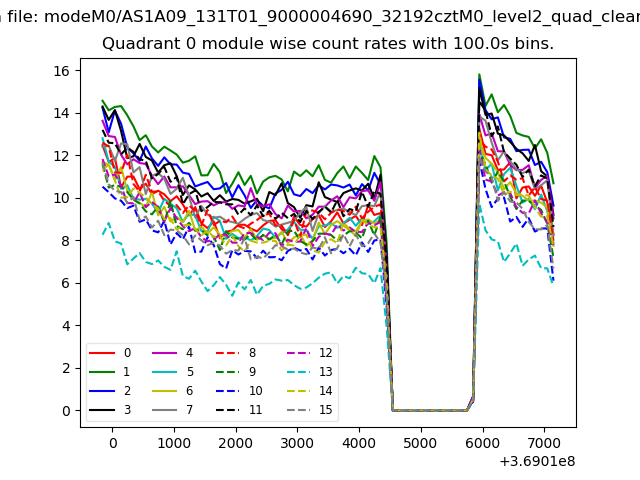 |
 |
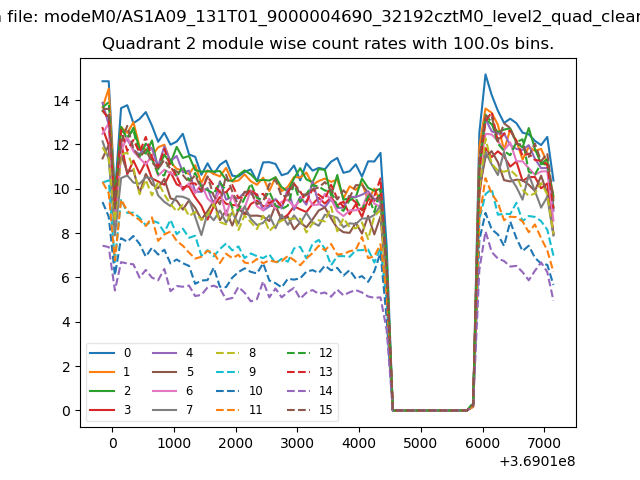
| Module-wise count rates for Quadrant B Data is divided into 100 sec bins |
 |
 |
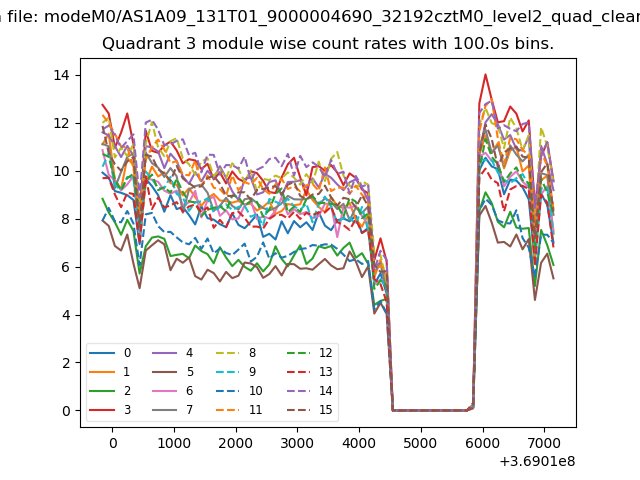
| Module-wise count rates for Quadrant C Data is divided into 100 sec bins |
 |
 |
| Module-wise count rates for Quadrant D Data is divided into 100 sec bins |
 |
 |
| Parameter | Plot |
|---|---|
| CZT HV Monitor |  |
| D_VDD | 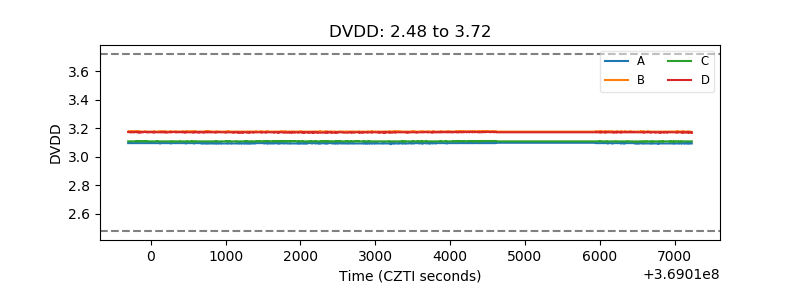 |
| Temperature 1 | 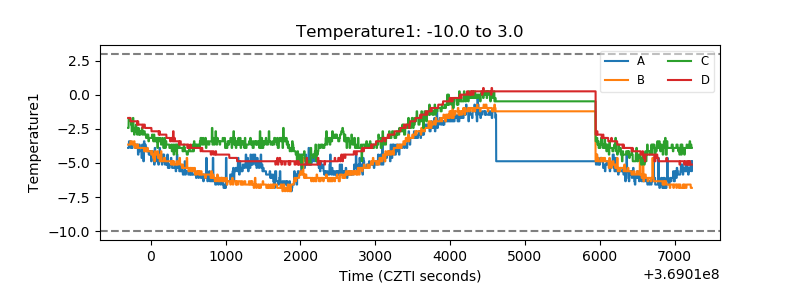 |
| Veto HV Monitor | 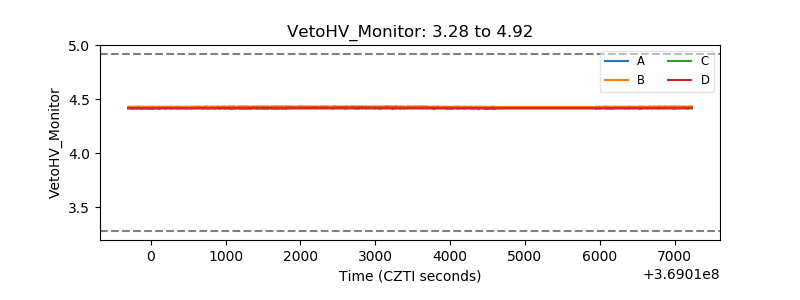 |
| Veto LLD |  |
| Alpha Counter | 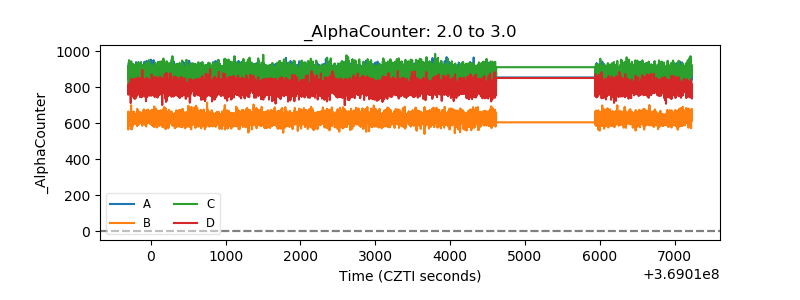 |
| _CPM_Rate | 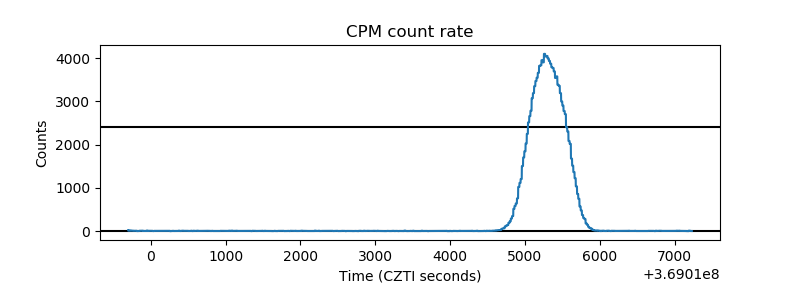 |
| CZT Counter | 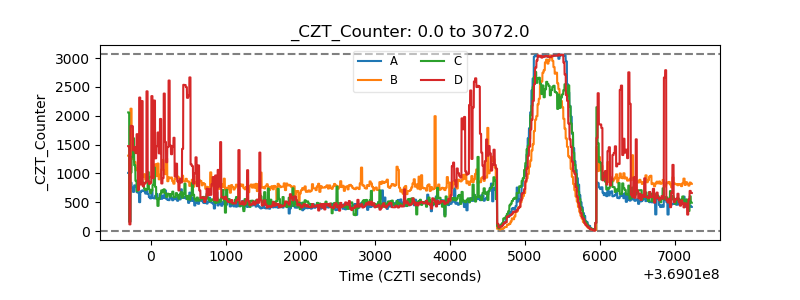 |
| +2.5 Volts monitor |  |
| +5 Volts monitor |  |
| _ROLL_ROT | 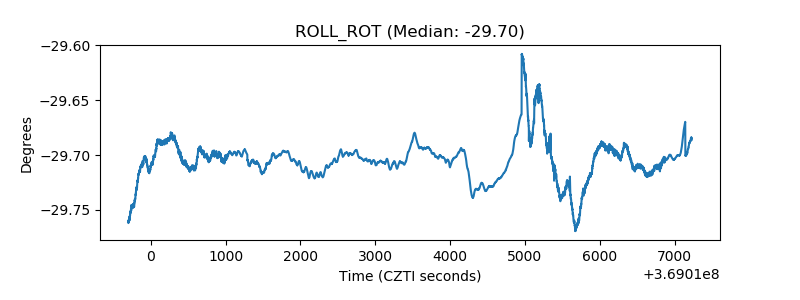 |
| _Roll_DEC | 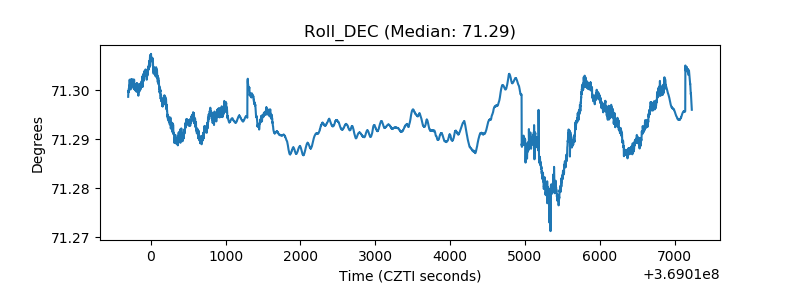 |
| _Roll_RA | 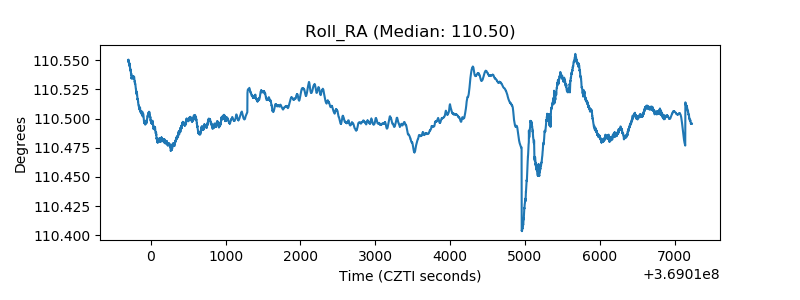 |
| Veto Counter | 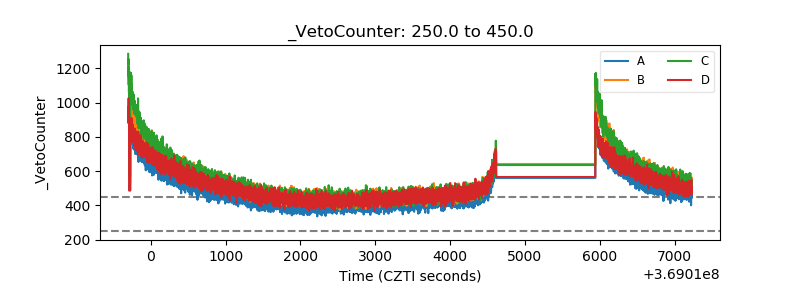 |