| Param | Original file | Final file |
|---|---|---|
| Filename | modeM0/AS1A09_131T01_9000004690_32193cztM0_level2.evt | modeM0/AS1A09_131T01_9000004690_32193cztM0_level2_quad_clean.evt |
| Size (bytes) | 568,270,080 | 133,490,880 |
| Size | 541.9 MB | 127.3 MB |
| Events in quadrant A | 3,304,221 | 913,163 |
| Events in quadrant B | 5,299,964 | 933,166 |
| Events in quadrant C | 3,856,067 | 889,742 |
| Events in quadrant D | 4,310,344 | 854,313 |
| Mode SS | |||
|---|---|---|---|
| Quadrant | BADHDUFLAG | Total packets | Discarded packets |
| A | 0 | 132 | 0 |
| B | 0 | 132 | 0 |
| C | 0 | 132 | 0 |
| D | 0 | 132 | 0 |
| Mode M0 | |||
|---|---|---|---|
| Quadrant | BADHDUFLAG | Total packets | Discarded packets |
| A | 0 | 13920 | 3 |
| B | 0 | 20225 | 2 |
| C | 0 | 15465 | 2 |
| D | 0 | 17050 | 2 |
| Mode M9 | |||
|---|---|---|---|
| Quadrant | BADHDUFLAG | Total packets | Discarded packets |
| A | 0 | 21 | 0 |
| B | 0 | 21 | 0 |
| C | 0 | 21 | 0 |
| D | 0 | 22 | 0 |
| Quadrant | Total seconds | Saturated seconds | Saturation percentage |
|---|---|---|---|
| A | 6483 | 34 | 0.524449% |
| B | 6483 | 178 | 2.745642% |
| C | 6483 | 392 | 6.046583% |
| D | 6483 | 284 | 4.380688% |
Noise dominated data is calculated using 1-second bins in cleaned event files. If a bin has >2000 counts, and if more than 50% of those come from <1% of pixels, then it is considered to be noise-dominated and hence unusable.
| Quadrant | # 1 sec bins | Bins with >0 counts | Bins with >2000 counts | High rate bins dominated by noise | Noise dominated (total time) | Noise dominated (detector-on time) | Marked lightcurve |
|---|---|---|---|---|---|---|---|
| A | 7823 | 6484 | 0 | 0 | 0.00% | 0.00% | 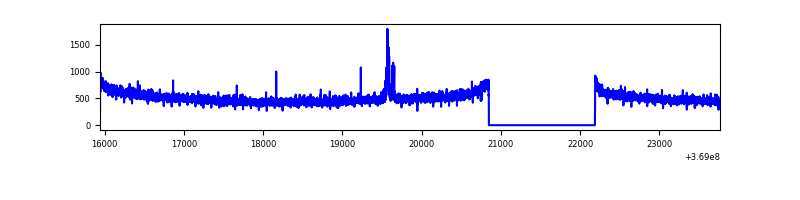 |
| B | 7823 | 6484 | 12 | 12 | 0.15% | 0.19% | 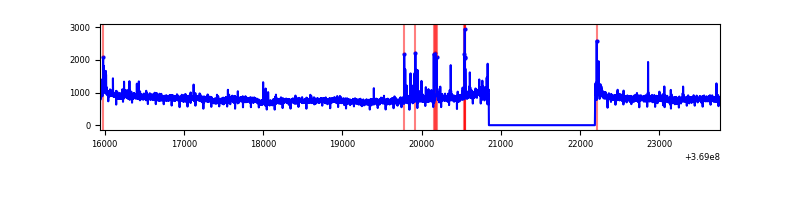 |
| C | 7823 | 6484 | 42 | 42 | 0.54% | 0.65% | 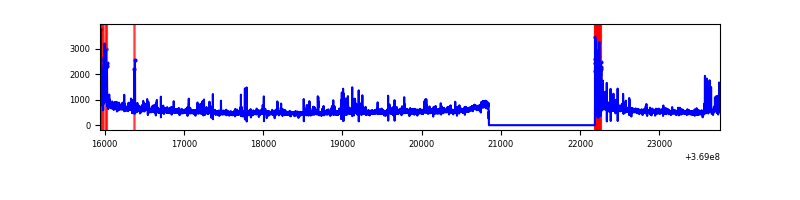 |
| D | 7823 | 6484 | 146 | 146 | 1.87% | 2.25% | 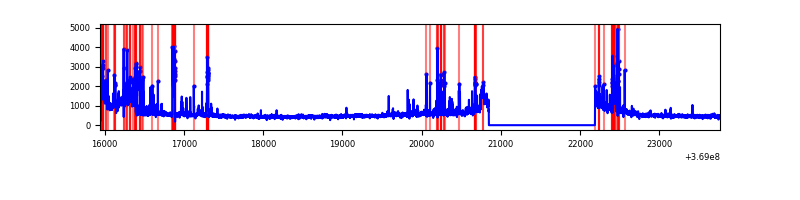 |
Top three noisy pixels from each quadrant. If the there are fewer than three noisy pixels in the level2.evt file, extra rows are filled as -1
| Pixel properties | Quadrant properties | ||||||
|---|---|---|---|---|---|---|---|
| Quadrant | DetID | PixID | Counts | Sigma | Mean | Median | Sigma |
| A | 15 | 174 | 41241 | 242.37 | 840 | 827 | 166.7 |
| A | 13 | 6 | 13882 | 78.29 | 840 | 827 | 166.7 |
| A | 13 | 254 | 12143 | 67.86 | 840 | 827 | 166.7 |
| B | 6 | 159 | 1812314 | 11768.99 | 843 | 824 | 153.9 |
| B | 0 | 229 | 69494 | 446.14 | 843 | 824 | 153.9 |
| B | 5 | 172 | 33055 | 209.4 | 843 | 824 | 153.9 |
| C | 0 | 10 | 246877 | 1336.09 | 803 | 809 | 184.2 |
| C | 14 | 238 | 205322 | 1110.45 | 803 | 809 | 184.2 |
| C | 14 | 254 | 100400 | 540.75 | 803 | 809 | 184.2 |
| D | 8 | 195 | 621983 | 3315.27 | 796 | 776 | 187.4 |
| D | 13 | 249 | 384095 | 2045.7 | 796 | 776 | 187.4 |
| D | 12 | 233 | 132549 | 703.25 | 796 | 776 | 187.4 |
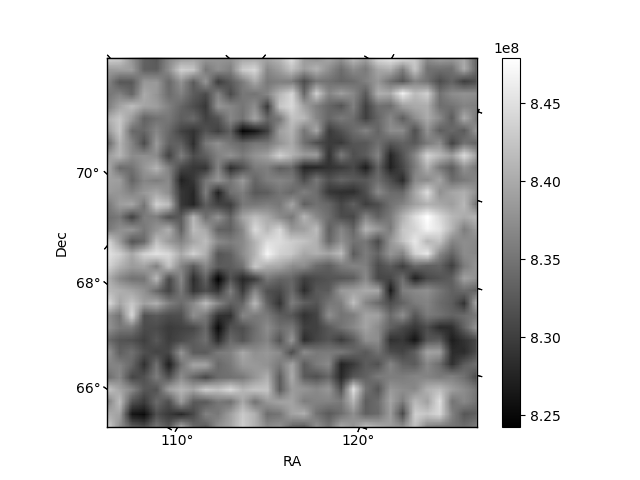
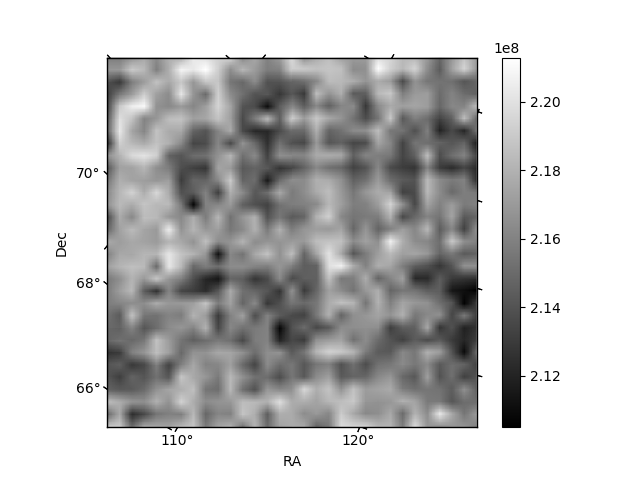
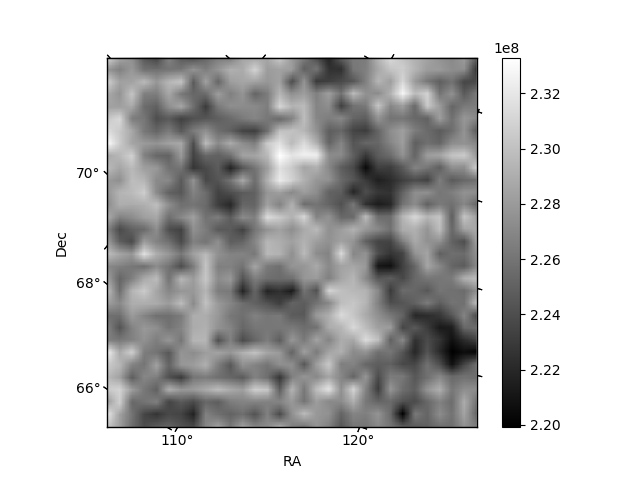
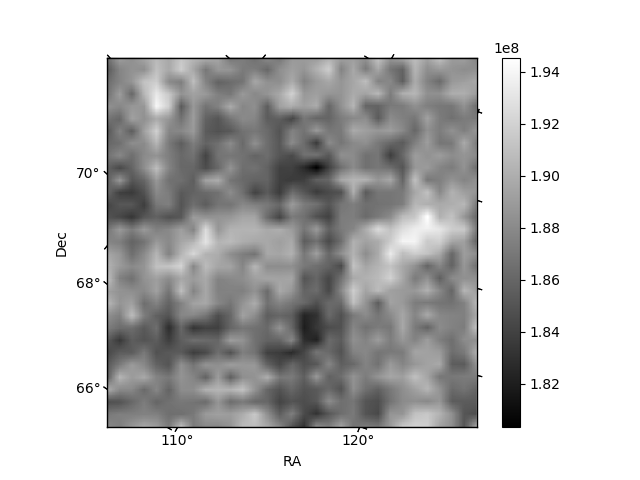
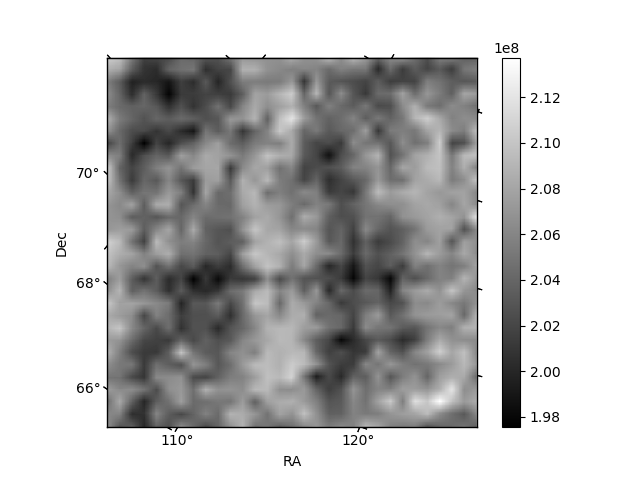
Histogram calculated using DETX and DETY for each event in the final _common_clean file
| Quadrant A | 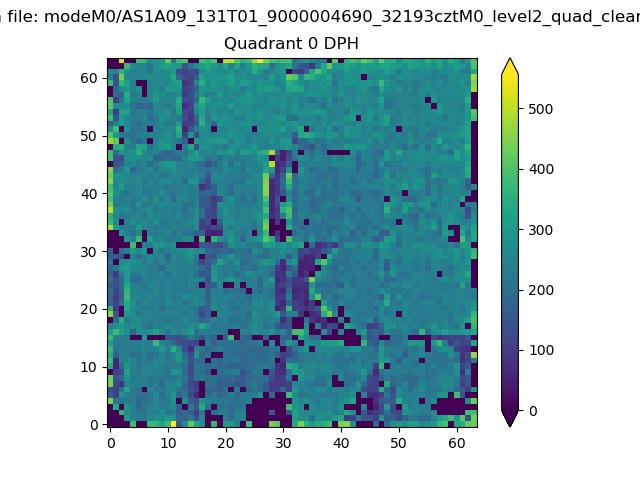 |
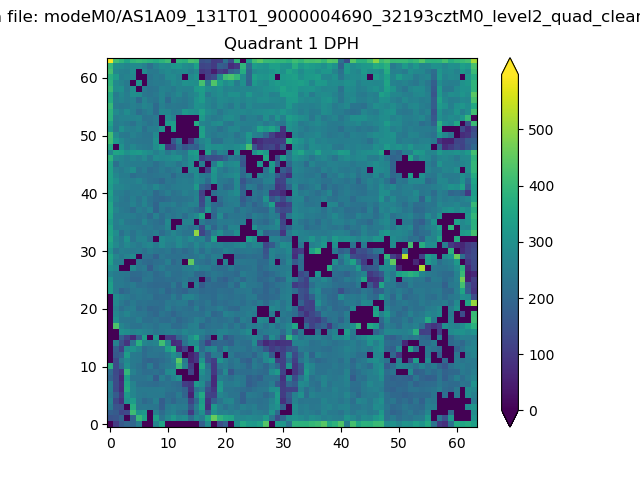 |
Quadrant B |
|---|---|---|---|
| Quadrant D | 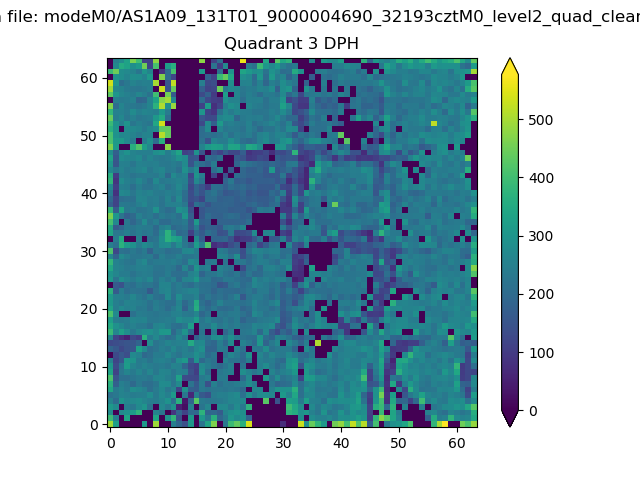 |
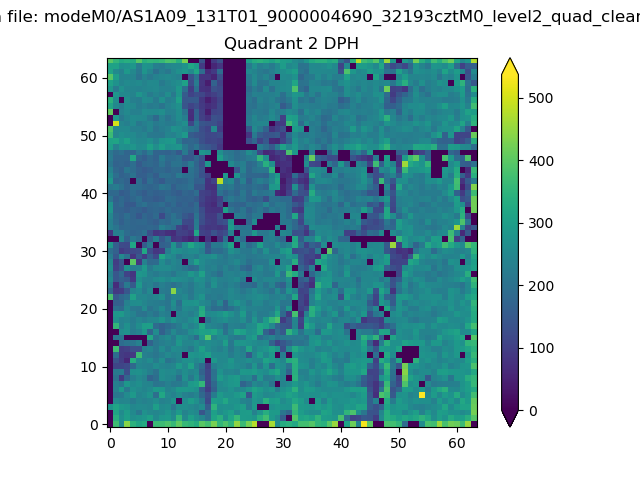 |
Quadrant C |
| Plot type | Count rate plots | Images |
|---|---|---|
| Comparison with Poisson distribution Blue bars denote a histogram of data divided into 1 sec bins. Red curve is a Poisson curve with rate = median count rate of data. |
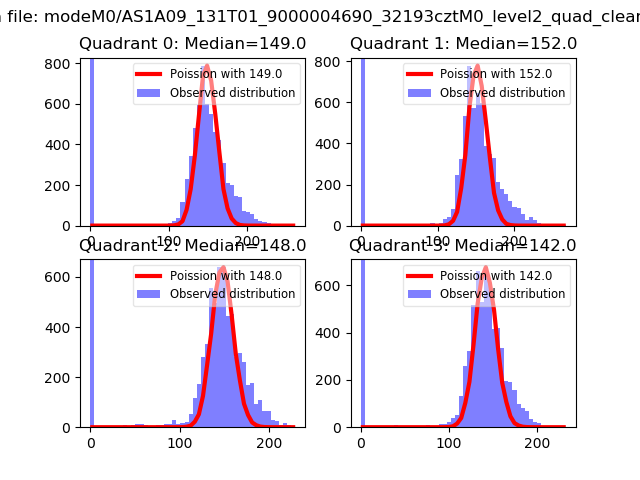 |
 |
| Quadrant-wise count rates Data is divided into 100 sec bins |
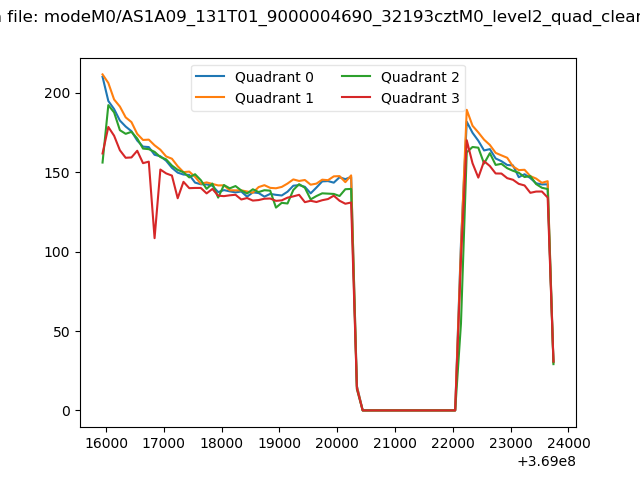 |
|
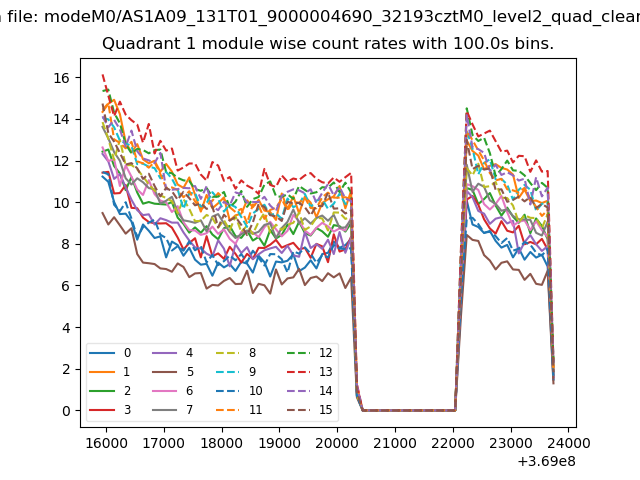
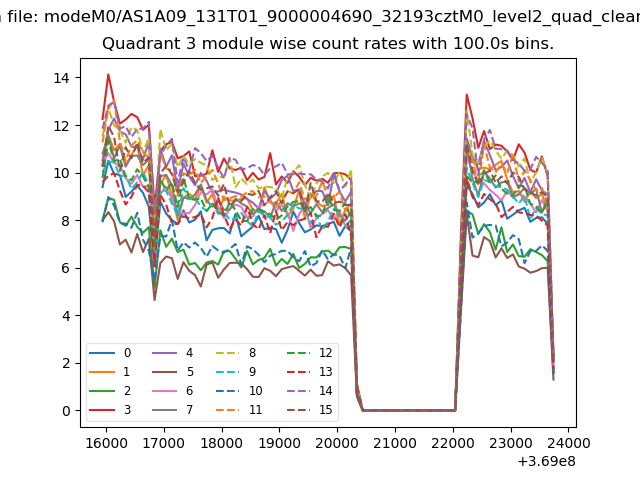
| Module-wise count rates for Quadrant A Data is divided into 100 sec bins |
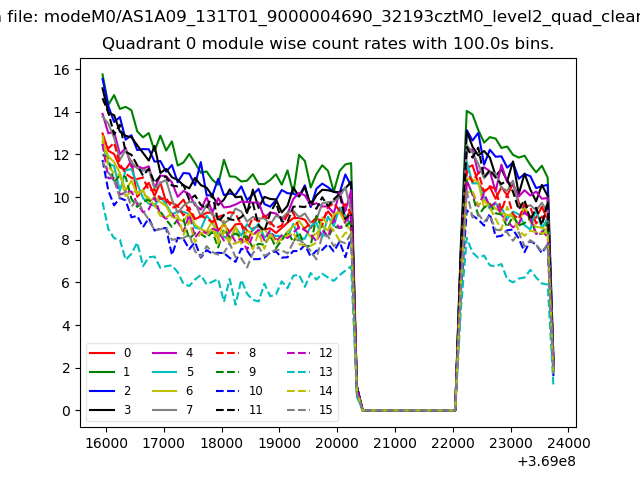 |
 |
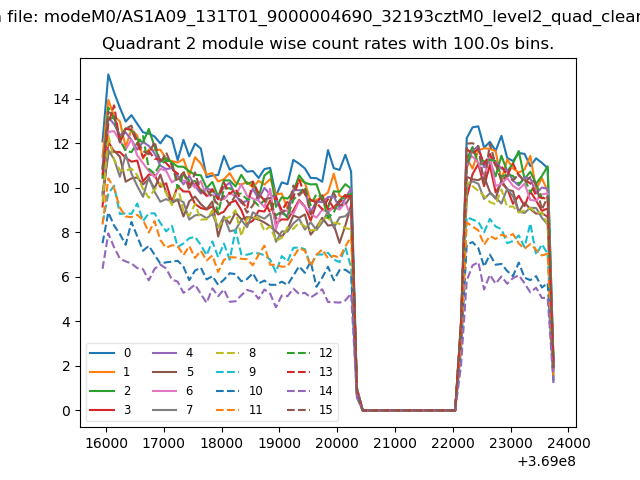
| Module-wise count rates for Quadrant B Data is divided into 100 sec bins |
 |
 |
| Module-wise count rates for Quadrant C Data is divided into 100 sec bins |
 |
 |
| Module-wise count rates for Quadrant D Data is divided into 100 sec bins |
 |
 |
| Parameter | Plot |
|---|---|
| CZT HV Monitor | 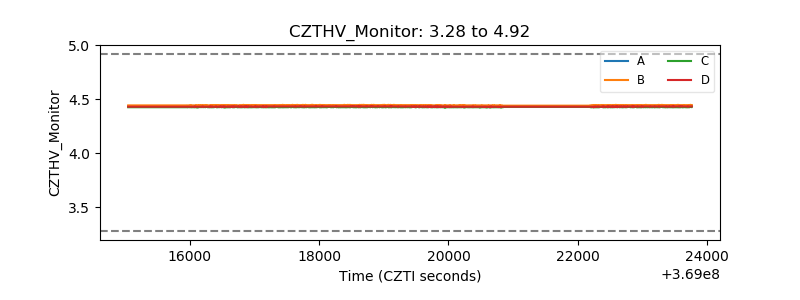 |
| D_VDD | 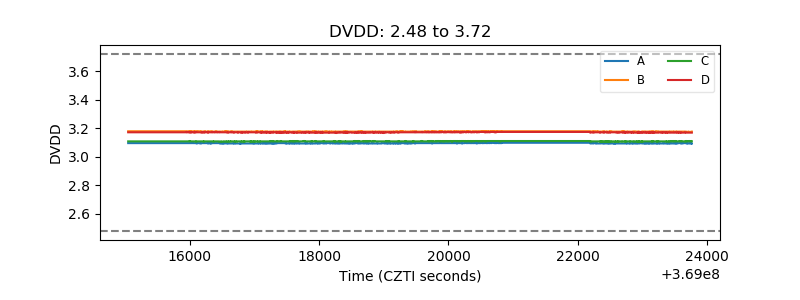 |
| Temperature 1 | 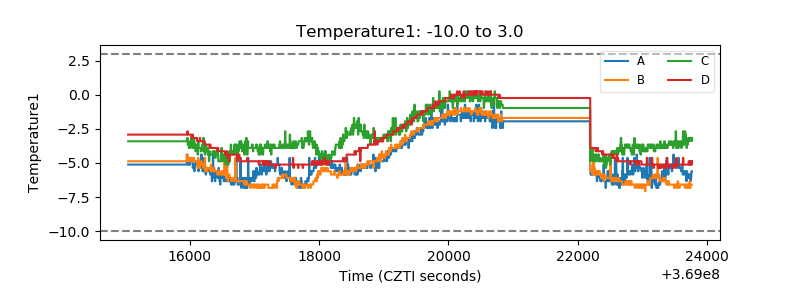 |
| Veto HV Monitor | 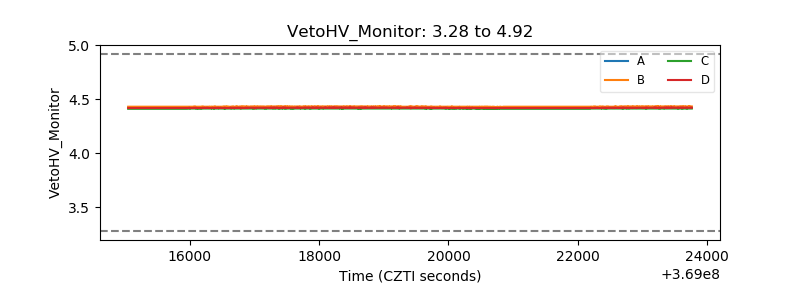 |
| Veto LLD | 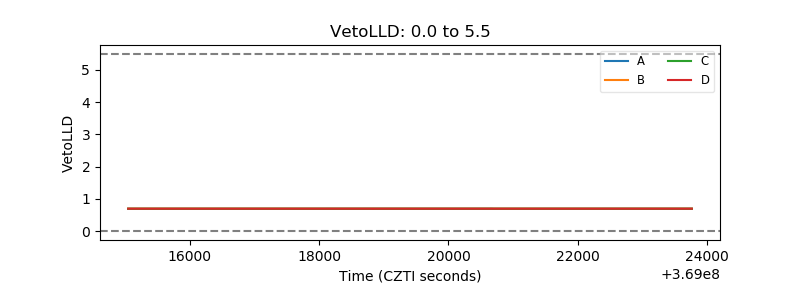 |
| Alpha Counter | 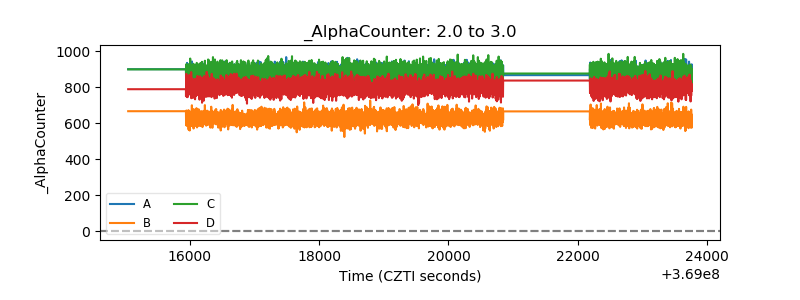 |
| _CPM_Rate | 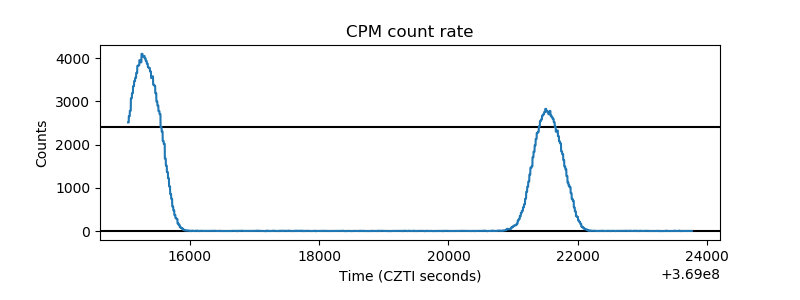 |
| CZT Counter | 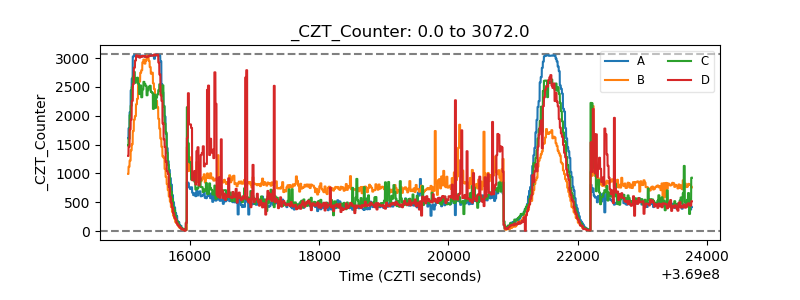 |
| +2.5 Volts monitor |  |
| +5 Volts monitor |  |
| _ROLL_ROT | 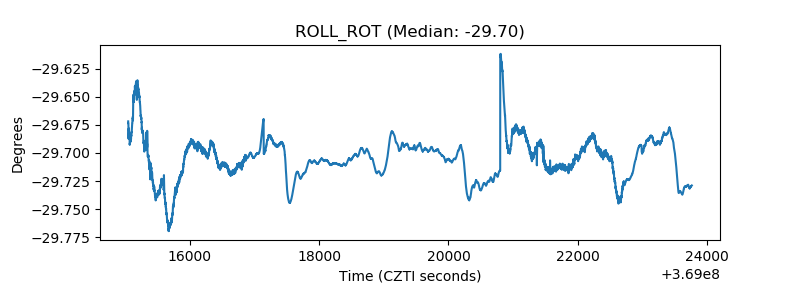 |
| _Roll_DEC | 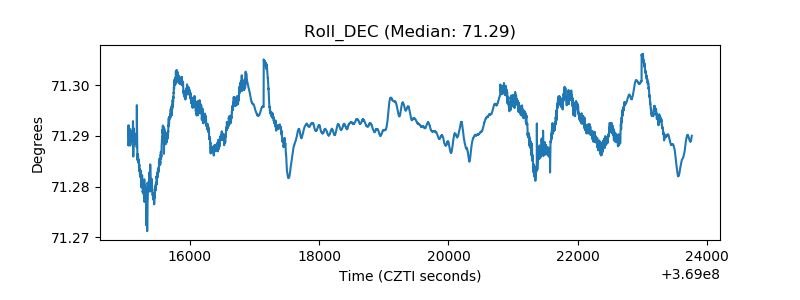 |
| _Roll_RA | 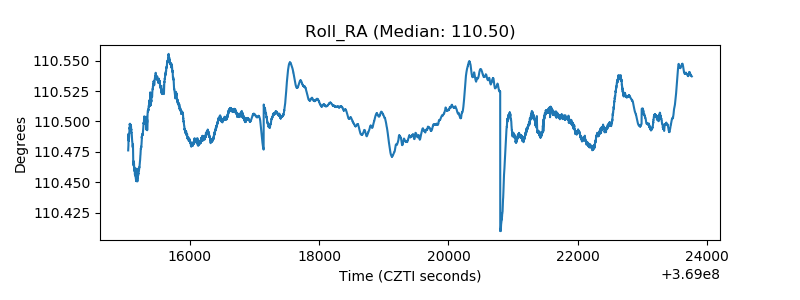 |
| Veto Counter |  |