| Param | Original file | Final file |
|---|---|---|
| Filename | modeM0/AS1A09_131T01_9000004690_32194cztM0_level2.evt | modeM0/AS1A09_131T01_9000004690_32194cztM0_level2_quad_clean.evt |
| Size (bytes) | 485,714,880 | 103,608,000 |
| Size | 463.2 MB | 98.8 MB |
| Events in quadrant A | 3,122,490 | 687,706 |
| Events in quadrant B | 4,656,069 | 704,511 |
| Events in quadrant C | 3,369,710 | 676,657 |
| Events in quadrant D | 3,163,773 | 658,959 |
| Mode SS | |||
|---|---|---|---|
| Quadrant | BADHDUFLAG | Total packets | Discarded packets |
| A | 0 | 120 | 0 |
| B | 0 | 120 | 0 |
| C | 0 | 120 | 0 |
| D | 0 | 120 | 0 |
| Mode M0 | |||
|---|---|---|---|
| Quadrant | BADHDUFLAG | Total packets | Discarded packets |
| A | 0 | 12969 | 2 |
| B | 0 | 18064 | 1 |
| C | 0 | 13669 | 1 |
| D | 0 | 13337 | 1 |
| Mode M9 | |||
|---|---|---|---|
| Quadrant | BADHDUFLAG | Total packets | Discarded packets |
| A | 0 | 12 | 0 |
| B | 0 | 12 | 0 |
| C | 0 | 12 | 0 |
| D | 0 | 12 | 0 |
| Quadrant | Total seconds | Saturated seconds | Saturation percentage |
|---|---|---|---|
| A | 5865 | 88 | 1.500426% |
| B | 5865 | 107 | 1.824382% |
| C | 5865 | 223 | 3.802217% |
| D | 5865 | 51 | 0.869565% |
Noise dominated data is calculated using 1-second bins in cleaned event files. If a bin has >2000 counts, and if more than 50% of those come from <1% of pixels, then it is considered to be noise-dominated and hence unusable.
| Quadrant | # 1 sec bins | Bins with >0 counts | Bins with >2000 counts | High rate bins dominated by noise | Noise dominated (total time) | Noise dominated (detector-on time) | Marked lightcurve |
|---|---|---|---|---|---|---|---|
| A | 7140 | 5866 | 49 | 49 | 0.69% | 0.84% | 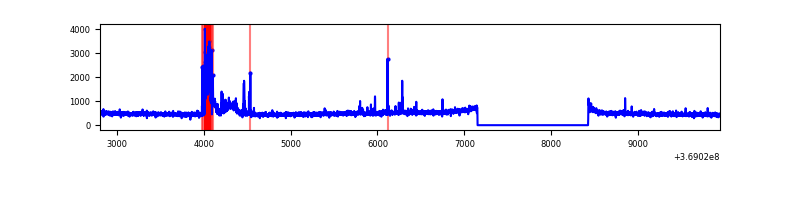 |
| B | 7140 | 5866 | 7 | 7 | 0.10% | 0.12% | 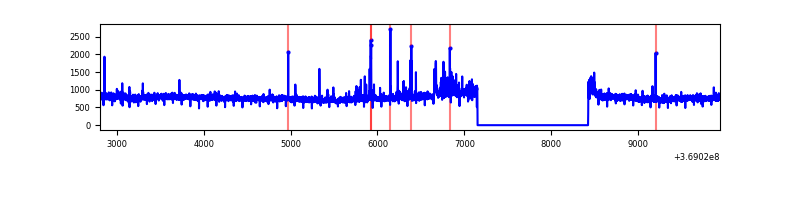 |
| C | 7140 | 5866 | 36 | 36 | 0.50% | 0.61% | 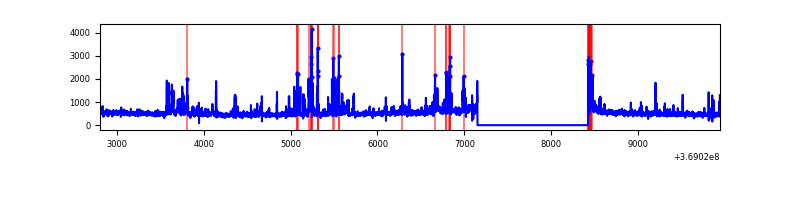 |
| D | 7140 | 5866 | 30 | 30 | 0.42% | 0.51% | 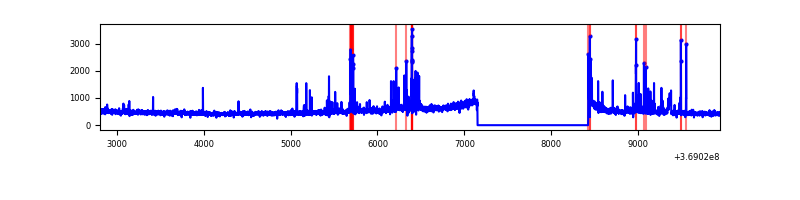 |
Top three noisy pixels from each quadrant. If the there are fewer than three noisy pixels in the level2.evt file, extra rows are filled as -1
| Pixel properties | Quadrant properties | ||||||
|---|---|---|---|---|---|---|---|
| Quadrant | DetID | PixID | Counts | Sigma | Mean | Median | Sigma |
| A | 15 | 174 | 329107 | 2300.84 | 719 | 708 | 142.7 |
| A | 13 | 6 | 11271 | 74.01 | 719 | 708 | 142.7 |
| A | 13 | 254 | 11254 | 73.89 | 719 | 708 | 142.7 |
| B | 6 | 159 | 1682262 | 12499.57 | 720 | 703 | 134.5 |
| B | 0 | 229 | 87679 | 646.52 | 720 | 703 | 134.5 |
| B | 5 | 172 | 22849 | 164.62 | 720 | 703 | 134.5 |
| C | 0 | 10 | 422608 | 2667.8 | 684 | 688 | 158.2 |
| C | 14 | 238 | 145888 | 918.1 | 684 | 688 | 158.2 |
| C | 14 | 254 | 46404 | 289.06 | 684 | 688 | 158.2 |
| D | 8 | 195 | 279848 | 1720.76 | 688 | 670 | 162.2 |
| D | 12 | 233 | 147130 | 902.73 | 688 | 670 | 162.2 |
| D | 12 | 218 | 36408 | 220.28 | 688 | 670 | 162.2 |
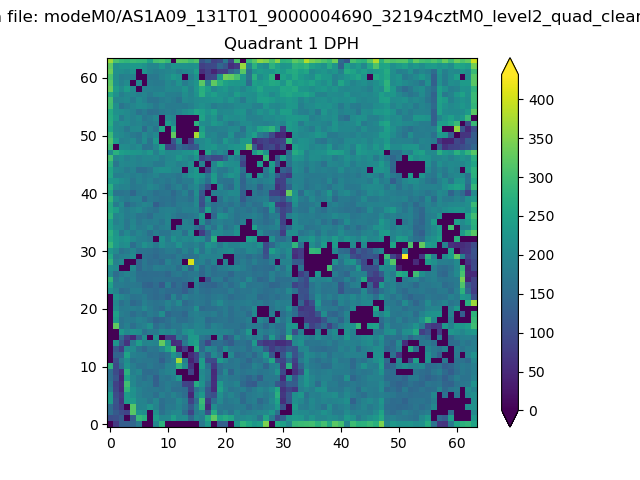
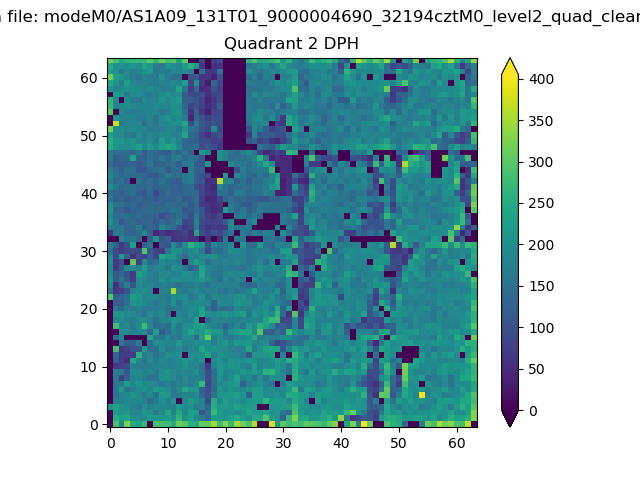
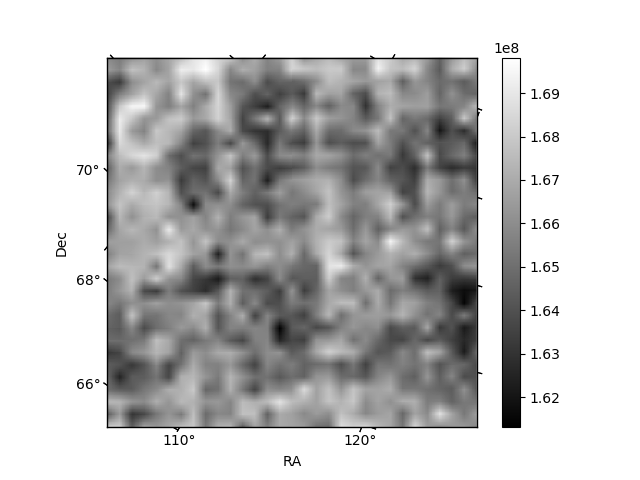
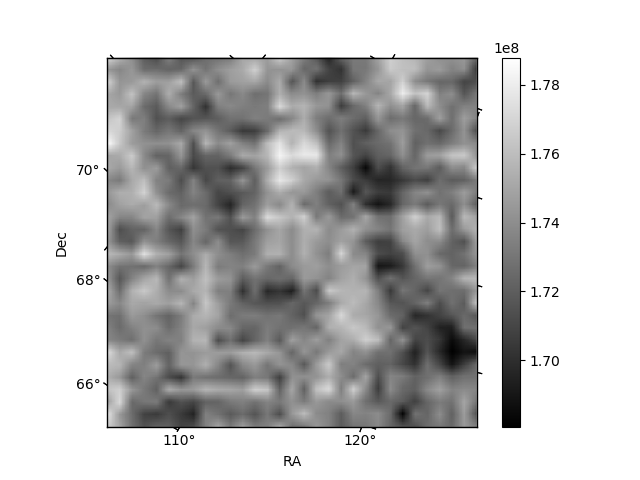
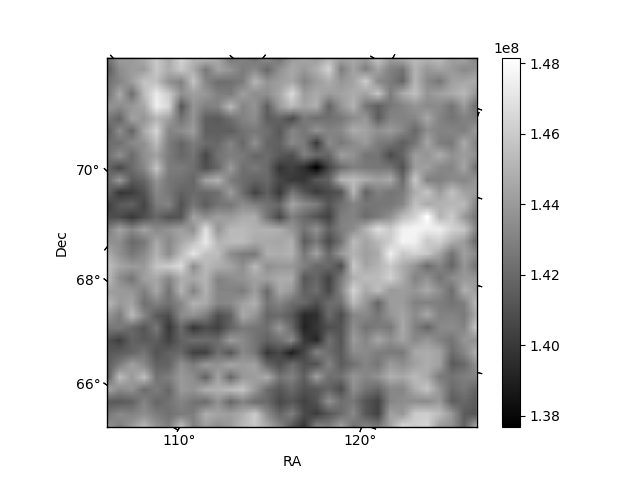
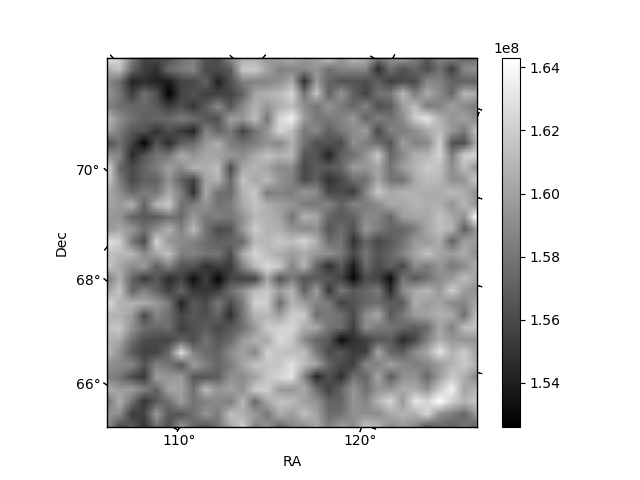
Histogram calculated using DETX and DETY for each event in the final _common_clean file
| Quadrant A |  |
 |
Quadrant B |
|---|---|---|---|
| Quadrant D |  |
 |
Quadrant C |
| Plot type | Count rate plots | Images |
|---|---|---|
| Comparison with Poisson distribution Blue bars denote a histogram of data divided into 1 sec bins. Red curve is a Poisson curve with rate = median count rate of data. |
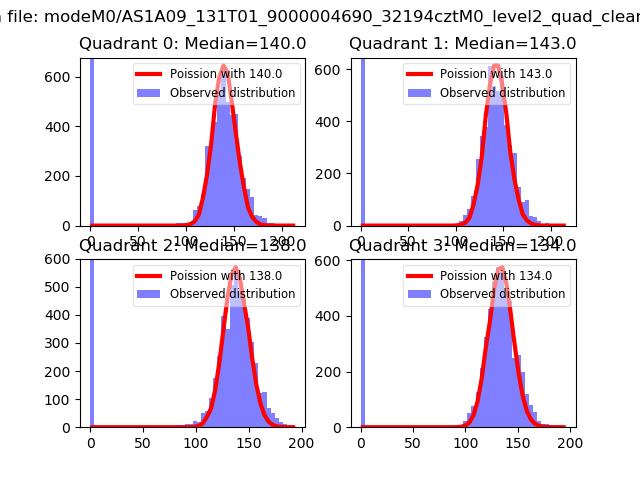 |
 |
| Quadrant-wise count rates Data is divided into 100 sec bins |
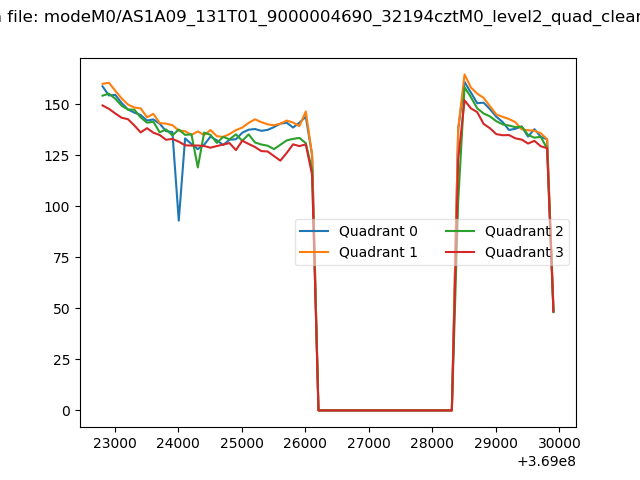 |
|
| Module-wise count rates for Quadrant A Data is divided into 100 sec bins |
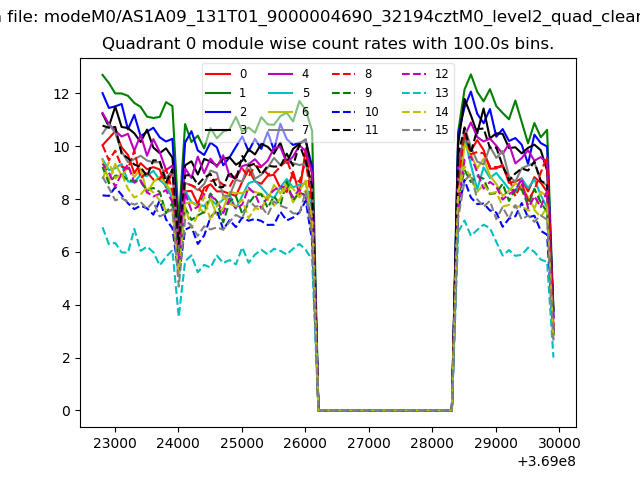 |
 |
| Module-wise count rates for Quadrant B Data is divided into 100 sec bins |
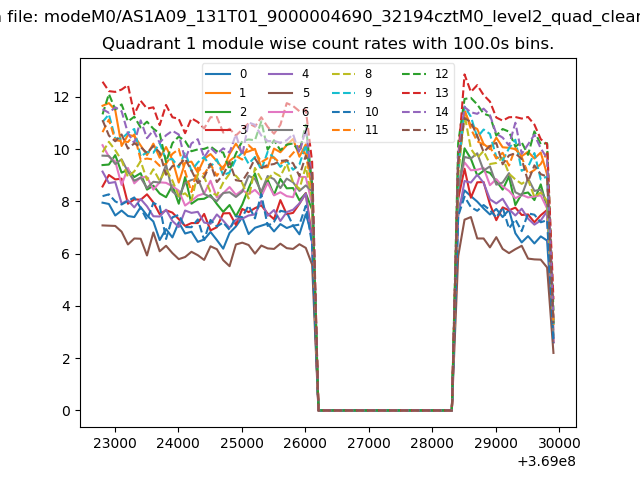 |
 |
| Module-wise count rates for Quadrant C Data is divided into 100 sec bins |
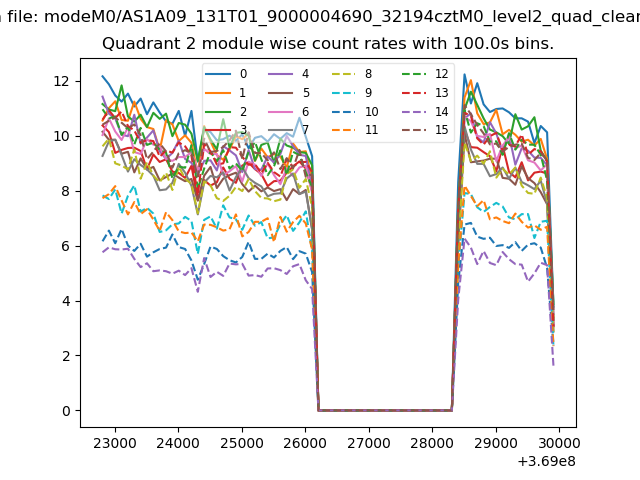 |
 |
| Module-wise count rates for Quadrant D Data is divided into 100 sec bins |
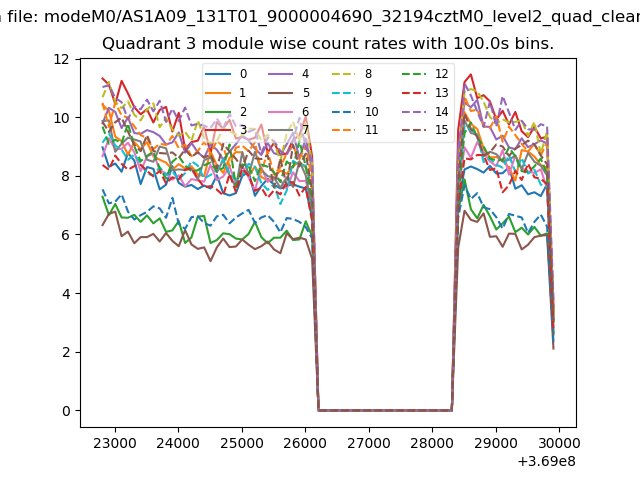 |
 |
| Parameter | Plot |
|---|---|
| CZT HV Monitor | 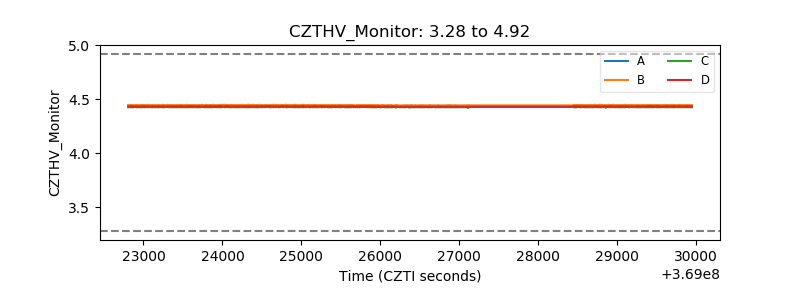 |
| D_VDD |  |
| Temperature 1 | 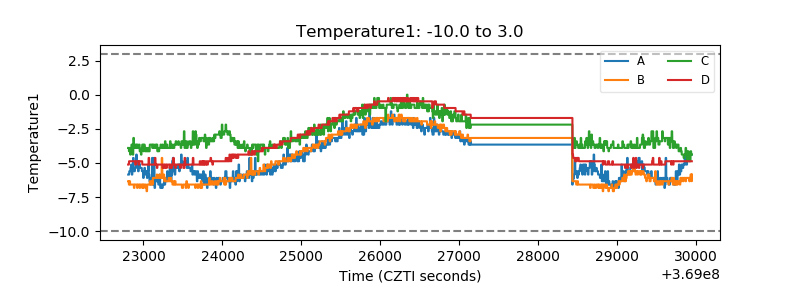 |
| Veto HV Monitor | 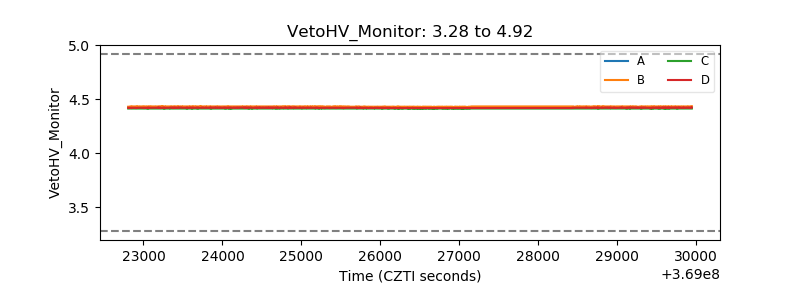 |
| Veto LLD |  |
| Alpha Counter | 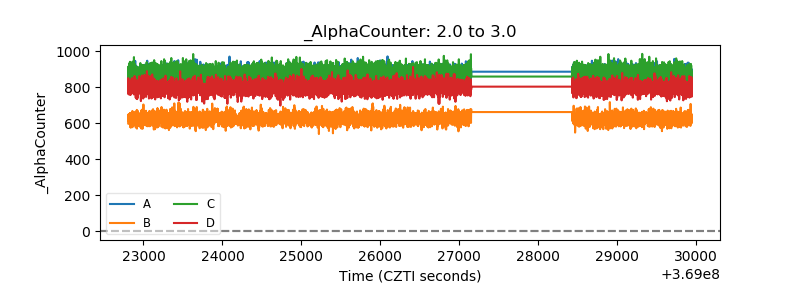 |
| _CPM_Rate | 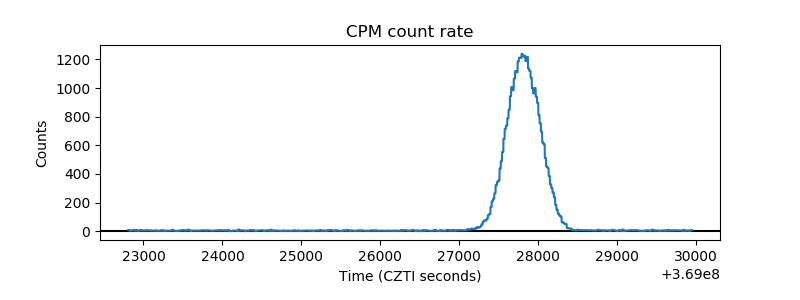 |
| CZT Counter | 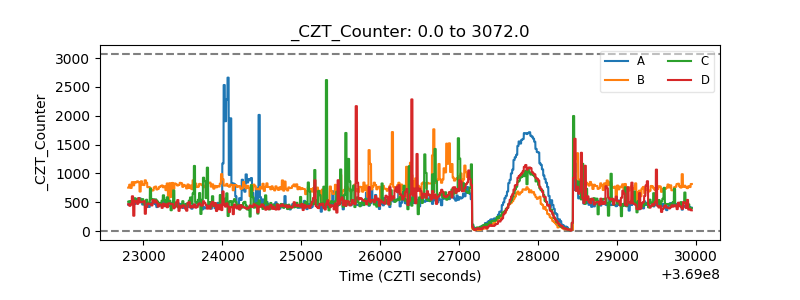 |
| +2.5 Volts monitor |  |
| +5 Volts monitor | 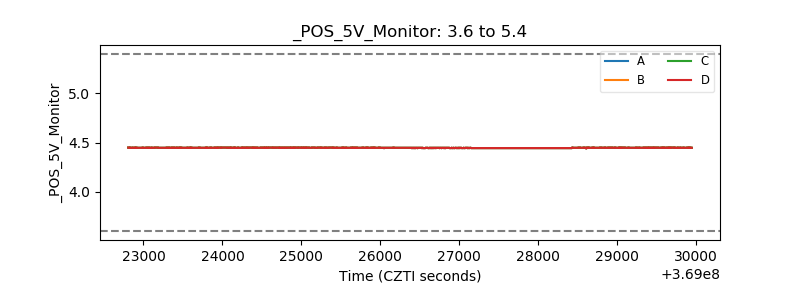 |
| _ROLL_ROT | 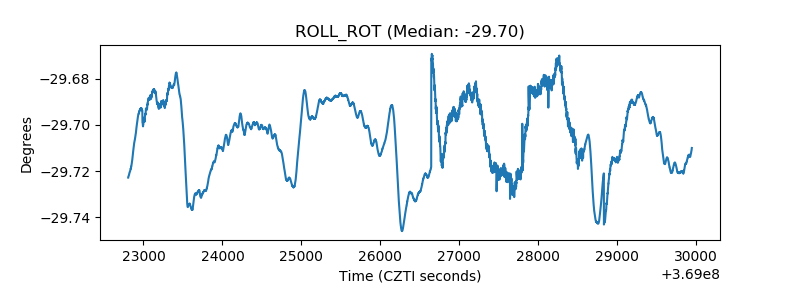 |
| _Roll_DEC | 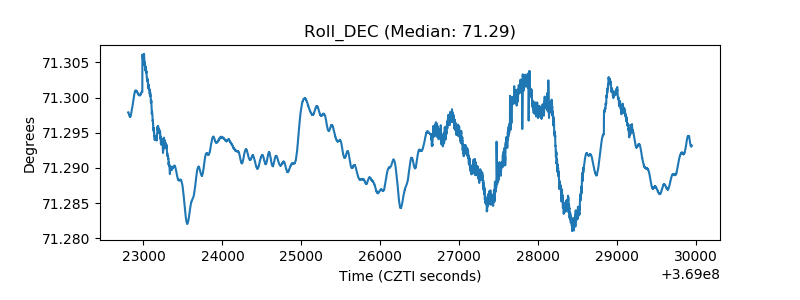 |
| _Roll_RA | 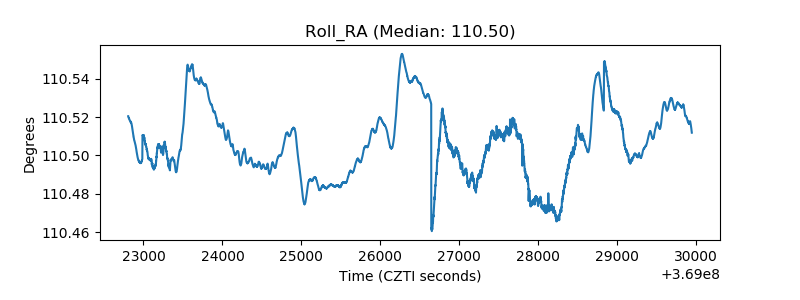 |
| Veto Counter | 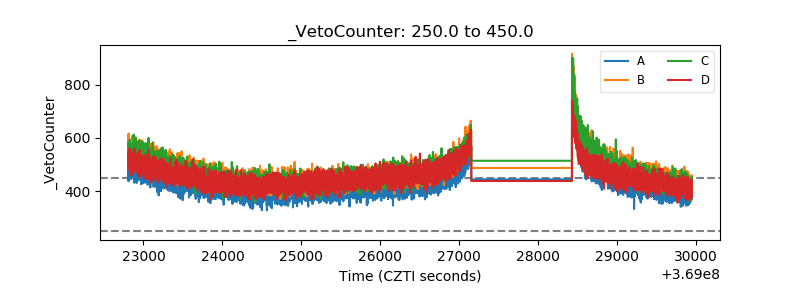 |