| Param | Original file | Final file |
|---|---|---|
| Filename | modeM0/AS1A09_131T01_9000004690_32197cztM0_level2.evt | modeM0/AS1A09_131T01_9000004690_32197cztM0_level2_quad_clean.evt |
| Size (bytes) | 1,121,132,160 | 199,442,880 |
| Size | 1.0 GB | 190.2 MB |
| Events in quadrant A | 5,933,414 | 1,319,195 |
| Events in quadrant B | 9,626,202 | 1,328,828 |
| Events in quadrant C | 7,431,193 | 1,295,396 |
| Events in quadrant D | 10,115,745 | 1,228,932 |
| Mode SS | |||
|---|---|---|---|
| Quadrant | BADHDUFLAG | Total packets | Discarded packets |
| A | 0 | 252 | 0 |
| B | 0 | 252 | 0 |
| C | 0 | 252 | 0 |
| D | 0 | 252 | 0 |
| Mode M0 | |||
|---|---|---|---|
| Quadrant | BADHDUFLAG | Total packets | Discarded packets |
| A | 0 | 25968 | 2 |
| B | 0 | 38542 | 1 |
| C | 0 | 30151 | 1 |
| D | 0 | 38847 | 1 |
| Mode M9 | |||
|---|---|---|---|
| Quadrant | BADHDUFLAG | Total packets | Discarded packets |
| A | 0 | 6 | 0 |
| B | 0 | 6 | 0 |
| C | 0 | 6 | 0 |
| D | 0 | 6 | 0 |
| Quadrant | Total seconds | Saturated seconds | Saturation percentage |
|---|---|---|---|
| A | 12561 | 259 | 2.061938% |
| B | 12561 | 449 | 3.574556% |
| C | 12561 | 758 | 6.034551% |
| D | 12561 | 720 | 5.732028% |
Noise dominated data is calculated using 1-second bins in cleaned event files. If a bin has >2000 counts, and if more than 50% of those come from <1% of pixels, then it is considered to be noise-dominated and hence unusable.
| Quadrant | # 1 sec bins | Bins with >0 counts | Bins with >2000 counts | High rate bins dominated by noise | Noise dominated (total time) | Noise dominated (detector-on time) | Marked lightcurve |
|---|---|---|---|---|---|---|---|
| A | 13136 | 12562 | 1 | 1 | 0.01% | 0.01% | 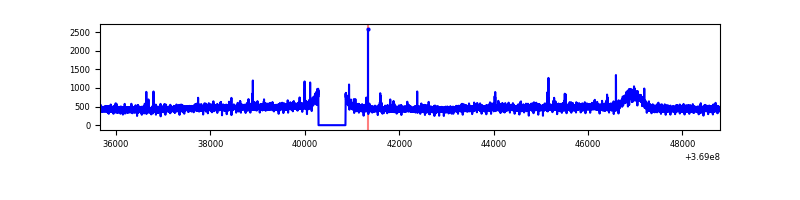 |
| B | 13136 | 12562 | 38 | 38 | 0.29% | 0.30% | 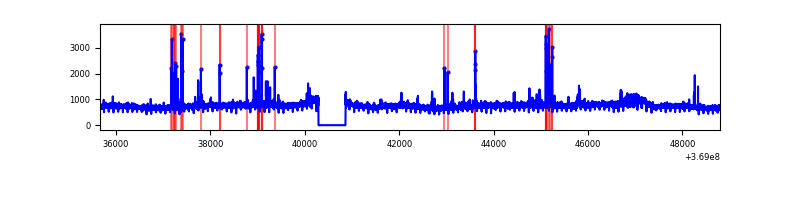 |
| C | 13136 | 12562 | 38 | 38 | 0.29% | 0.30% | 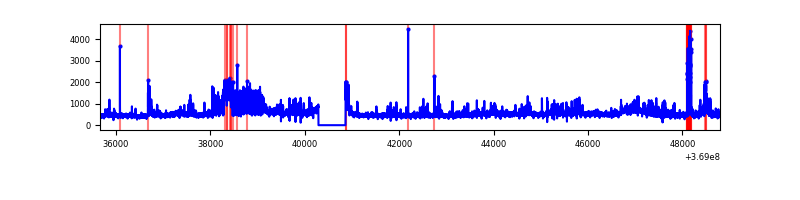 |
| D | 13136 | 12562 | 434 | 434 | 3.30% | 3.45% | 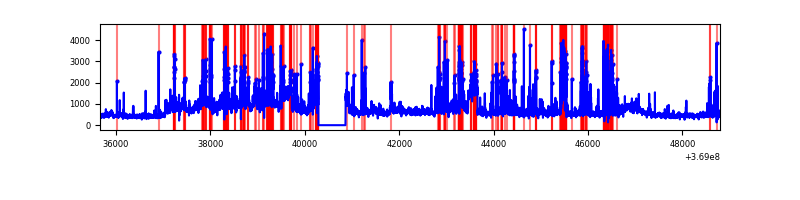 |
Top three noisy pixels from each quadrant. If the there are fewer than three noisy pixels in the level2.evt file, extra rows are filled as -1
| Pixel properties | Quadrant properties | ||||||
|---|---|---|---|---|---|---|---|
| Quadrant | DetID | PixID | Counts | Sigma | Mean | Median | Sigma |
| A | 12 | 96 | 40877 | 129.26 | 1519 | 1485 | 304.7 |
| A | 13 | 6 | 24787 | 76.46 | 1519 | 1485 | 304.7 |
| A | 13 | 254 | 23482 | 72.18 | 1519 | 1485 | 304.7 |
| B | 6 | 159 | 3369751 | 11885.07 | 1497 | 1458 | 283.4 |
| B | 5 | 172 | 114812 | 399.97 | 1497 | 1458 | 283.4 |
| B | 0 | 190 | 88798 | 308.18 | 1497 | 1458 | 283.4 |
| C | 3 | 233 | 1082642 | 3239.32 | 1435 | 1442 | 333.8 |
| C | 14 | 238 | 311350 | 928.5 | 1435 | 1442 | 333.8 |
| C | 0 | 10 | 266335 | 793.63 | 1435 | 1442 | 333.8 |
| D | 8 | 195 | 2585780 | 7592.66 | 1440 | 1400 | 340.4 |
| D | 12 | 233 | 669197 | 1961.92 | 1440 | 1400 | 340.4 |
| D | 2 | 250 | 538544 | 1578.08 | 1440 | 1400 | 340.4 |
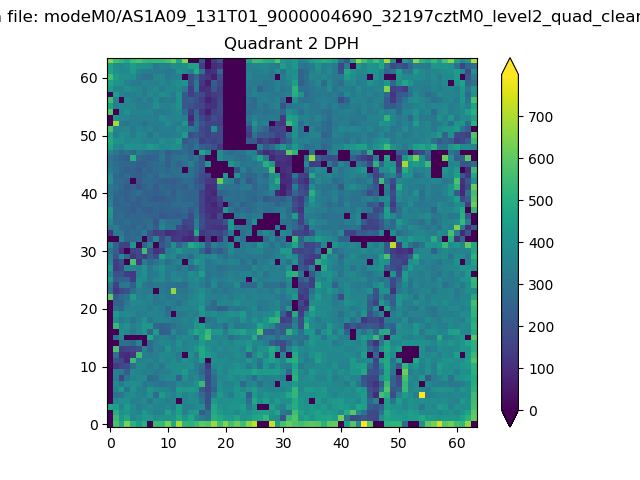
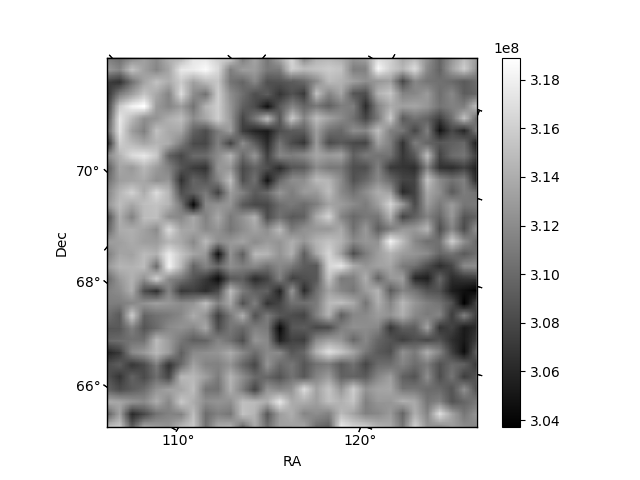
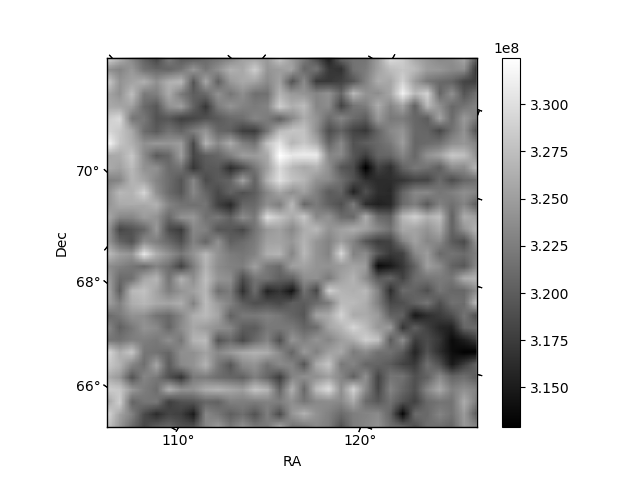
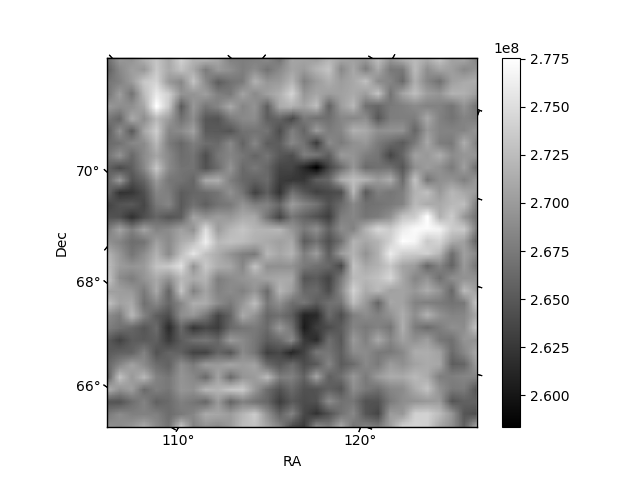
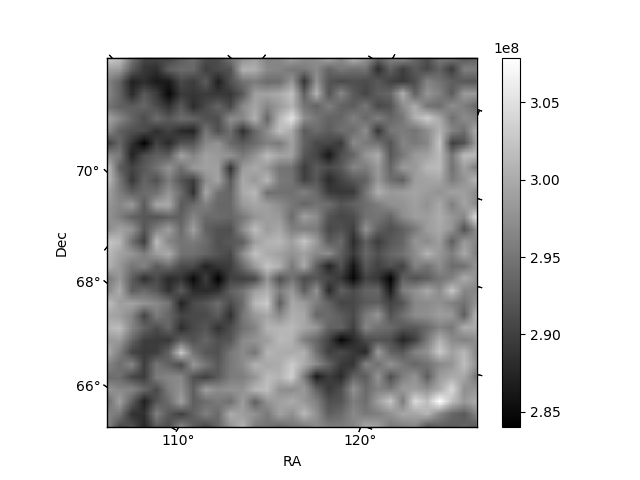
Histogram calculated using DETX and DETY for each event in the final _common_clean file
| Quadrant A | 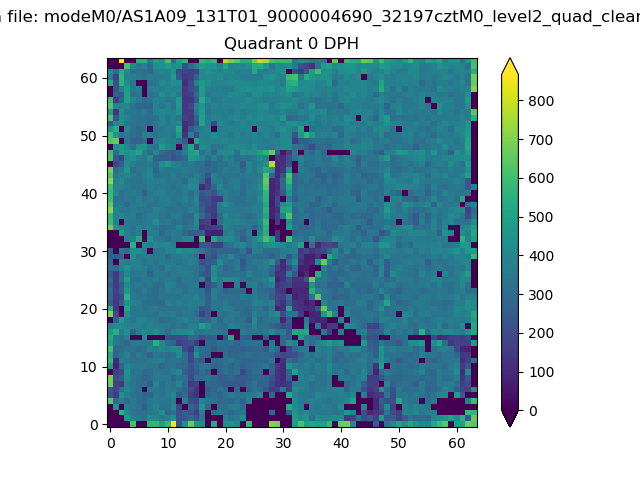 |
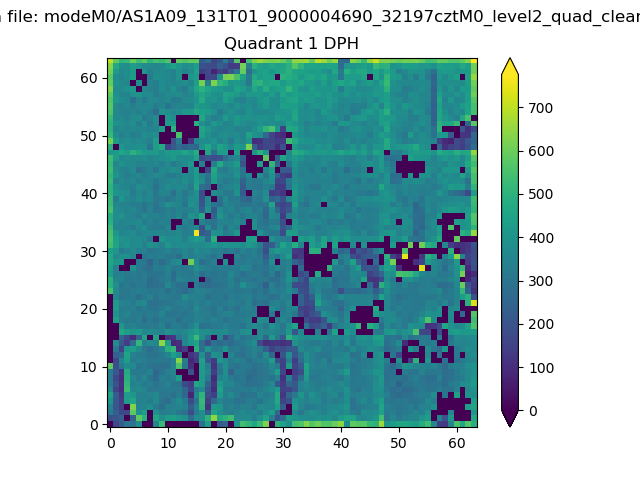 |
Quadrant B |
|---|---|---|---|
| Quadrant D | 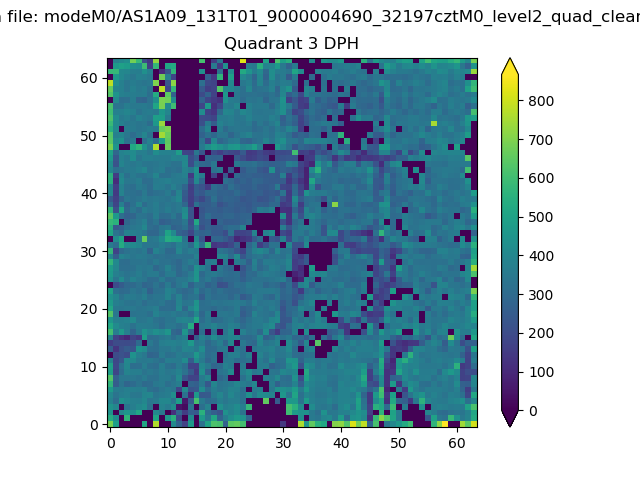 |
 |
Quadrant C |
| Plot type | Count rate plots | Images |
|---|---|---|
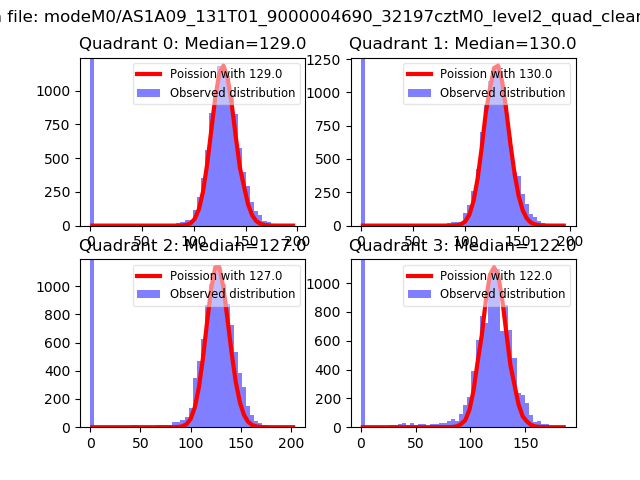
| Comparison with Poisson distribution Blue bars denote a histogram of data divided into 1 sec bins. Red curve is a Poisson curve with rate = median count rate of data. |
 |
 |
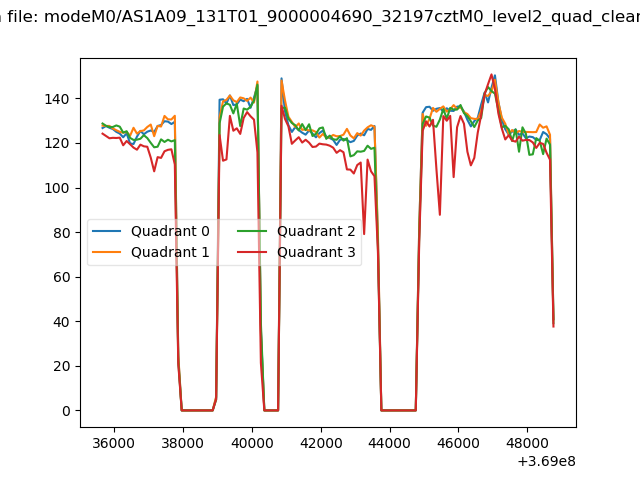
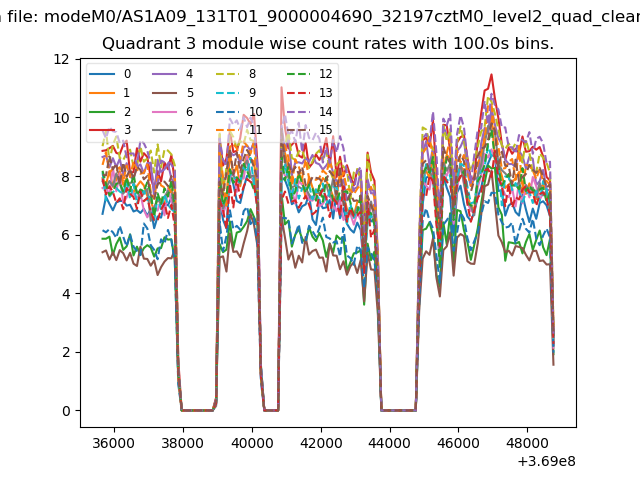
| Quadrant-wise count rates Data is divided into 100 sec bins |
 |
|
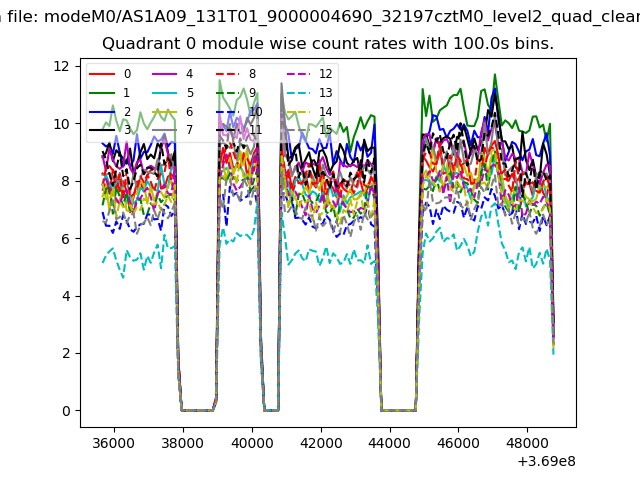
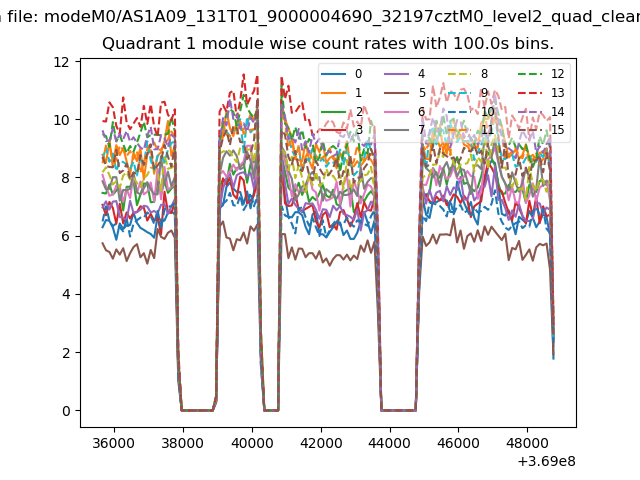
| Module-wise count rates for Quadrant A Data is divided into 100 sec bins |
 |
 |
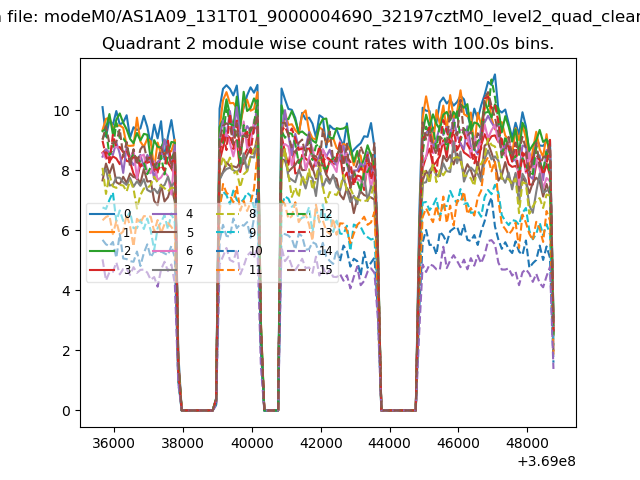
| Module-wise count rates for Quadrant B Data is divided into 100 sec bins |
 |
 |
| Module-wise count rates for Quadrant C Data is divided into 100 sec bins |
 |
 |
| Module-wise count rates for Quadrant D Data is divided into 100 sec bins |
 |
 |
| Parameter | Plot |
|---|---|
| CZT HV Monitor | 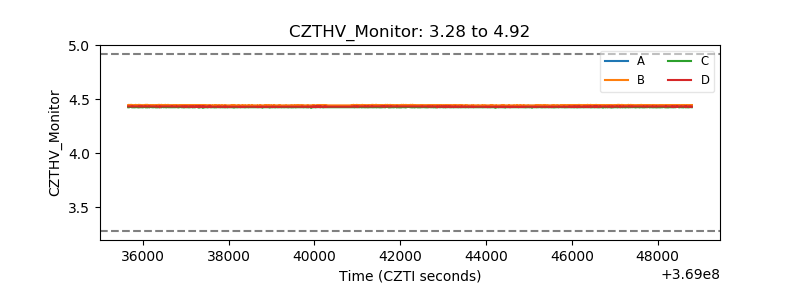 |
| D_VDD | 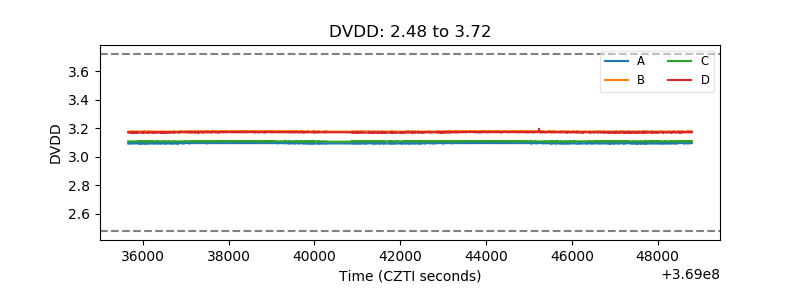 |
| Temperature 1 | 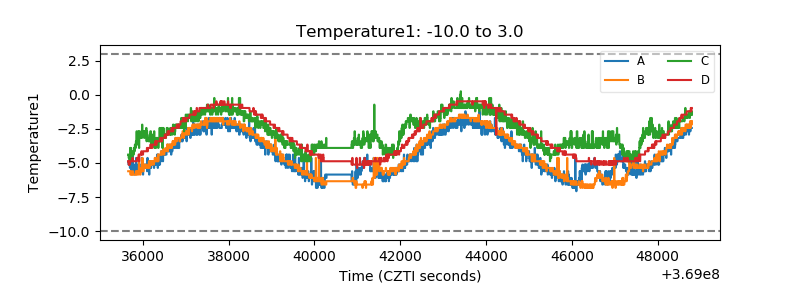 |
| Veto HV Monitor | 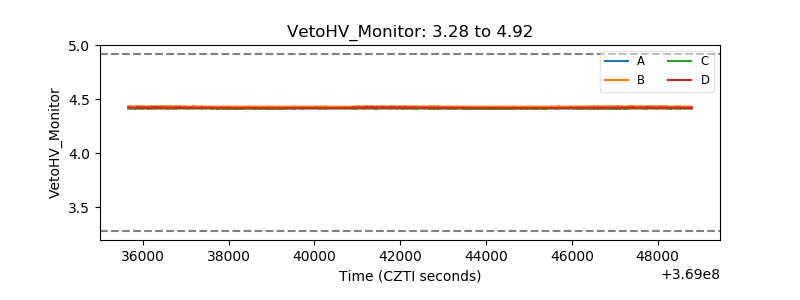 |
| Veto LLD | 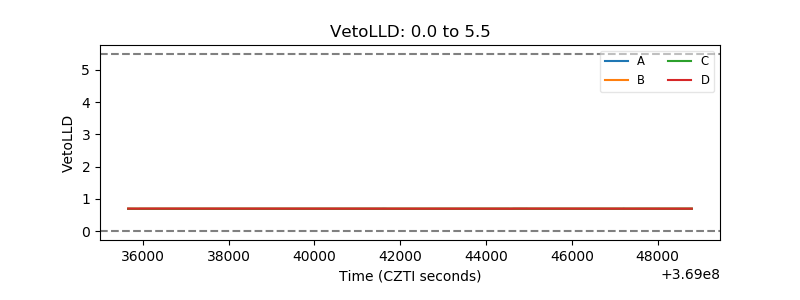 |
| Alpha Counter | 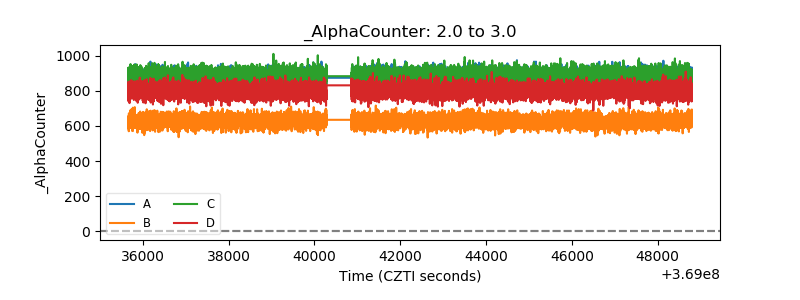 |
| _CPM_Rate | 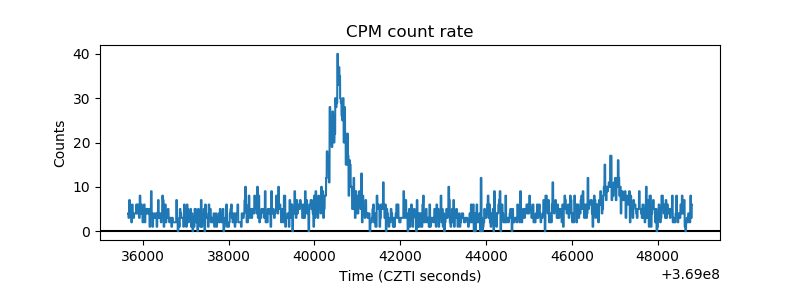 |
| CZT Counter | 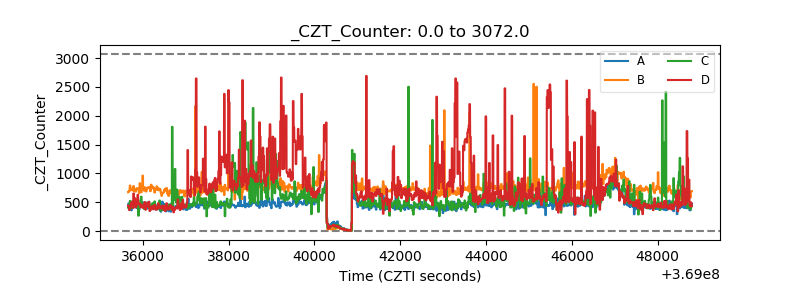 |
| +2.5 Volts monitor |  |
| +5 Volts monitor |  |
| _ROLL_ROT | 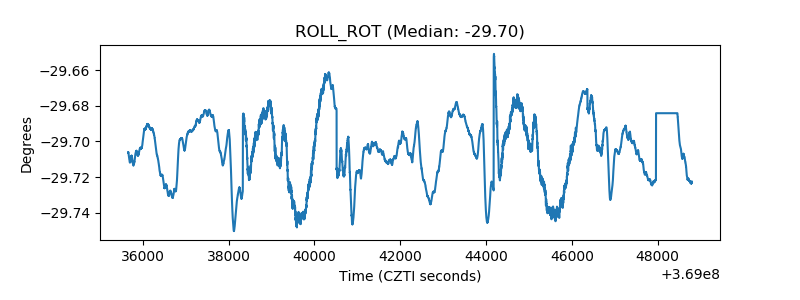 |
| _Roll_DEC | 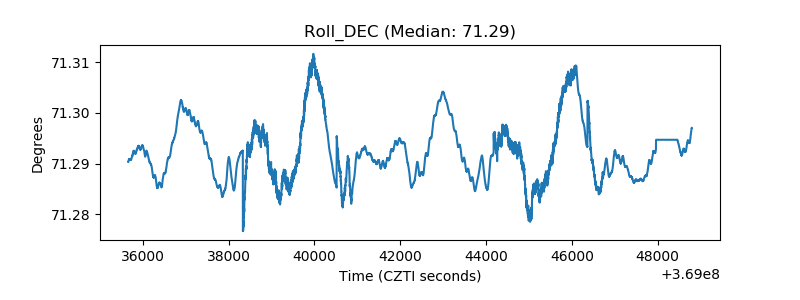 |
| _Roll_RA | 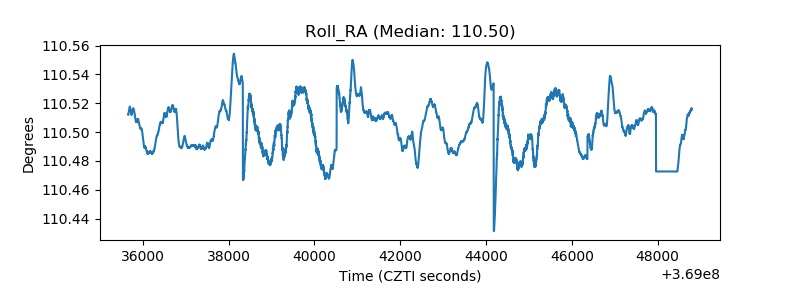 |
| Veto Counter | 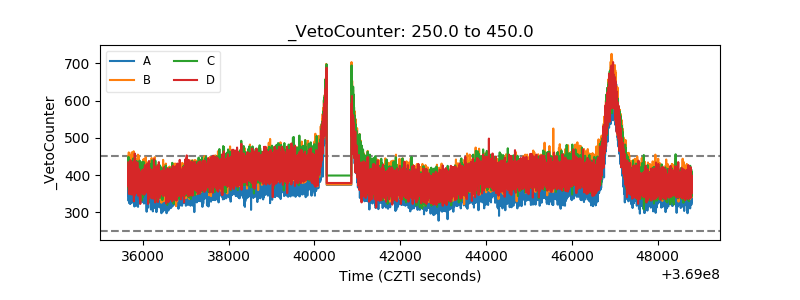 |