| Param | Original file | Final file |
|---|---|---|
| Filename | modeM0/AS1A09_131T01_9000004690_32198cztM0_level2.evt | modeM0/AS1A09_131T01_9000004690_32198cztM0_level2_quad_clean.evt |
| Size (bytes) | 606,729,600 | 119,983,680 |
| Size | 578.6 MB | 114.4 MB |
| Events in quadrant A | 3,491,953 | 801,896 |
| Events in quadrant B | 5,807,002 | 809,630 |
| Events in quadrant C | 4,293,307 | 725,814 |
| Events in quadrant D | 4,273,902 | 774,254 |
| Mode SS | |||
|---|---|---|---|
| Quadrant | BADHDUFLAG | Total packets | Discarded packets |
| A | 0 | 150 | 0 |
| B | 0 | 150 | 0 |
| C | 0 | 150 | 0 |
| D | 0 | 150 | 0 |
| Mode M0 | |||
|---|---|---|---|
| Quadrant | BADHDUFLAG | Total packets | Discarded packets |
| A | 0 | 15367 | 2 |
| B | 0 | 23135 | 1 |
| C | 0 | 17565 | 1 |
| D | 0 | 17574 | 1 |
| Quadrant | Total seconds | Saturated seconds | Saturation percentage |
|---|---|---|---|
| A | 7498 | 189 | 2.520672% |
| B | 7498 | 291 | 3.881035% |
| C | 7498 | 1060 | 14.137103% |
| D | 7498 | 190 | 2.534009% |
Noise dominated data is calculated using 1-second bins in cleaned event files. If a bin has >2000 counts, and if more than 50% of those come from <1% of pixels, then it is considered to be noise-dominated and hence unusable.
| Quadrant | # 1 sec bins | Bins with >0 counts | Bins with >2000 counts | High rate bins dominated by noise | Noise dominated (total time) | Noise dominated (detector-on time) | Marked lightcurve |
|---|---|---|---|---|---|---|---|
| A | 7573 | 7499 | 0 | 0 | 0.00% | 0.00% | 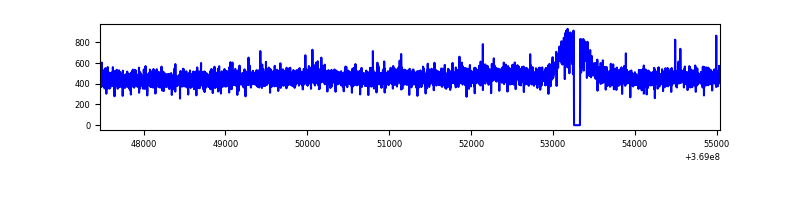 |
| B | 7573 | 7499 | 34 | 34 | 0.45% | 0.45% | 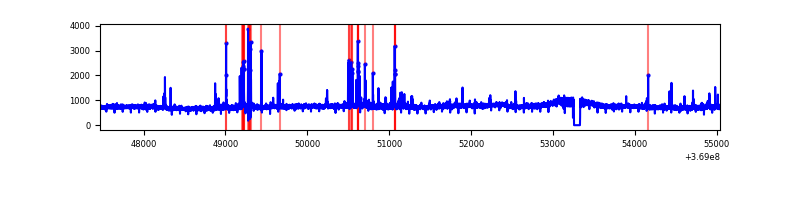 |
| C | 7573 | 7497 | 25 | 25 | 0.33% | 0.33% | 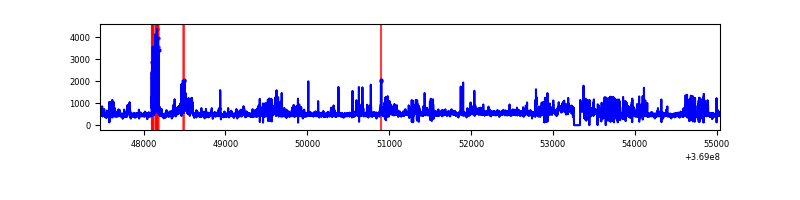 |
| D | 7573 | 7499 | 65 | 65 | 0.86% | 0.87% | 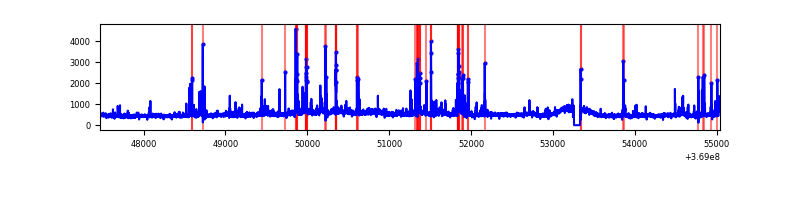 |
Top three noisy pixels from each quadrant. If the there are fewer than three noisy pixels in the level2.evt file, extra rows are filled as -1
| Pixel properties | Quadrant properties | ||||||
|---|---|---|---|---|---|---|---|
| Quadrant | DetID | PixID | Counts | Sigma | Mean | Median | Sigma |
| A | 13 | 6 | 14651 | 76.44 | 897 | 876 | 180.2 |
| A | 13 | 254 | 13981 | 72.72 | 897 | 876 | 180.2 |
| A | 3 | 137 | 9447 | 47.56 | 897 | 876 | 180.2 |
| B | 6 | 159 | 2025840 | 12064.43 | 882 | 859 | 167.8 |
| B | 5 | 172 | 163240 | 967.43 | 882 | 859 | 167.8 |
| B | 0 | 229 | 69712 | 410.21 | 882 | 859 | 167.8 |
| C | 14 | 238 | 359250 | 1937.41 | 797 | 802 | 185.0 |
| C | 14 | 254 | 323272 | 1742.95 | 797 | 802 | 185.0 |
| C | 3 | 233 | 240015 | 1292.94 | 797 | 802 | 185.0 |
| D | 8 | 195 | 463217 | 2251.61 | 865 | 837 | 205.4 |
| D | 2 | 250 | 201452 | 976.92 | 865 | 837 | 205.4 |
| D | 12 | 233 | 128499 | 621.66 | 865 | 837 | 205.4 |
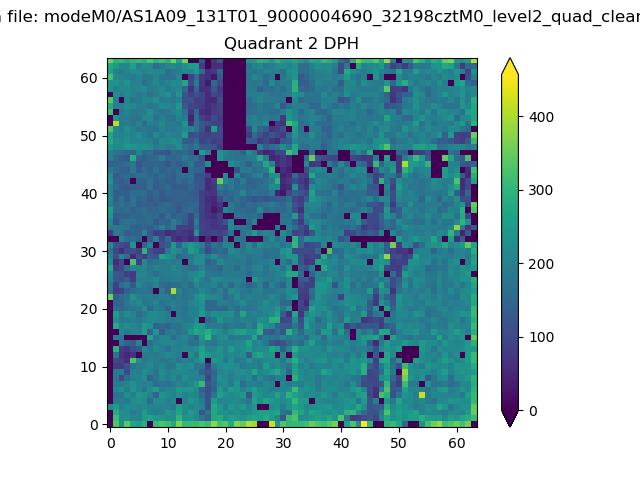
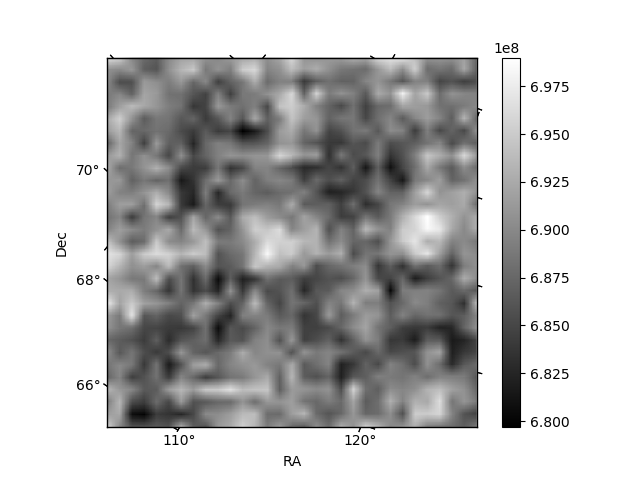
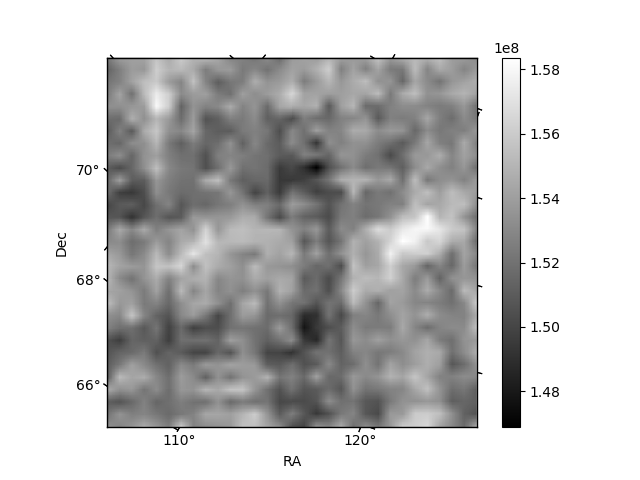
Histogram calculated using DETX and DETY for each event in the final _common_clean file
| Quadrant A | 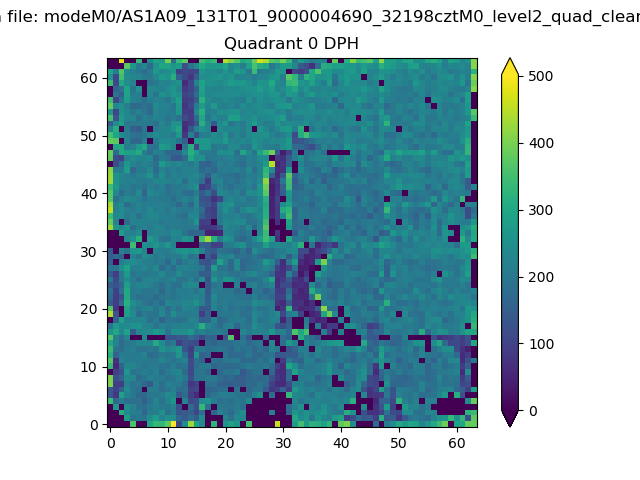 |
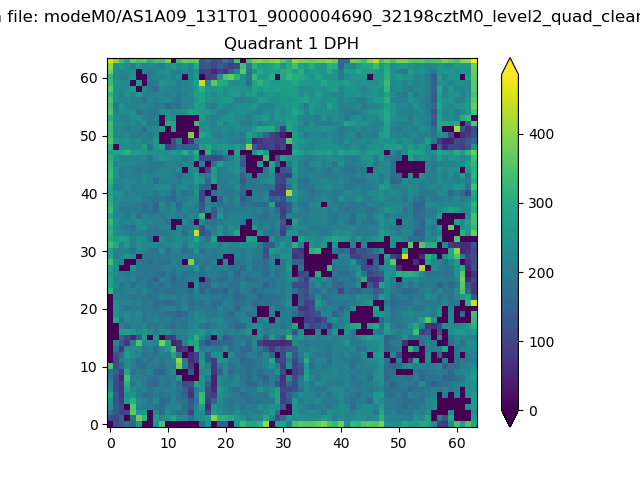 |
Quadrant B |
|---|---|---|---|
| Quadrant D | 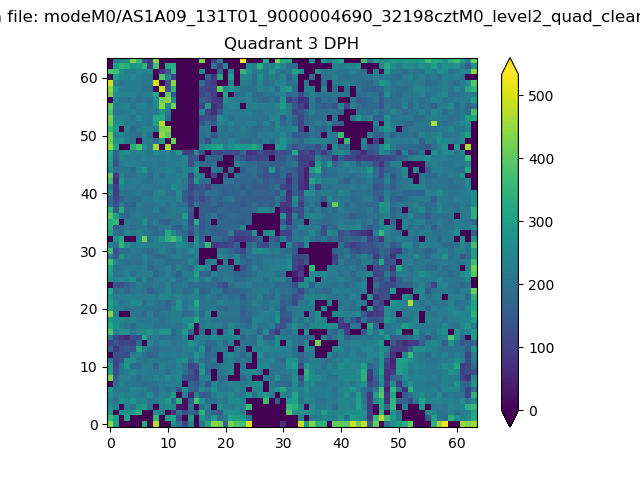 |
 |
Quadrant C |
| Plot type | Count rate plots | Images |
|---|---|---|
| Comparison with Poisson distribution Blue bars denote a histogram of data divided into 1 sec bins. Red curve is a Poisson curve with rate = median count rate of data. |
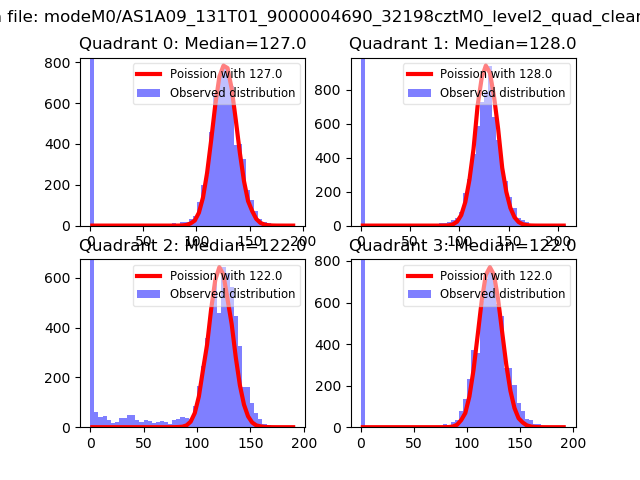 |
 |
| Quadrant-wise count rates Data is divided into 100 sec bins |
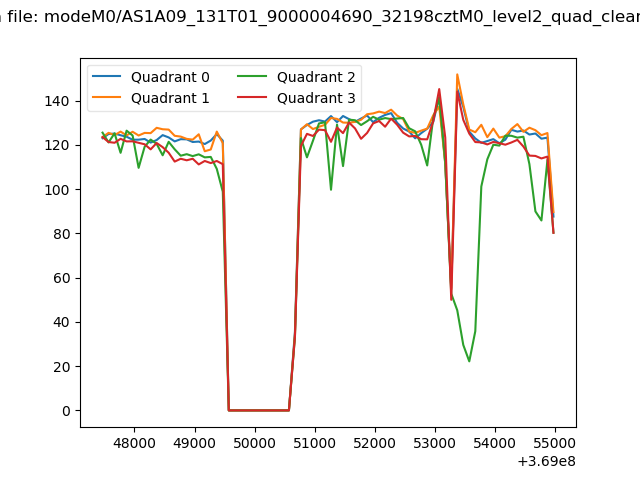 |
|
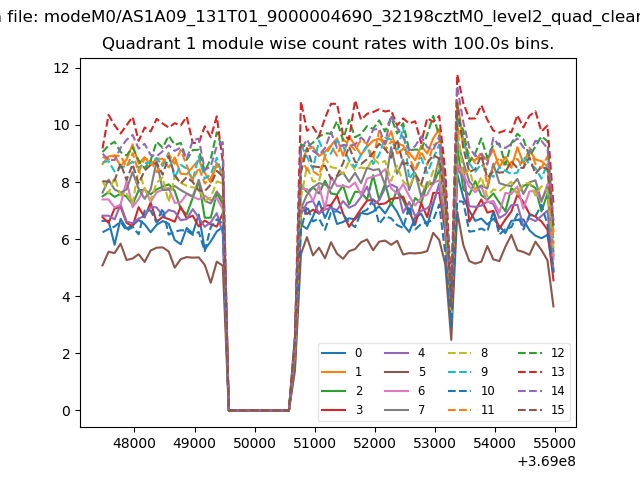
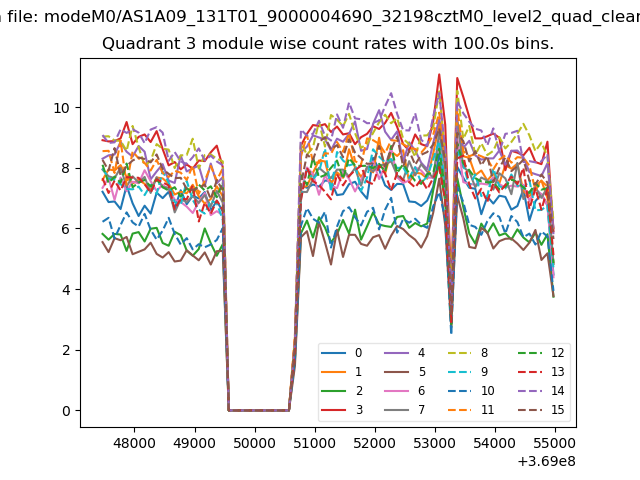
| Module-wise count rates for Quadrant A Data is divided into 100 sec bins |
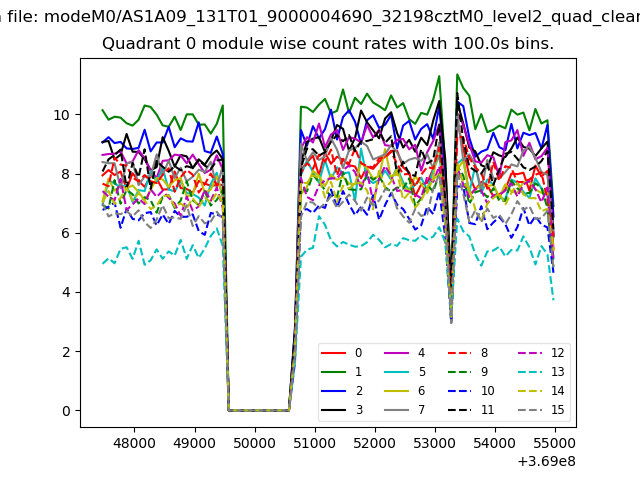 |
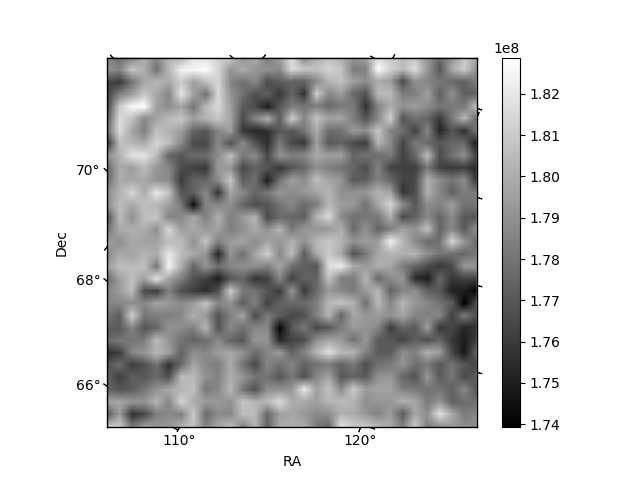 |
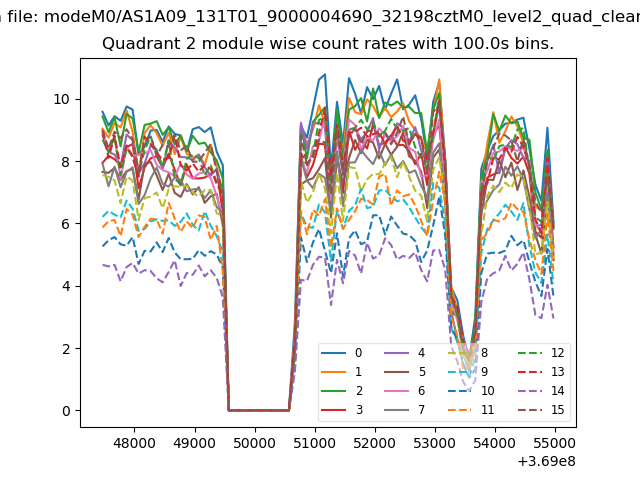
| Module-wise count rates for Quadrant B Data is divided into 100 sec bins |
 |
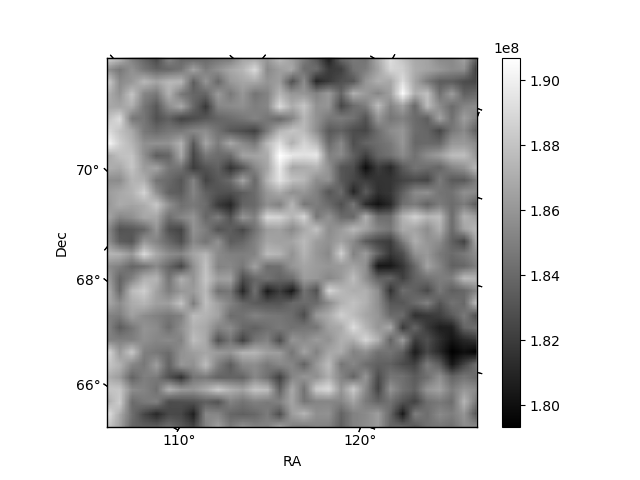 |
| Module-wise count rates for Quadrant C Data is divided into 100 sec bins |
 |
 |
| Module-wise count rates for Quadrant D Data is divided into 100 sec bins |
 |
 |
| Parameter | Plot |
|---|---|
| CZT HV Monitor | 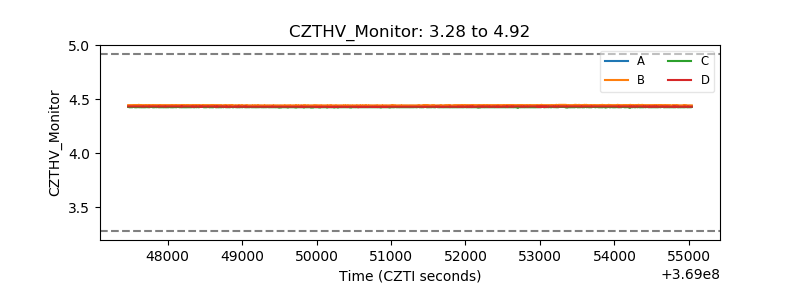 |
| D_VDD | 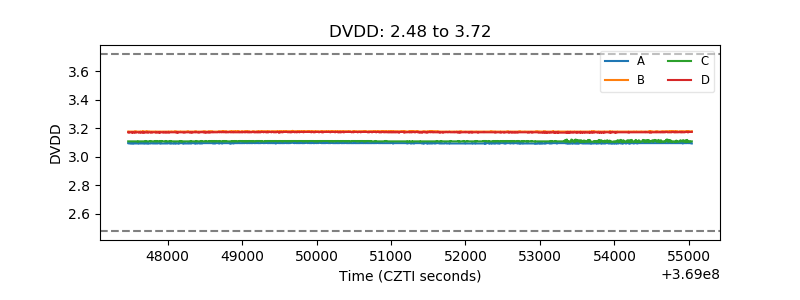 |
| Temperature 1 | 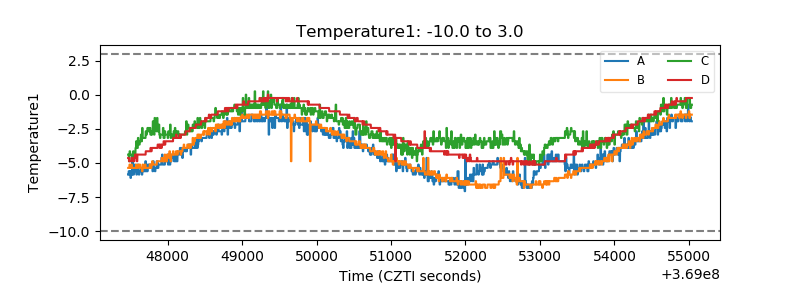 |
| Veto HV Monitor | 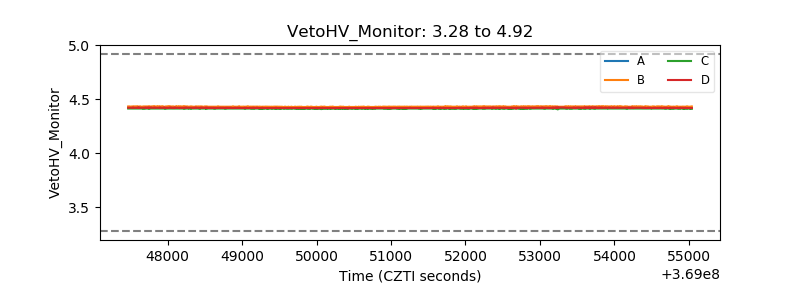 |
| Veto LLD | 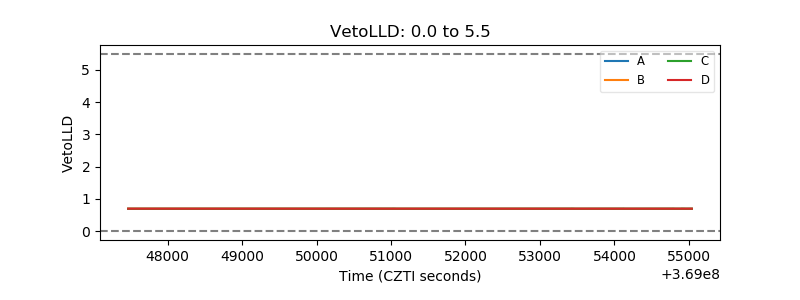 |
| Alpha Counter | 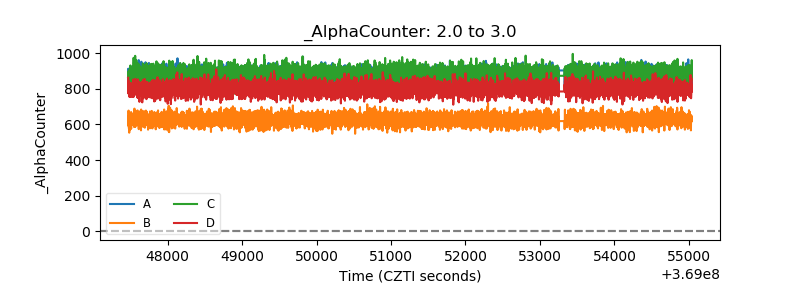 |
| _CPM_Rate | 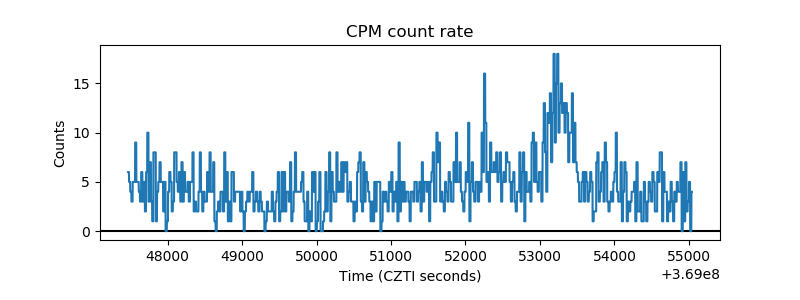 |
| CZT Counter | 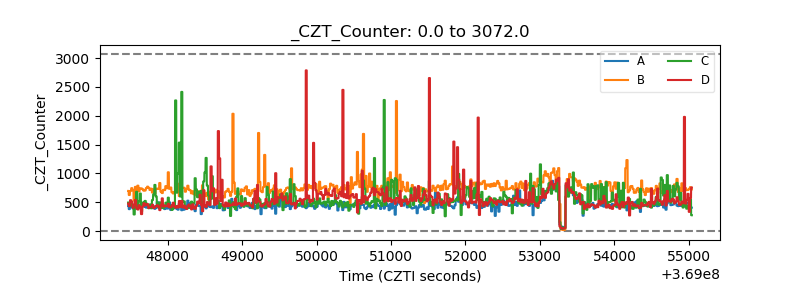 |
| +2.5 Volts monitor |  |
| +5 Volts monitor |  |
| _ROLL_ROT | 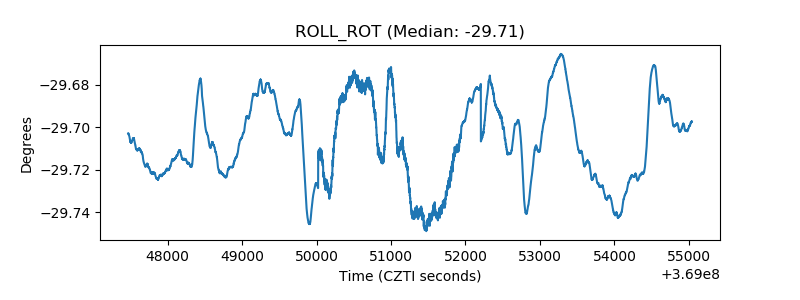 |
| _Roll_DEC | 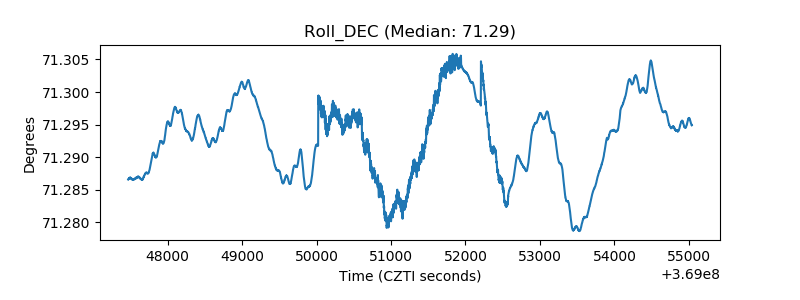 |
| _Roll_RA | 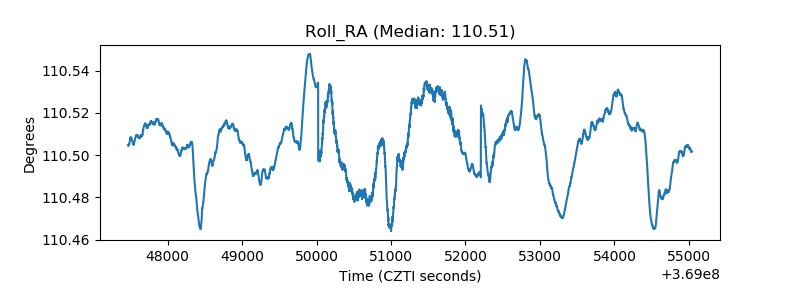 |
| Veto Counter | 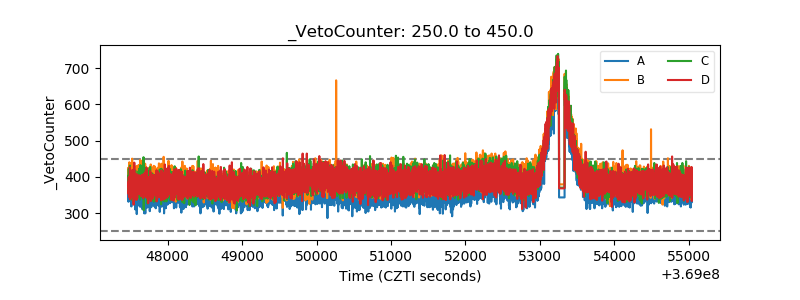 |