| Param | Original file | Final file |
|---|---|---|
| Filename | modeM0/AS1A09_131T01_9000004690_32201cztM0_level2.evt | modeM0/AS1A09_131T01_9000004690_32201cztM0_level2_quad_clean.evt |
| Size (bytes) | 1,283,797,440 | 203,722,560 |
| Size | 1.2 GB | 194.3 MB |
| Events in quadrant A | 6,770,644 | 1,350,752 |
| Events in quadrant B | 11,360,704 | 1,349,322 |
| Events in quadrant C | 7,979,520 | 1,256,058 |
| Events in quadrant D | 11,813,023 | 1,235,505 |
| Mode SS | |||
|---|---|---|---|
| Quadrant | BADHDUFLAG | Total packets | Discarded packets |
| A | 0 | 286 | 0 |
| B | 0 | 286 | 0 |
| C | 0 | 286 | 0 |
| D | 0 | 286 | 0 |
| Mode M0 | |||
|---|---|---|---|
| Quadrant | BADHDUFLAG | Total packets | Discarded packets |
| A | 0 | 29373 | 1 |
| B | 0 | 44380 | 1 |
| C | 0 | 32622 | 1 |
| D | 0 | 44174 | 1 |
| Mode M9 | |||
|---|---|---|---|
| Quadrant | BADHDUFLAG | Total packets | Discarded packets |
| A | 0 | 10 | 0 |
| B | 0 | 10 | 0 |
| C | 0 | 10 | 0 |
| D | 0 | 10 | 0 |
| Quadrant | Total seconds | Saturated seconds | Saturation percentage |
|---|---|---|---|
| A | 14162 | 219 | 1.546392% |
| B | 14162 | 459 | 3.241068% |
| C | 14162 | 2084 | 14.715436% |
| D | 14162 | 1818 | 12.837170% |
Noise dominated data is calculated using 1-second bins in cleaned event files. If a bin has >2000 counts, and if more than 50% of those come from <1% of pixels, then it is considered to be noise-dominated and hence unusable.
| Quadrant | # 1 sec bins | Bins with >0 counts | Bins with >2000 counts | High rate bins dominated by noise | Noise dominated (total time) | Noise dominated (detector-on time) | Marked lightcurve |
|---|---|---|---|---|---|---|---|
| A | 15107 | 14164 | 40 | 40 | 0.26% | 0.28% | 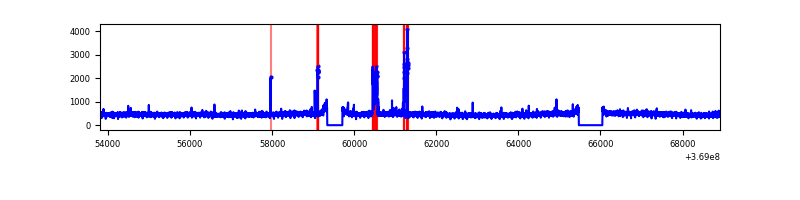 |
| B | 15107 | 14164 | 125 | 125 | 0.83% | 0.88% | 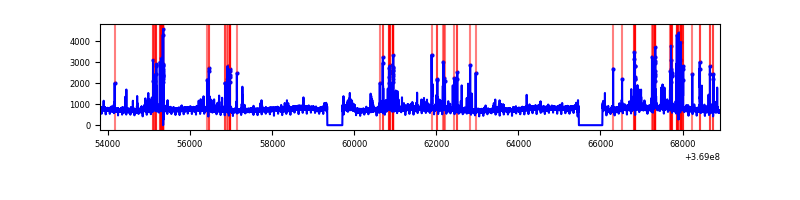 |
| C | 15107 | 14164 | 26 | 26 | 0.17% | 0.18% | 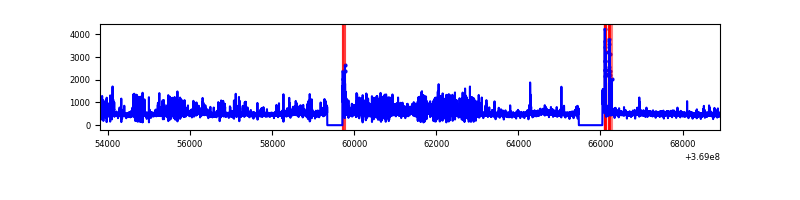 |
| D | 15107 | 14164 | 1162 | 1162 | 7.69% | 8.20% | 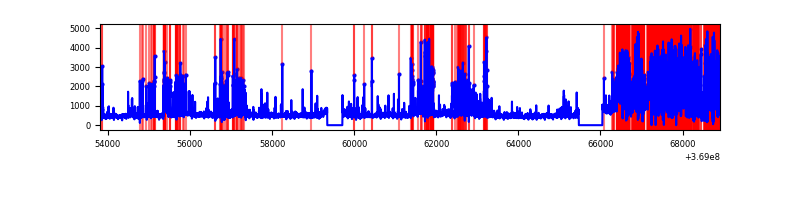 |
Top three noisy pixels from each quadrant. If the there are fewer than three noisy pixels in the level2.evt file, extra rows are filled as -1
| Pixel properties | Quadrant properties | ||||||
|---|---|---|---|---|---|---|---|
| Quadrant | DetID | PixID | Counts | Sigma | Mean | Median | Sigma |
| A | 15 | 174 | 189793 | 560.94 | 1681 | 1647 | 335.4 |
| A | 9 | 143 | 56815 | 164.48 | 1681 | 1647 | 335.4 |
| A | 13 | 254 | 29095 | 81.83 | 1681 | 1647 | 335.4 |
| B | 6 | 159 | 3880297 | 12455.56 | 1654 | 1610 | 311.4 |
| B | 5 | 172 | 548217 | 1755.31 | 1654 | 1610 | 311.4 |
| B | 0 | 190 | 141956 | 450.69 | 1654 | 1610 | 311.4 |
| C | 14 | 238 | 773140 | 2187.89 | 1519 | 1529 | 352.7 |
| C | 14 | 254 | 720820 | 2039.54 | 1519 | 1529 | 352.7 |
| C | 0 | 10 | 288126 | 812.64 | 1519 | 1529 | 352.7 |
| D | 12 | 218 | 3130798 | 8613.45 | 1534 | 1490 | 363.3 |
| D | 8 | 195 | 1444471 | 3971.82 | 1534 | 1490 | 363.3 |
| D | 13 | 249 | 452216 | 1240.63 | 1534 | 1490 | 363.3 |
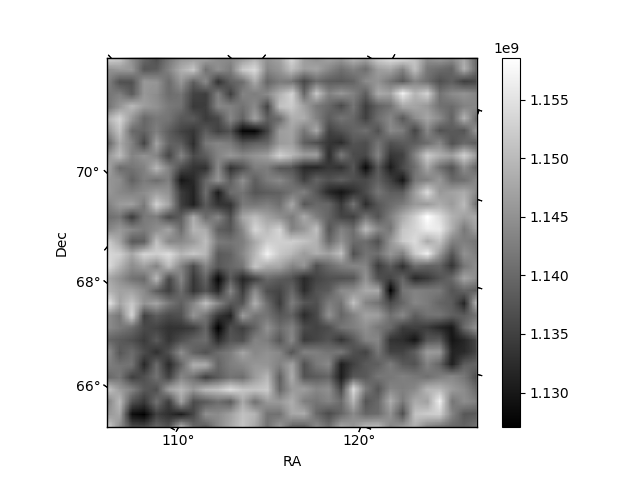
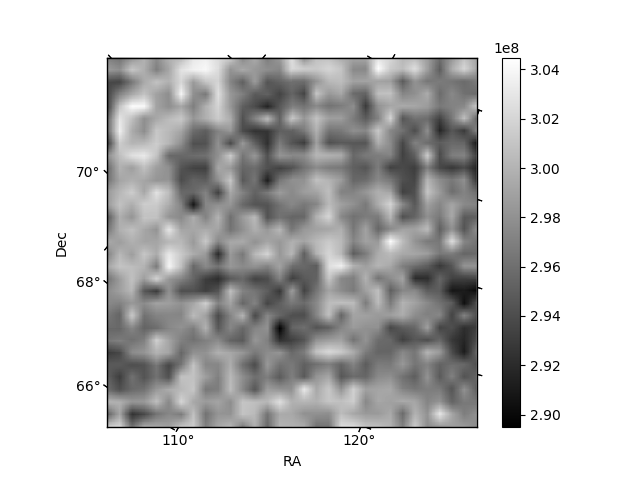
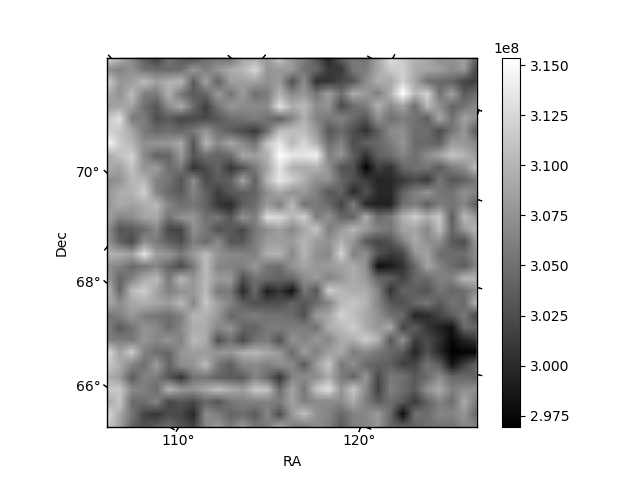
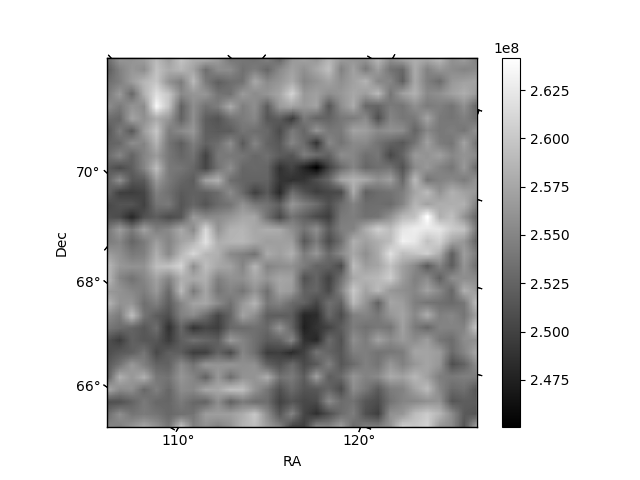
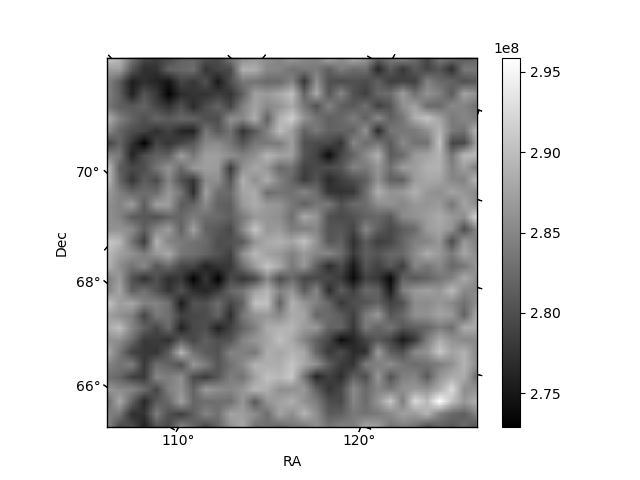
Histogram calculated using DETX and DETY for each event in the final _common_clean file
| Quadrant A | 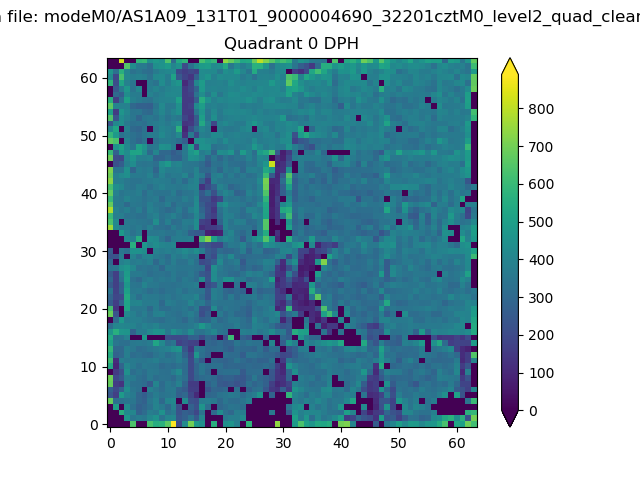 |
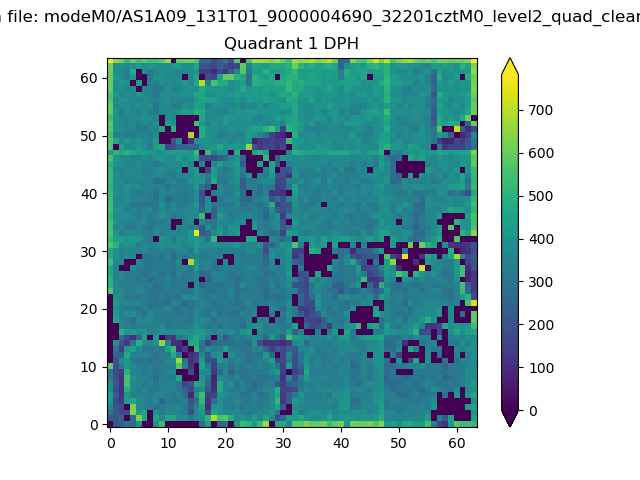 |
Quadrant B |
|---|---|---|---|
| Quadrant D | 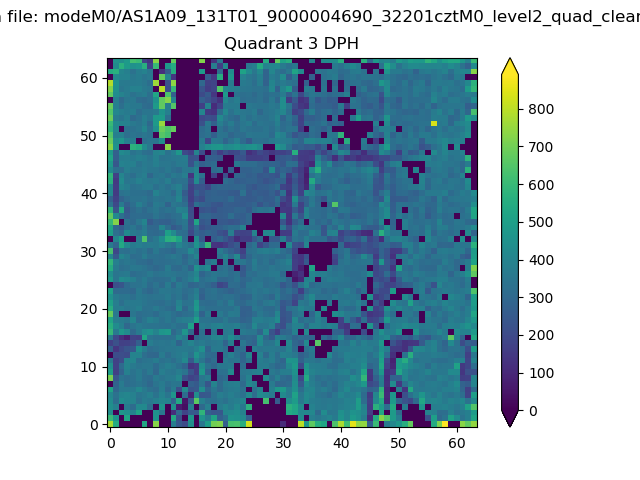 |
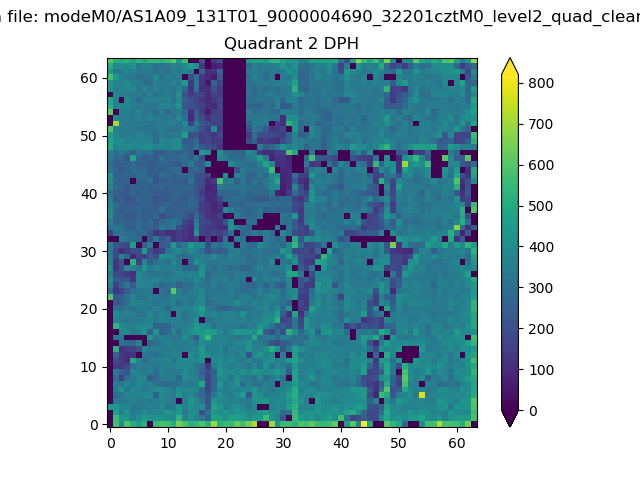 |
Quadrant C |
| Plot type | Count rate plots | Images |
|---|---|---|
| Comparison with Poisson distribution Blue bars denote a histogram of data divided into 1 sec bins. Red curve is a Poisson curve with rate = median count rate of data. |
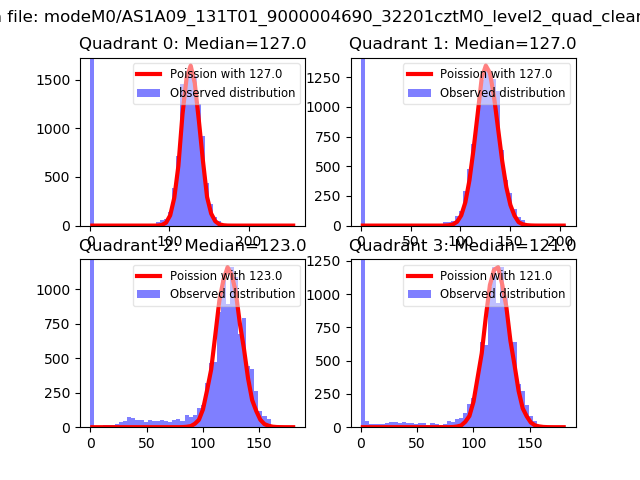 |
 |
| Quadrant-wise count rates Data is divided into 100 sec bins |
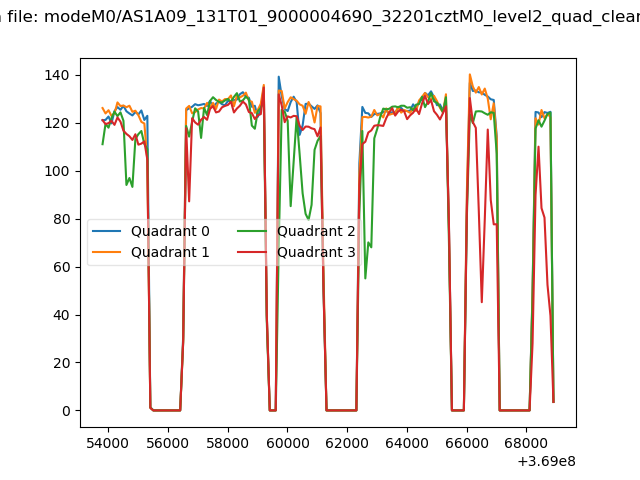 |
|
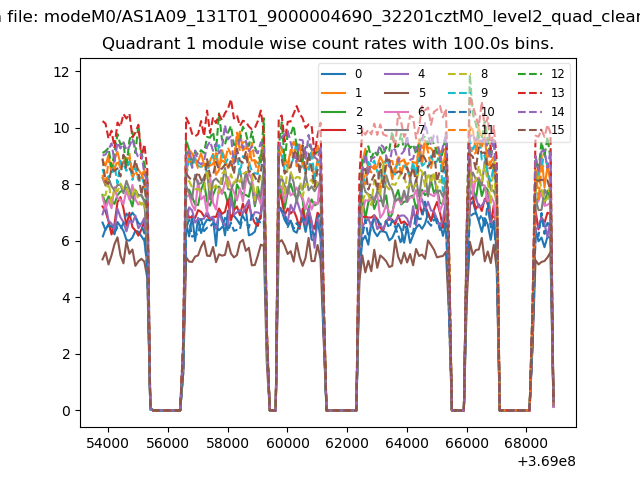
| Module-wise count rates for Quadrant A Data is divided into 100 sec bins |
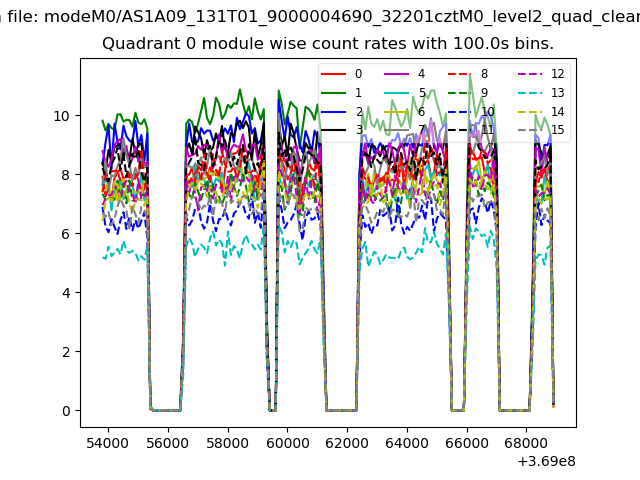 |
 |
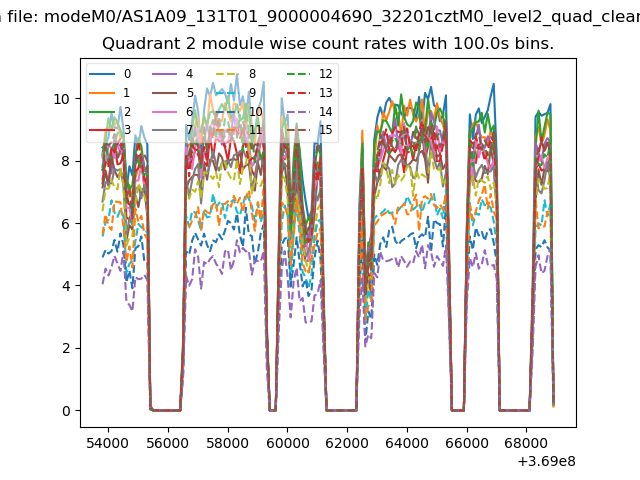
| Module-wise count rates for Quadrant B Data is divided into 100 sec bins |
 |
 |
| Module-wise count rates for Quadrant C Data is divided into 100 sec bins |
 |
 |
| Module-wise count rates for Quadrant D Data is divided into 100 sec bins |
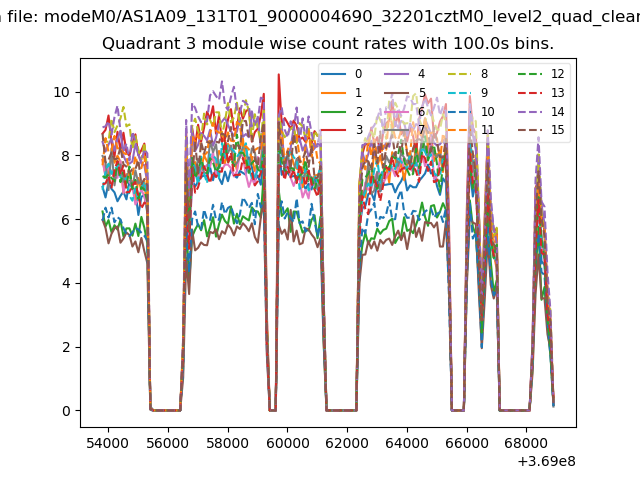 |
 |
| Parameter | Plot |
|---|---|
| CZT HV Monitor | 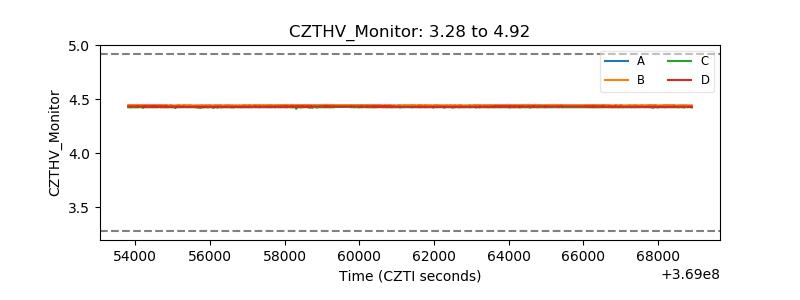 |
| D_VDD | 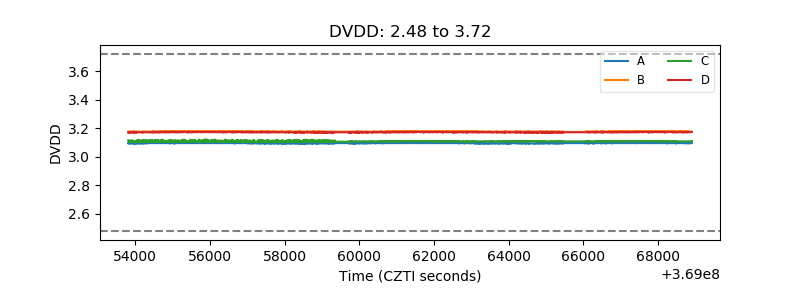 |
| Temperature 1 | 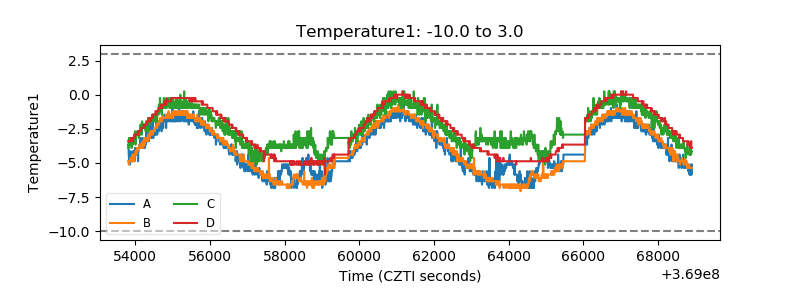 |
| Veto HV Monitor | 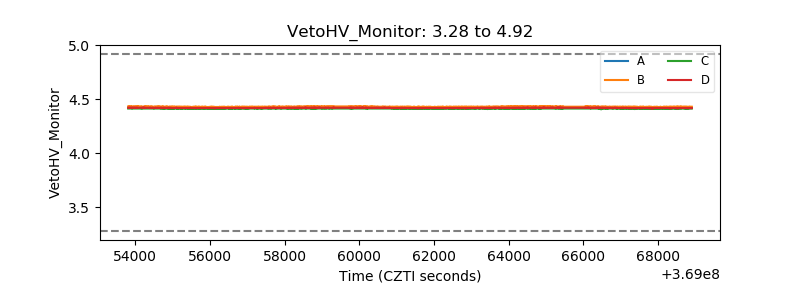 |
| Veto LLD |  |
| Alpha Counter | 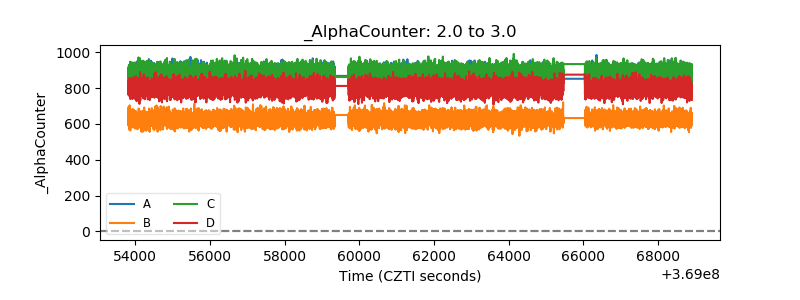 |
| _CPM_Rate | 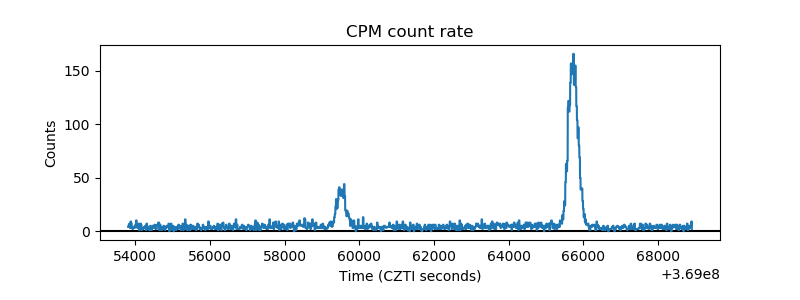 |
| CZT Counter | 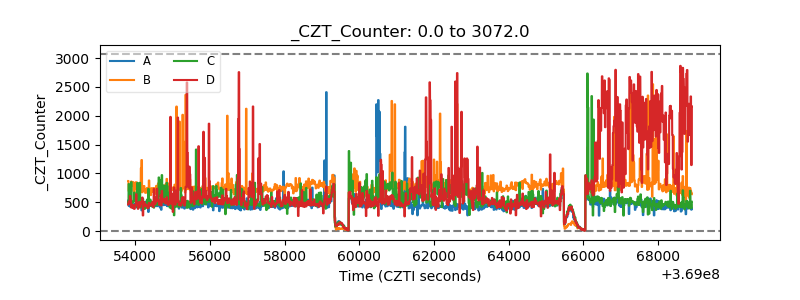 |
| +2.5 Volts monitor |  |
| +5 Volts monitor |  |
| _ROLL_ROT | 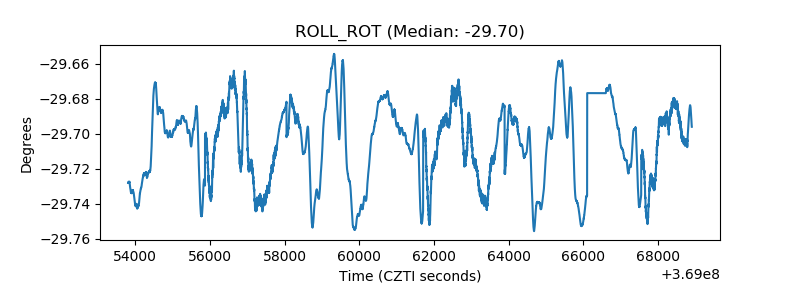 |
| _Roll_DEC | 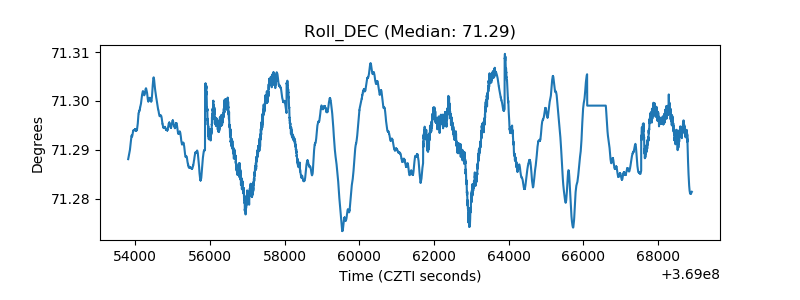 |
| _Roll_RA | 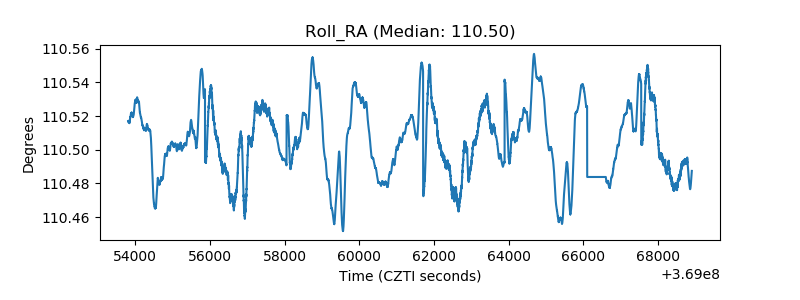 |
| Veto Counter | 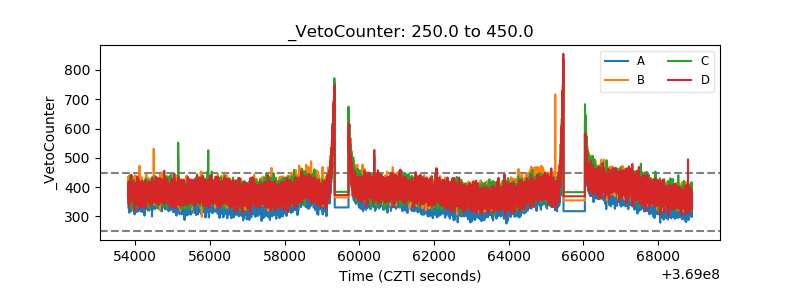 |