| Param | Original file | Final file |
|---|---|---|
| Filename | modeM0/AS1A10_057T01_9000004692_32201cztM0_level2.evt | modeM0/AS1A10_057T01_9000004692_32201cztM0_level2_quad_clean.evt |
| Size (bytes) | 417,061,440 | 42,929,280 |
| Size | 397.7 MB | 40.9 MB |
| Events in quadrant A | 1,846,451 | 276,315 |
| Events in quadrant B | 3,420,677 | 275,446 |
| Events in quadrant C | 2,340,534 | 268,904 |
| Events in quadrant D | 4,767,486 | 212,854 |
| Mode M0 | |||
|---|---|---|---|
| Quadrant | BADHDUFLAG | Total packets | Discarded packets |
| A | 0 | 7788 | 2 |
| B | 0 | 12725 | 1 |
| C | 0 | 9387 | 1 |
| D | 0 | 16752 | 1 |
| Mode SS | |||
|---|---|---|---|
| Quadrant | BADHDUFLAG | Total packets | Discarded packets |
| A | 0 | 78 | 0 |
| B | 0 | 78 | 0 |
| C | 0 | 78 | 0 |
| D | 0 | 78 | 0 |
| Mode M9 | |||
|---|---|---|---|
| Quadrant | BADHDUFLAG | Total packets | Discarded packets |
| A | 0 | 8 | 0 |
| B | 0 | 8 | 0 |
| C | 0 | 8 | 0 |
| D | 0 | 8 | 0 |
| Quadrant | Total seconds | Saturated seconds | Saturation percentage |
|---|---|---|---|
| A | 3753 | 49 | 1.305622% |
| B | 3753 | 358 | 9.539035% |
| C | 3753 | 200 | 5.329070% |
| D | 3753 | 1217 | 32.427391% |
Noise dominated data is calculated using 1-second bins in cleaned event files. If a bin has >2000 counts, and if more than 50% of those come from <1% of pixels, then it is considered to be noise-dominated and hence unusable.
| Quadrant | # 1 sec bins | Bins with >0 counts | Bins with >2000 counts | High rate bins dominated by noise | Noise dominated (total time) | Noise dominated (detector-on time) | Marked lightcurve |
|---|---|---|---|---|---|---|---|
| A | 4543 | 3754 | 0 | 0 | 0.00% | 0.00% | 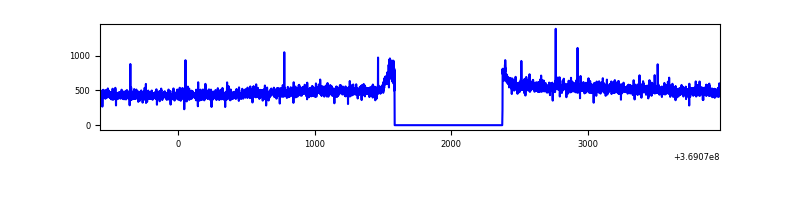 |
| B | 4543 | 3754 | 140 | 140 | 3.08% | 3.73% | 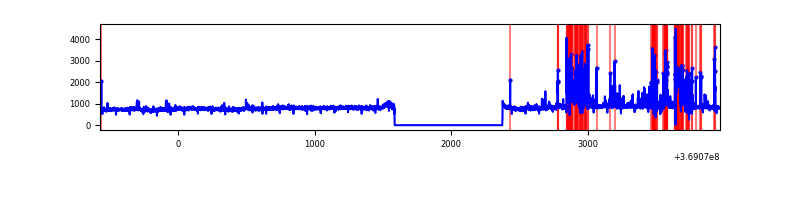 |
| C | 4543 | 3754 | 21 | 21 | 0.46% | 0.56% | 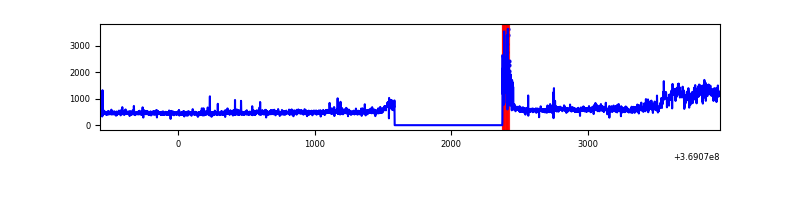 |
| D | 4543 | 3753 | 868 | 868 | 19.11% | 23.13% | 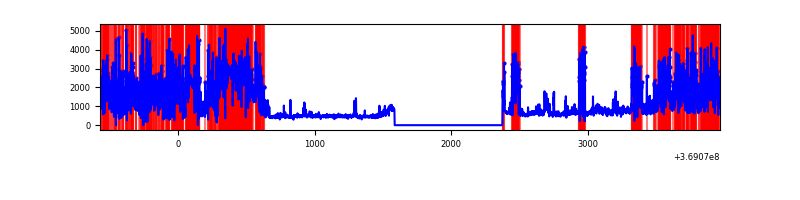 |
Top three noisy pixels from each quadrant. If the there are fewer than three noisy pixels in the level2.evt file, extra rows are filled as -1
| Pixel properties | Quadrant properties | ||||||
|---|---|---|---|---|---|---|---|
| Quadrant | DetID | PixID | Counts | Sigma | Mean | Median | Sigma |
| A | 13 | 254 | 8123 | 79.77 | 474 | 464 | 96.0 |
| A | 15 | 174 | 6218 | 59.93 | 474 | 464 | 96.0 |
| A | 13 | 6 | 5188 | 49.2 | 474 | 464 | 96.0 |
| B | 6 | 159 | 1024195 | 11669.16 | 447 | 435 | 87.7 |
| B | 5 | 172 | 518960 | 5910.32 | 447 | 435 | 87.7 |
| B | 0 | 229 | 33538 | 377.32 | 447 | 435 | 87.7 |
| C | 3 | 233 | 379147 | 3559.59 | 447 | 450 | 106.4 |
| C | 0 | 10 | 107574 | 1006.92 | 447 | 450 | 106.4 |
| C | 14 | 238 | 76552 | 715.33 | 447 | 450 | 106.4 |
| D | 12 | 218 | 2281862 | 24571.14 | 386 | 375 | 92.9 |
| D | 12 | 233 | 320679 | 3449.61 | 386 | 375 | 92.9 |
| D | 14 | 52 | 219796 | 2363.12 | 386 | 375 | 92.9 |
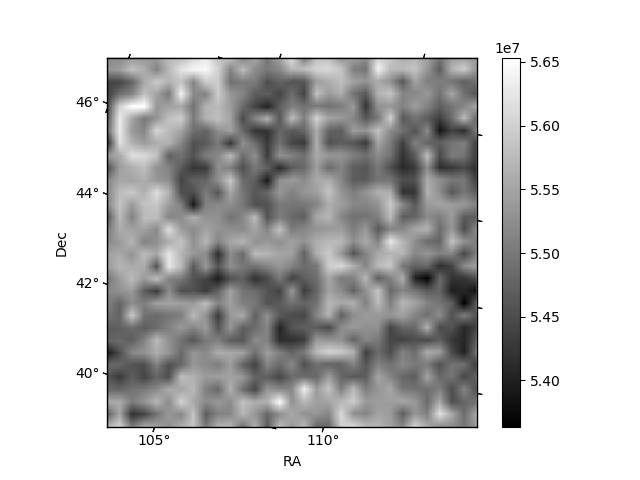
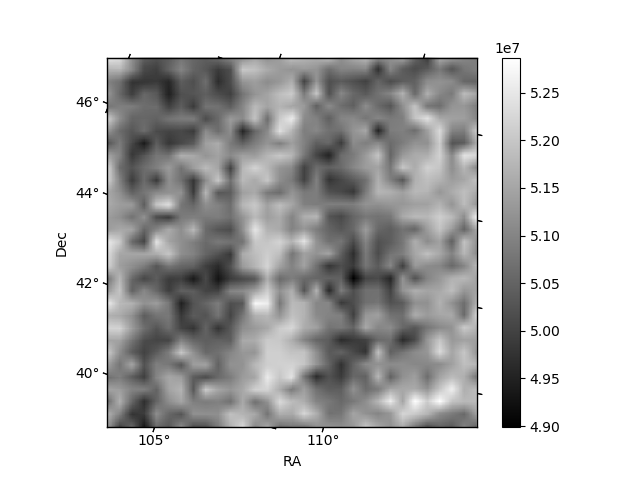
Histogram calculated using DETX and DETY for each event in the final _common_clean file
| Quadrant A | 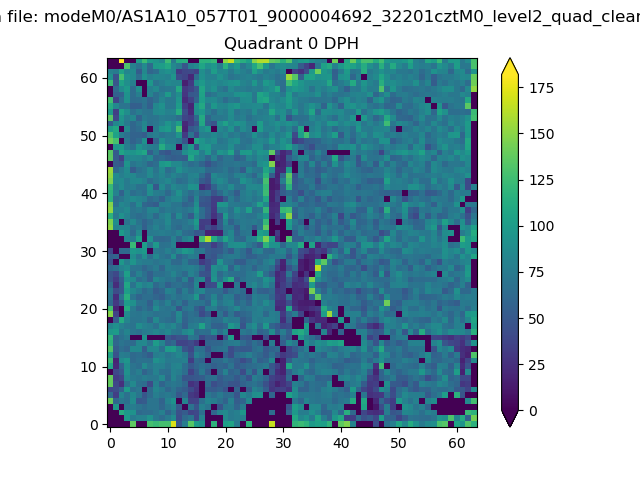 |
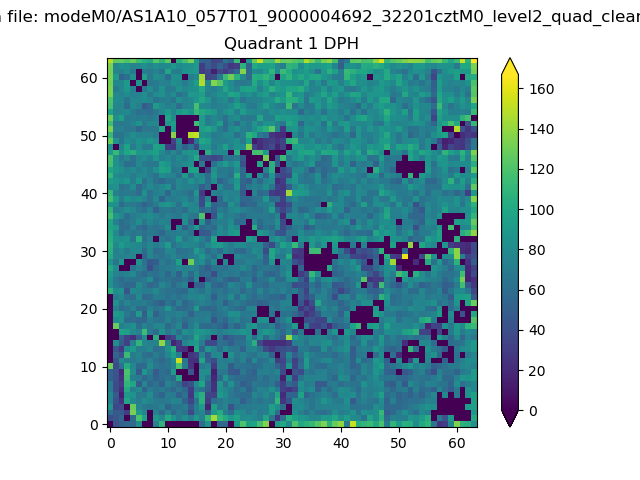 |
Quadrant B |
|---|---|---|---|
| Quadrant D | 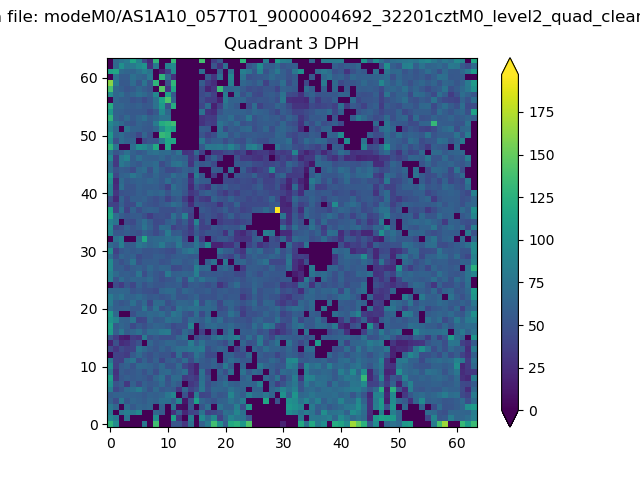 |
 |
Quadrant C |
| Plot type | Count rate plots | Images |
|---|---|---|
| Comparison with Poisson distribution Blue bars denote a histogram of data divided into 1 sec bins. Red curve is a Poisson curve with rate = median count rate of data. |
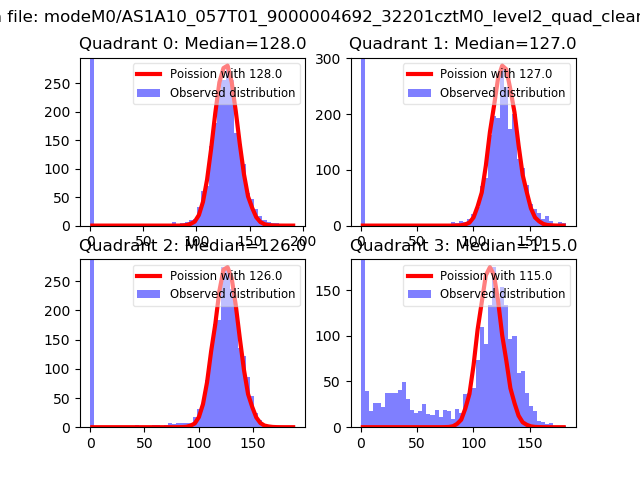 |
 |
| Quadrant-wise count rates Data is divided into 100 sec bins |
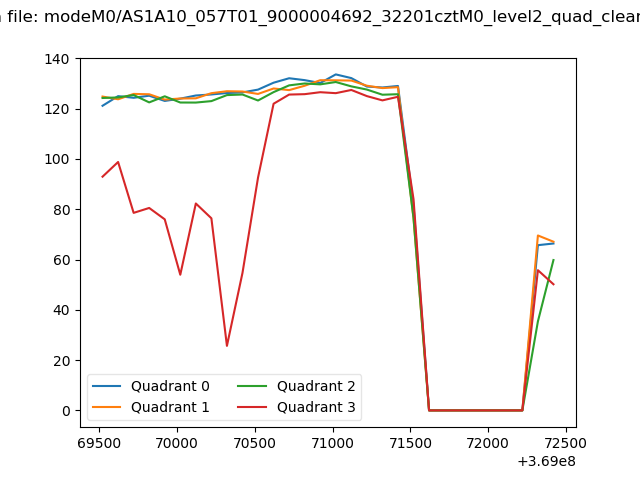 |
|
| Module-wise count rates for Quadrant A Data is divided into 100 sec bins |
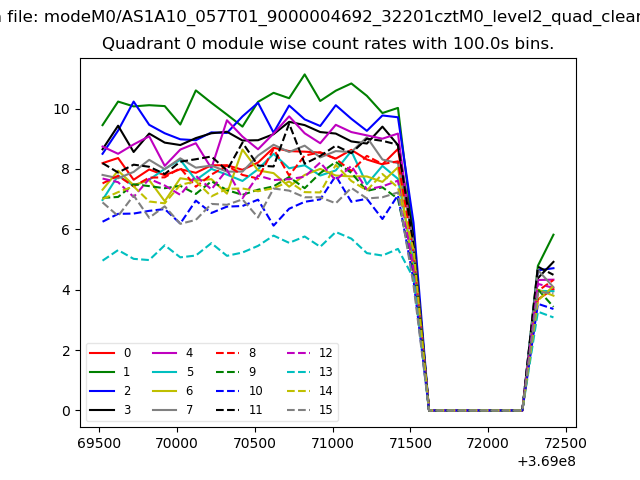 |
 |
| Module-wise count rates for Quadrant B Data is divided into 100 sec bins |
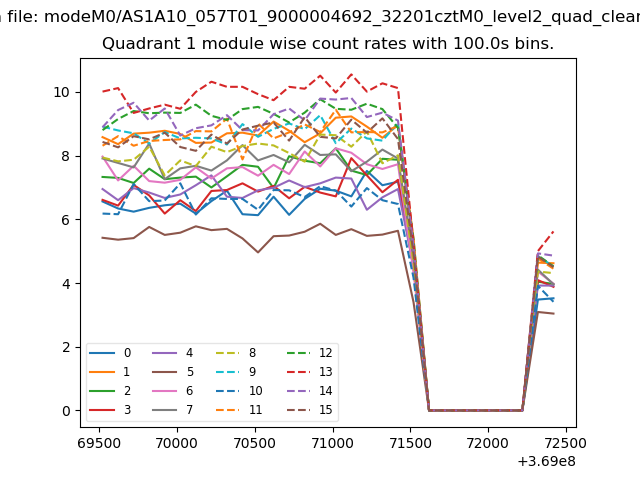 |
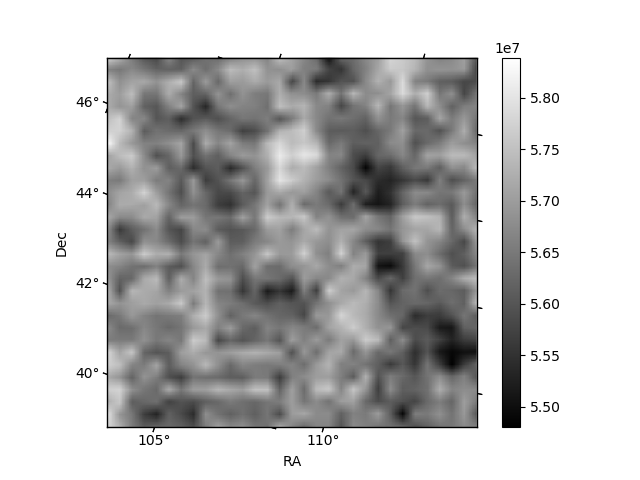 |
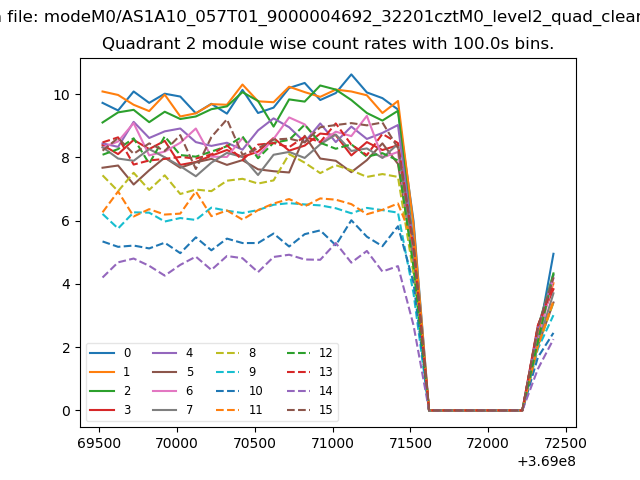
| Module-wise count rates for Quadrant C Data is divided into 100 sec bins |
 |
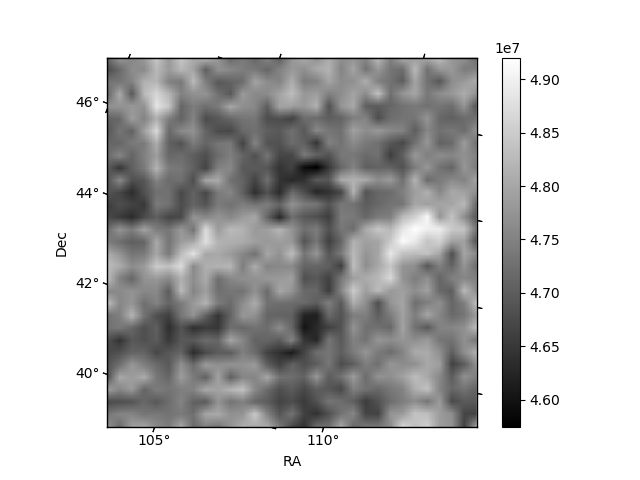 |
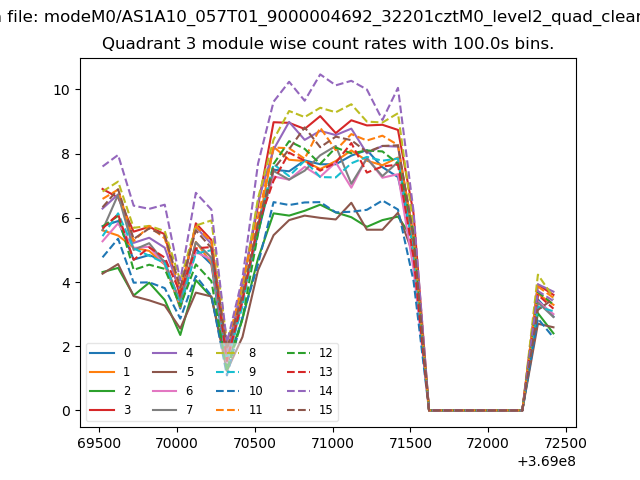
| Module-wise count rates for Quadrant D Data is divided into 100 sec bins |
 |
 |
| Parameter | Plot |
|---|---|
| CZT HV Monitor | 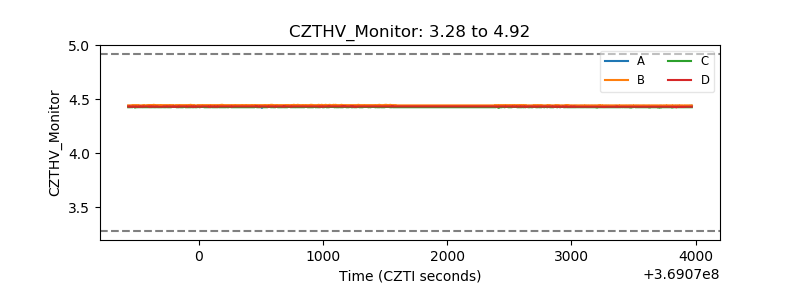 |
| D_VDD | 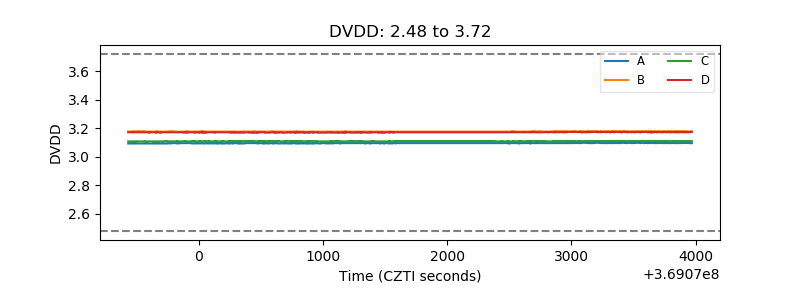 |
| Temperature 1 | 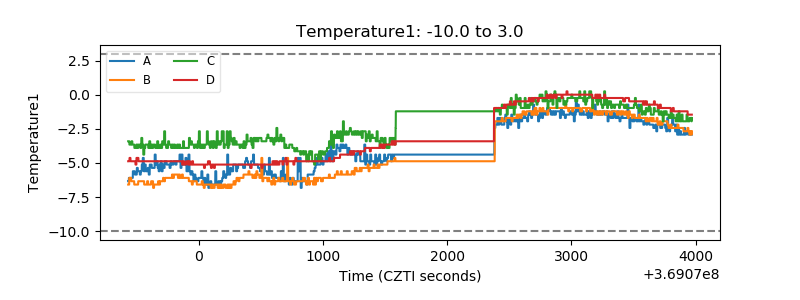 |
| Veto HV Monitor | 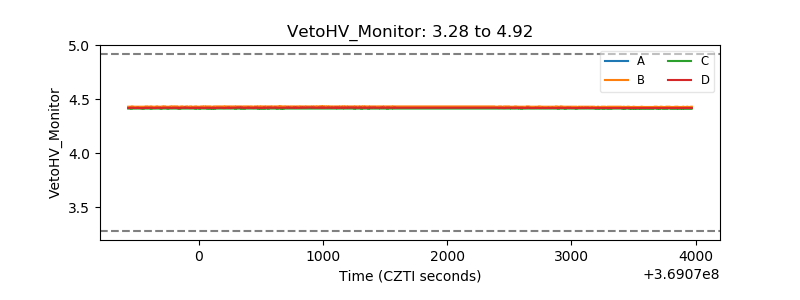 |
| Veto LLD | 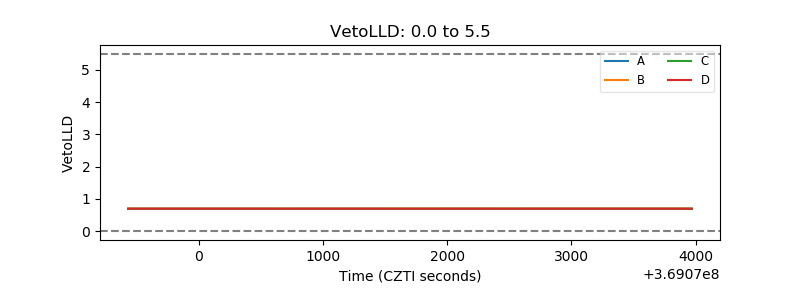 |
| Alpha Counter |  |
| _CPM_Rate | 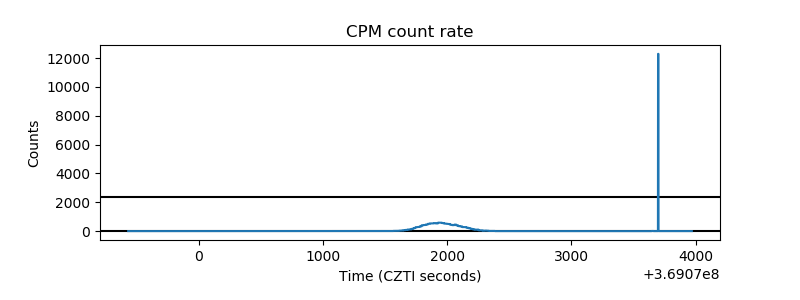 |
| CZT Counter |  |
| +2.5 Volts monitor |  |
| +5 Volts monitor |  |
| _ROLL_ROT | 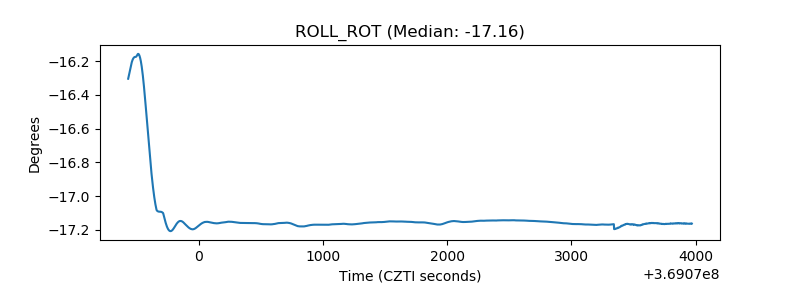 |
| _Roll_DEC | 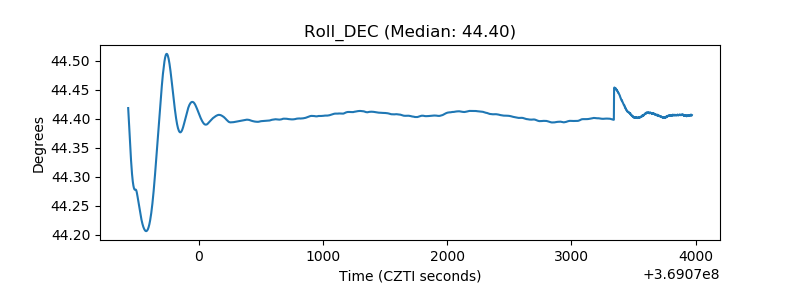 |
| _Roll_RA |  |
| Veto Counter | 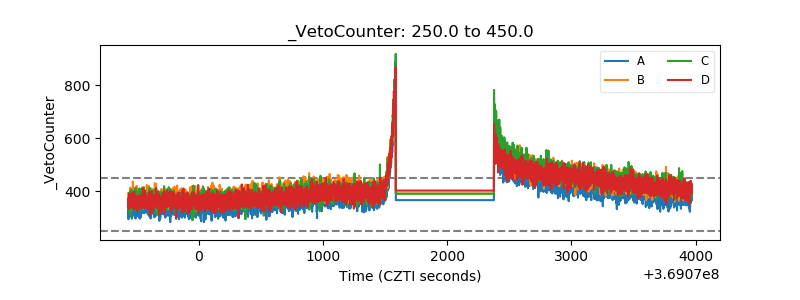 |