| Param | Original file | Final file |
|---|---|---|
| Filename | modeM0/AS1A10_057T01_9000004692_32202cztM0_level2.evt | modeM0/AS1A10_057T01_9000004692_32202cztM0_level2_quad_clean.evt |
| Size (bytes) | 623,701,440 | 66,208,320 |
| Size | 594.8 MB | 63.1 MB |
| Events in quadrant A | 3,128,188 | 397,302 |
| Events in quadrant B | 5,764,381 | 393,025 |
| Events in quadrant C | 4,139,906 | 390,407 |
| Events in quadrant D | 5,431,273 | 385,154 |
| Mode M0 | |||
|---|---|---|---|
| Quadrant | BADHDUFLAG | Total packets | Discarded packets |
| A | 0 | 13316 | 2 |
| B | 0 | 21561 | 1 |
| C | 0 | 16667 | 1 |
| D | 0 | 20452 | 1 |
| Mode SS | |||
|---|---|---|---|
| Quadrant | BADHDUFLAG | Total packets | Discarded packets |
| A | 0 | 128 | 0 |
| B | 0 | 128 | 0 |
| C | 0 | 128 | 0 |
| D | 0 | 128 | 0 |
| Mode M9 | |||
|---|---|---|---|
| Quadrant | BADHDUFLAG | Total packets | Discarded packets |
| A | 0 | 10 | 0 |
| B | 0 | 10 | 0 |
| C | 0 | 10 | 0 |
| D | 0 | 10 | 0 |
| Quadrant | Total seconds | Saturated seconds | Saturation percentage |
|---|---|---|---|
| A | 6283 | 55 | 0.875378% |
| B | 6283 | 507 | 8.069394% |
| C | 6283 | 288 | 4.583798% |
| D | 6283 | 792 | 12.605443% |
Noise dominated data is calculated using 1-second bins in cleaned event files. If a bin has >2000 counts, and if more than 50% of those come from <1% of pixels, then it is considered to be noise-dominated and hence unusable.
| Quadrant | # 1 sec bins | Bins with >0 counts | Bins with >2000 counts | High rate bins dominated by noise | Noise dominated (total time) | Noise dominated (detector-on time) | Marked lightcurve |
|---|---|---|---|---|---|---|---|
| A | 7238 | 6284 | 4 | 4 | 0.06% | 0.06% | 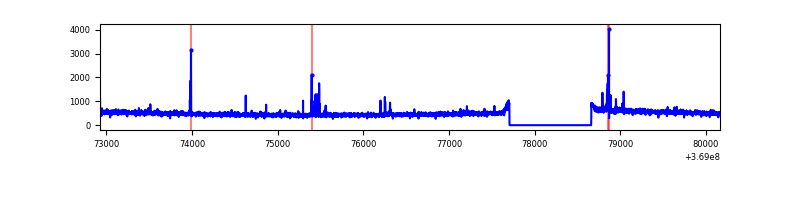 |
| B | 7238 | 6284 | 195 | 195 | 2.69% | 3.10% | 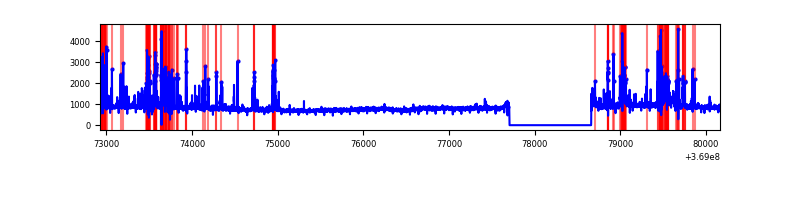 |
| C | 7238 | 6284 | 3 | 3 | 0.04% | 0.05% | 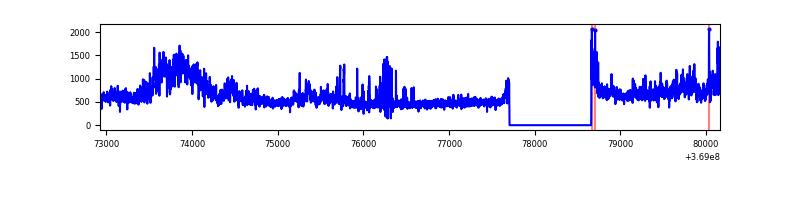 |
| D | 7238 | 6284 | 522 | 522 | 7.21% | 8.31% | 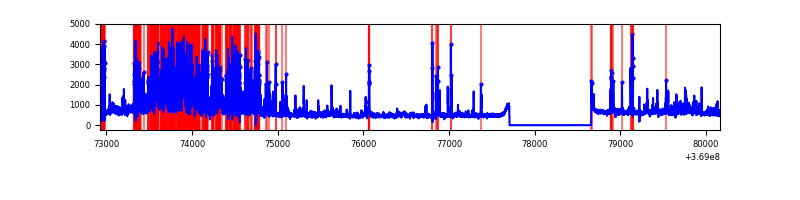 |
Top three noisy pixels from each quadrant. If the there are fewer than three noisy pixels in the level2.evt file, extra rows are filled as -1
| Pixel properties | Quadrant properties | ||||||
|---|---|---|---|---|---|---|---|
| Quadrant | DetID | PixID | Counts | Sigma | Mean | Median | Sigma |
| A | 15 | 174 | 34984 | 215.98 | 785 | 767 | 158.4 |
| A | 12 | 96 | 34958 | 215.82 | 785 | 767 | 158.4 |
| A | 0 | 6 | 14811 | 88.65 | 785 | 767 | 158.4 |
| B | 6 | 159 | 1817729 | 12617.59 | 752 | 734 | 144.0 |
| B | 5 | 172 | 824986 | 5723.78 | 752 | 734 | 144.0 |
| B | 0 | 229 | 63047 | 432.71 | 752 | 734 | 144.0 |
| C | 3 | 233 | 943658 | 5333.59 | 751 | 757 | 176.8 |
| C | 14 | 238 | 144965 | 815.72 | 751 | 757 | 176.8 |
| C | 0 | 10 | 41636 | 231.24 | 751 | 757 | 176.8 |
| D | 12 | 218 | 1476627 | 8481.14 | 727 | 710 | 174.0 |
| D | 8 | 195 | 345114 | 1979.07 | 727 | 710 | 174.0 |
| D | 14 | 52 | 333222 | 1910.73 | 727 | 710 | 174.0 |
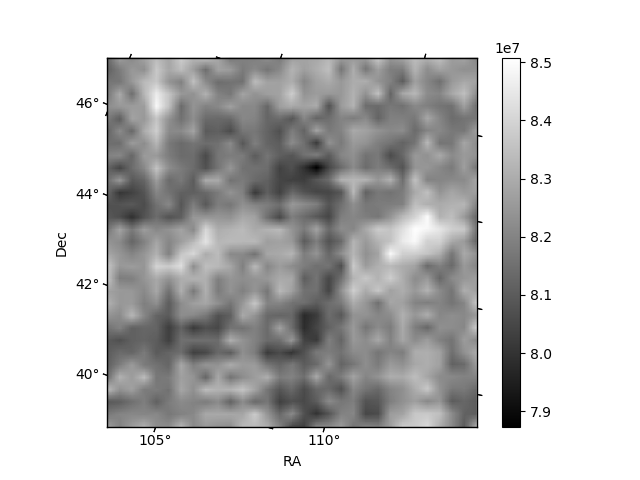
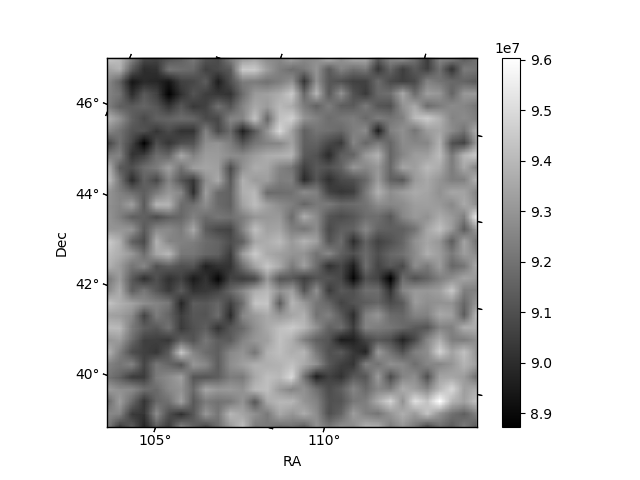
Histogram calculated using DETX and DETY for each event in the final _common_clean file
| Quadrant A | 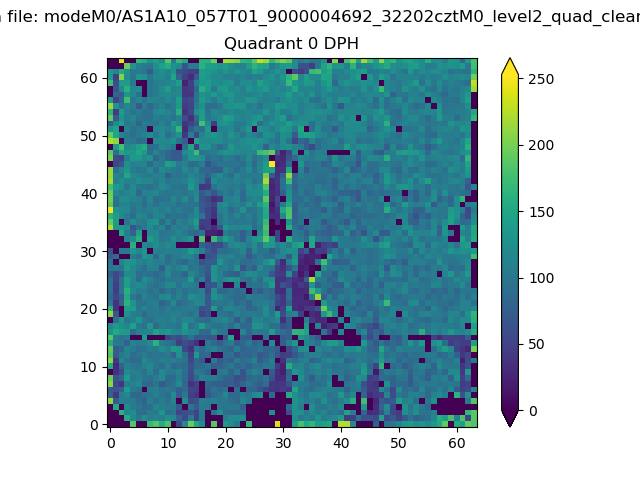 |
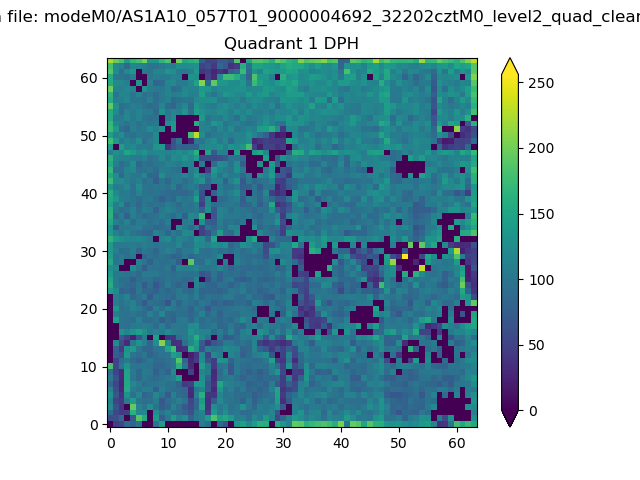 |
Quadrant B |
|---|---|---|---|
| Quadrant D | 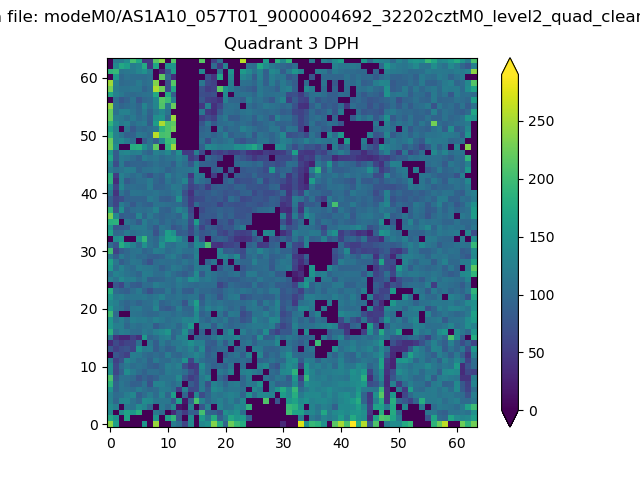 |
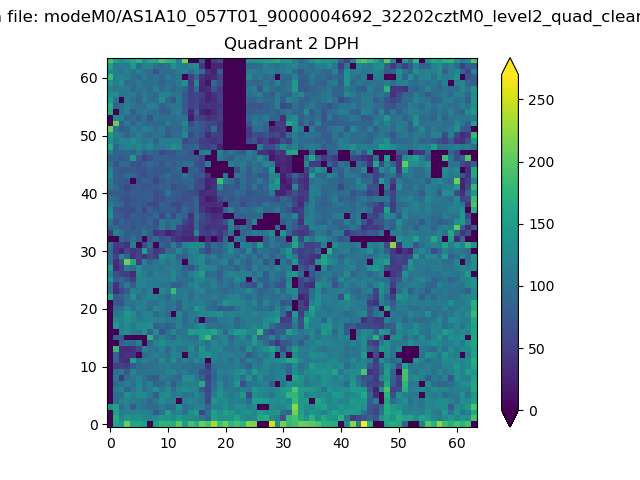 |
Quadrant C |
| Plot type | Count rate plots | Images |
|---|---|---|
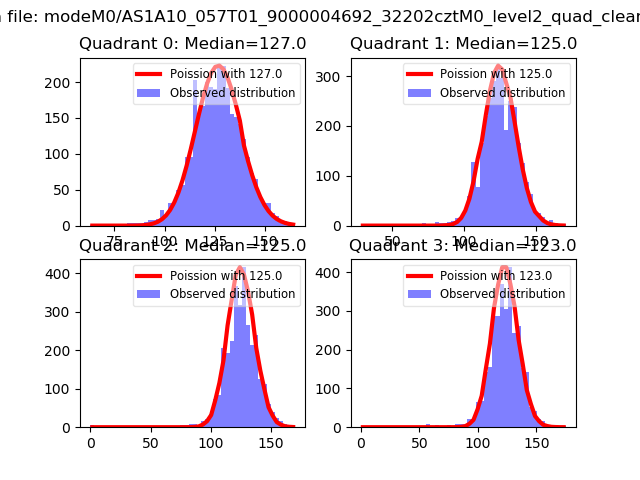
| Comparison with Poisson distribution Blue bars denote a histogram of data divided into 1 sec bins. Red curve is a Poisson curve with rate = median count rate of data. |
 |
 |
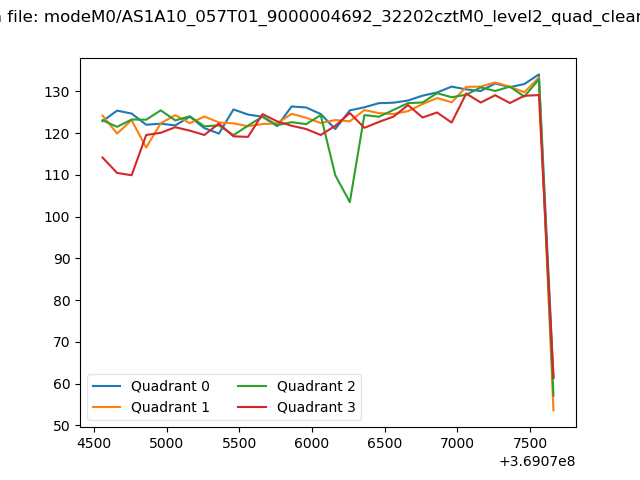
| Quadrant-wise count rates Data is divided into 100 sec bins |
 |
|
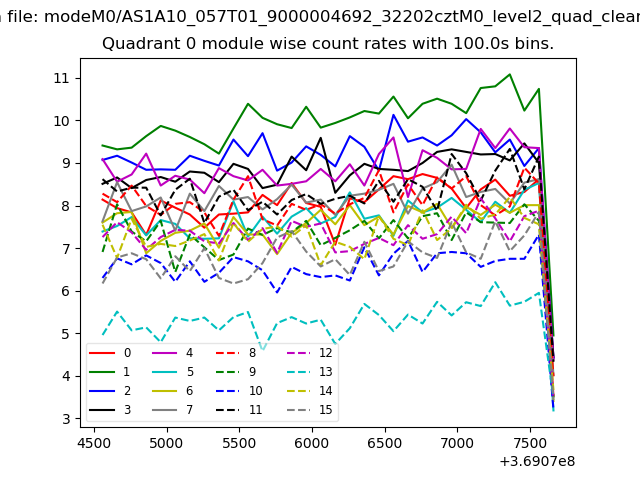
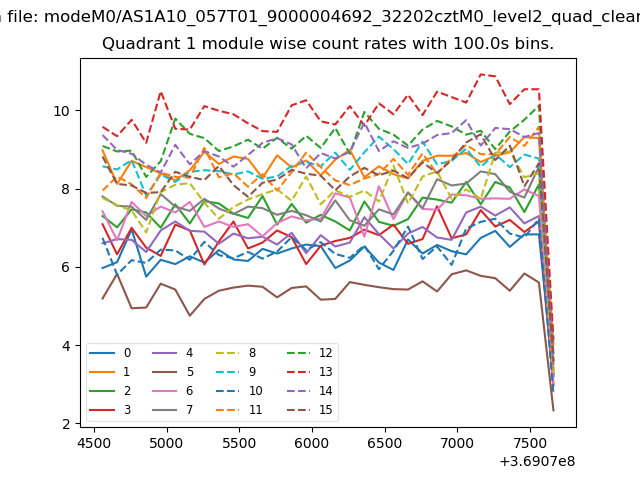
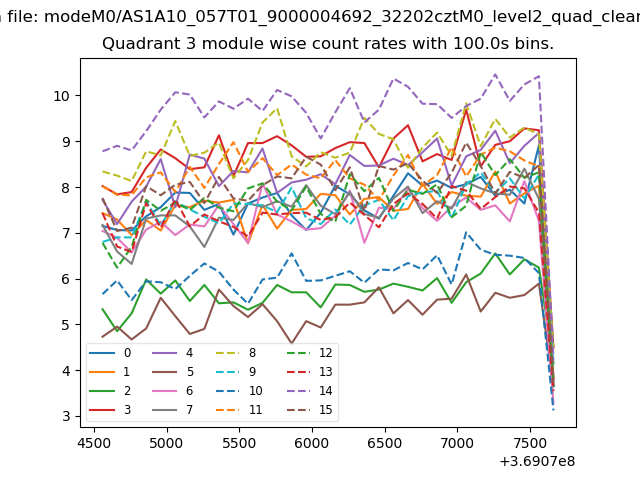
| Module-wise count rates for Quadrant A Data is divided into 100 sec bins |
 |
 |
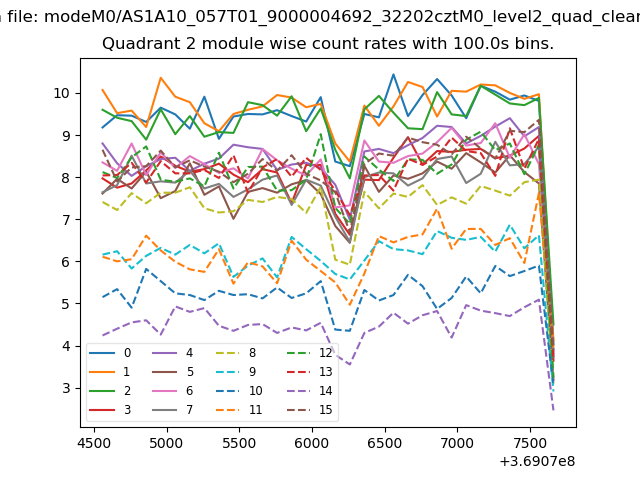
| Module-wise count rates for Quadrant B Data is divided into 100 sec bins |
 |
 |
| Module-wise count rates for Quadrant C Data is divided into 100 sec bins |
 |
 |
| Module-wise count rates for Quadrant D Data is divided into 100 sec bins |
 |
 |
| Parameter | Plot |
|---|---|
| CZT HV Monitor | 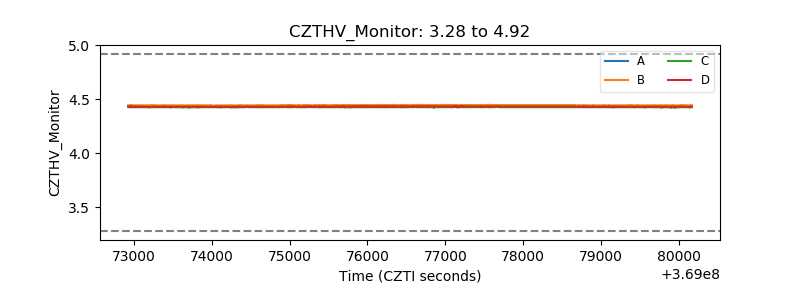 |
| D_VDD | 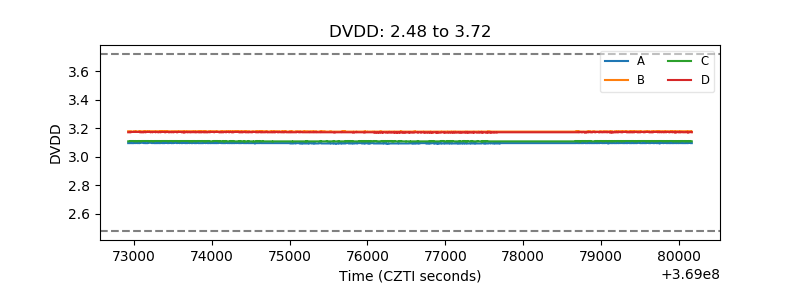 |
| Temperature 1 | 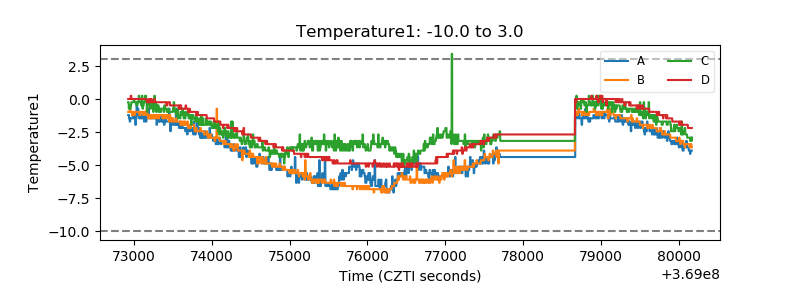 |
| Veto HV Monitor | 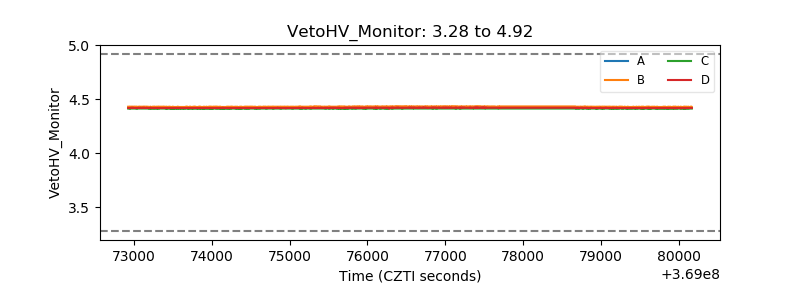 |
| Veto LLD | 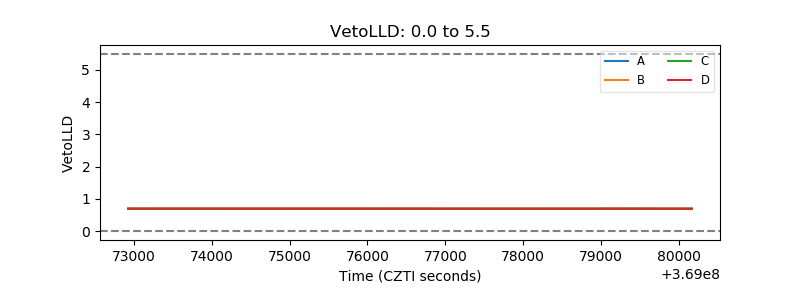 |
| Alpha Counter | 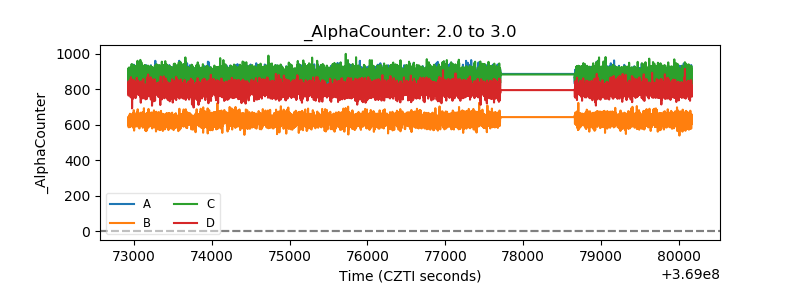 |
| _CPM_Rate |  |
| CZT Counter | 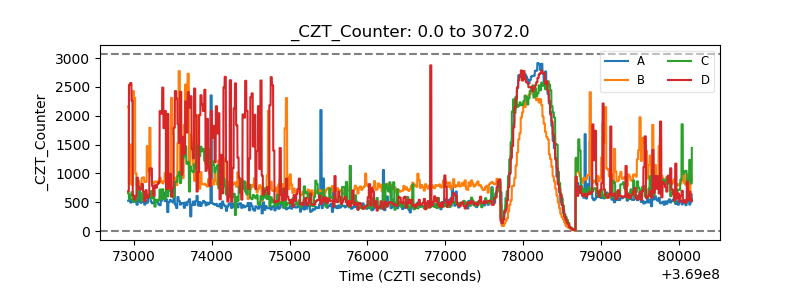 |
| +2.5 Volts monitor | 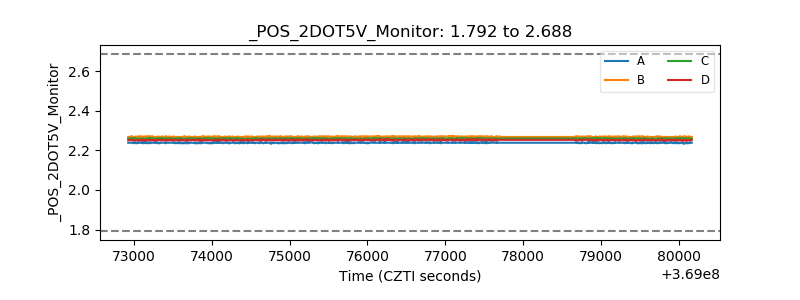 |
| +5 Volts monitor | 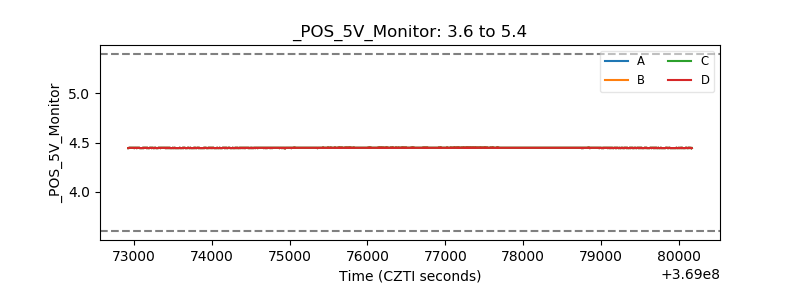 |
| _ROLL_ROT | 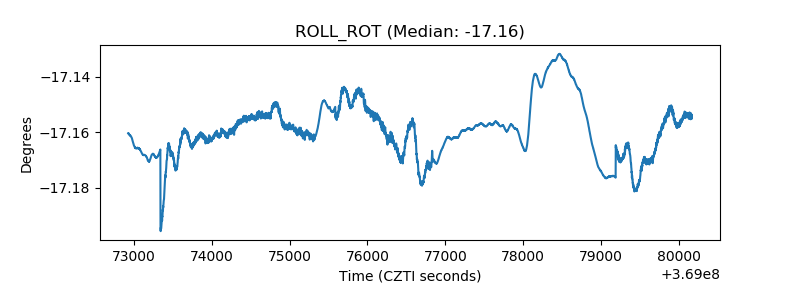 |
| _Roll_DEC | 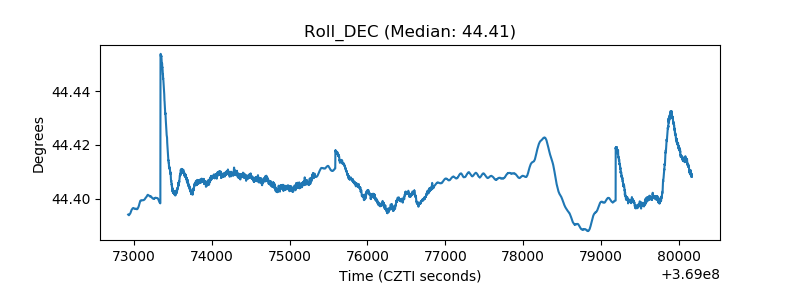 |
| _Roll_RA | 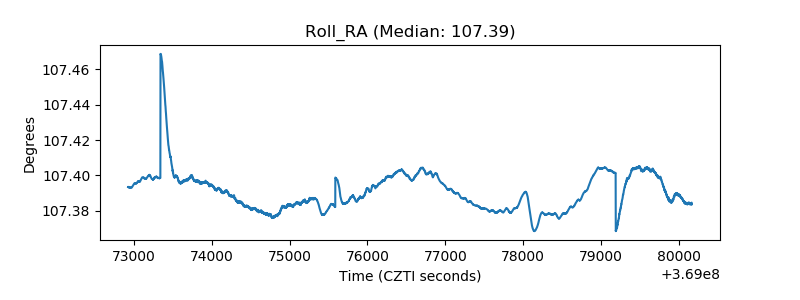 |
| Veto Counter | 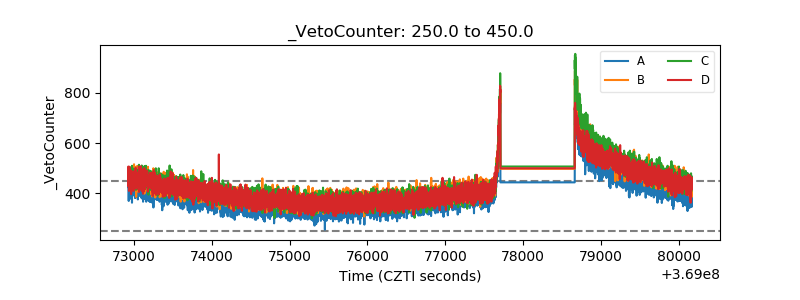 |