| Param | Original file | Final file |
|---|---|---|
| Filename | modeM0/AS1A10_057T01_9000004692_32204cztM0_level2.evt | modeM0/AS1A10_057T01_9000004692_32204cztM0_level2_quad_clean.evt |
| Size (bytes) | 595,319,040 | 72,552,960 |
| Size | 567.7 MB | 69.2 MB |
| Events in quadrant A | 3,137,664 | 447,161 |
| Events in quadrant B | 5,391,875 | 445,235 |
| Events in quadrant C | 4,345,388 | 441,749 |
| Events in quadrant D | 4,733,252 | 427,881 |
| Mode M0 | |||
|---|---|---|---|
| Quadrant | BADHDUFLAG | Total packets | Discarded packets |
| A | 0 | 13453 | 2 |
| B | 0 | 20745 | 1 |
| C | 0 | 17345 | 1 |
| D | 0 | 18371 | 1 |
| Mode SS | |||
|---|---|---|---|
| Quadrant | BADHDUFLAG | Total packets | Discarded packets |
| A | 0 | 126 | 0 |
| B | 0 | 126 | 0 |
| C | 0 | 126 | 0 |
| D | 0 | 126 | 0 |
| Mode M9 | |||
|---|---|---|---|
| Quadrant | BADHDUFLAG | Total packets | Discarded packets |
| A | 0 | 11 | 0 |
| B | 0 | 11 | 0 |
| C | 0 | 11 | 0 |
| D | 0 | 11 | 0 |
| Quadrant | Total seconds | Saturated seconds | Saturation percentage |
|---|---|---|---|
| A | 6231 | 41 | 0.658000% |
| B | 6231 | 243 | 3.899856% |
| C | 6231 | 232 | 3.723319% |
| D | 6231 | 338 | 5.424490% |
Noise dominated data is calculated using 1-second bins in cleaned event files. If a bin has >2000 counts, and if more than 50% of those come from <1% of pixels, then it is considered to be noise-dominated and hence unusable.
| Quadrant | # 1 sec bins | Bins with >0 counts | Bins with >2000 counts | High rate bins dominated by noise | Noise dominated (total time) | Noise dominated (detector-on time) | Marked lightcurve |
|---|---|---|---|---|---|---|---|
| A | 7331 | 6232 | 0 | 0 | 0.00% | 0.00% | 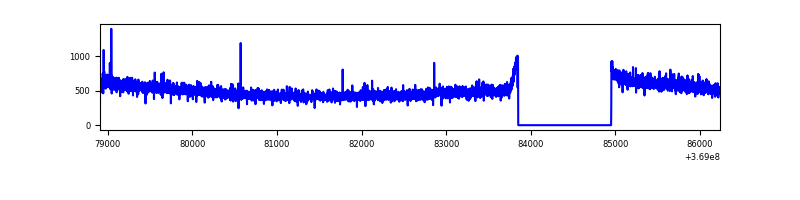 |
| B | 7331 | 6232 | 67 | 67 | 0.91% | 1.08% | 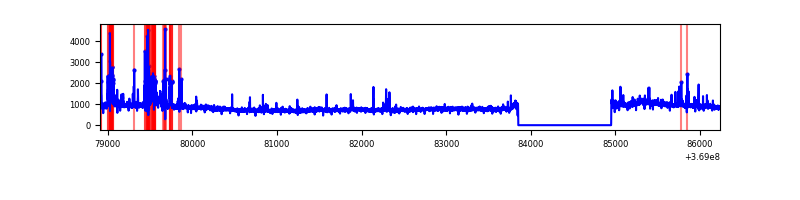 |
| C | 7331 | 6232 | 4 | 4 | 0.05% | 0.06% | 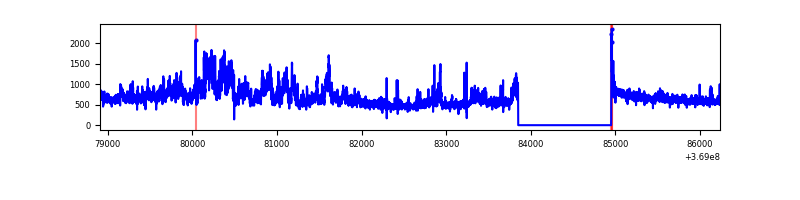 |
| D | 7331 | 6232 | 152 | 152 | 2.07% | 2.44% | 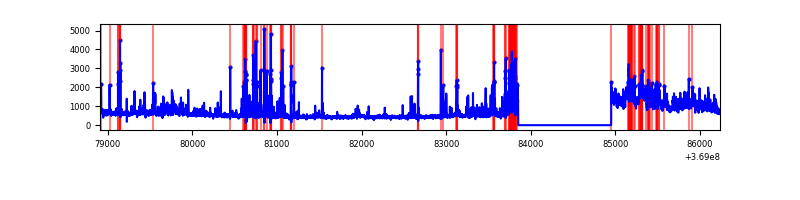 |
Top three noisy pixels from each quadrant. If the there are fewer than three noisy pixels in the level2.evt file, extra rows are filled as -1
| Pixel properties | Quadrant properties | ||||||
|---|---|---|---|---|---|---|---|
| Quadrant | DetID | PixID | Counts | Sigma | Mean | Median | Sigma |
| A | 13 | 6 | 16129 | 95.41 | 802 | 788 | 160.8 |
| A | 13 | 254 | 12648 | 73.76 | 802 | 788 | 160.8 |
| A | 12 | 189 | 12019 | 69.85 | 802 | 788 | 160.8 |
| B | 6 | 159 | 1839984 | 12290.39 | 791 | 773 | 149.6 |
| B | 5 | 172 | 303638 | 2023.87 | 791 | 773 | 149.6 |
| B | 0 | 229 | 61325 | 404.63 | 791 | 773 | 149.6 |
| C | 3 | 233 | 1034715 | 5697.62 | 779 | 785 | 181.5 |
| C | 14 | 238 | 144204 | 790.33 | 779 | 785 | 181.5 |
| C | 14 | 67 | 45045 | 243.9 | 779 | 785 | 181.5 |
| D | 8 | 195 | 803654 | 4342.42 | 773 | 754 | 184.9 |
| D | 12 | 218 | 487632 | 2633.24 | 773 | 754 | 184.9 |
| D | 13 | 249 | 206845 | 1114.63 | 773 | 754 | 184.9 |
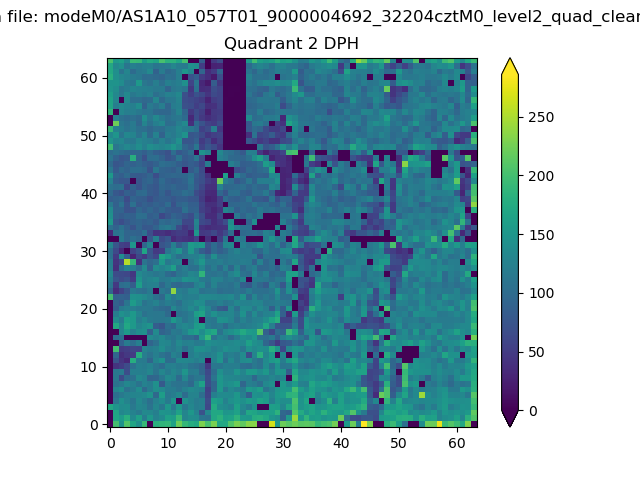
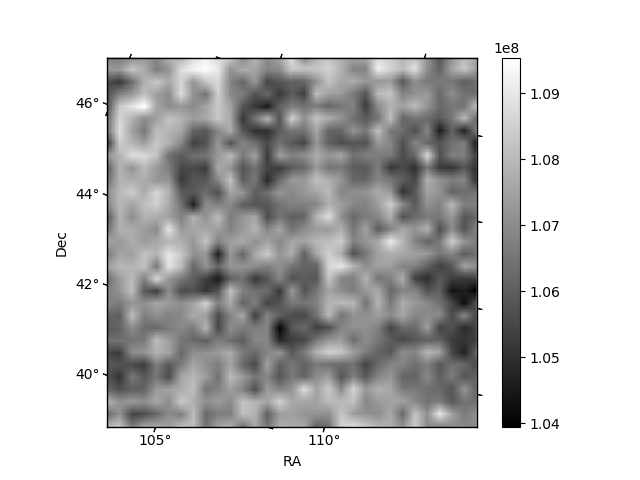
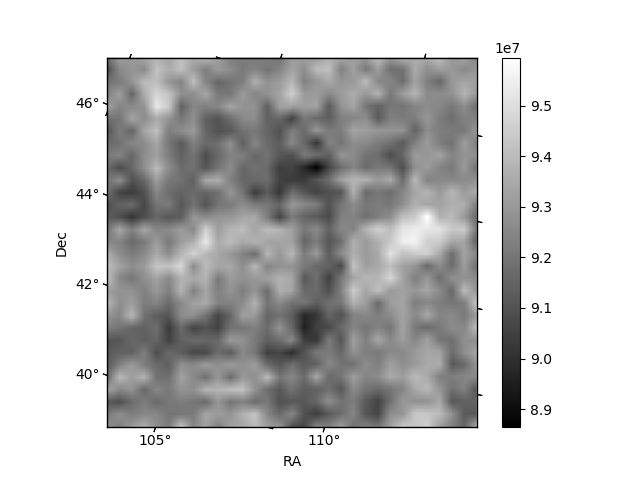
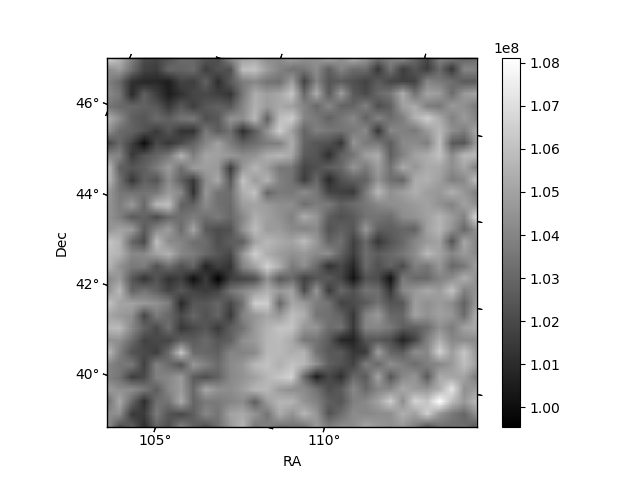
Histogram calculated using DETX and DETY for each event in the final _common_clean file
| Quadrant A | 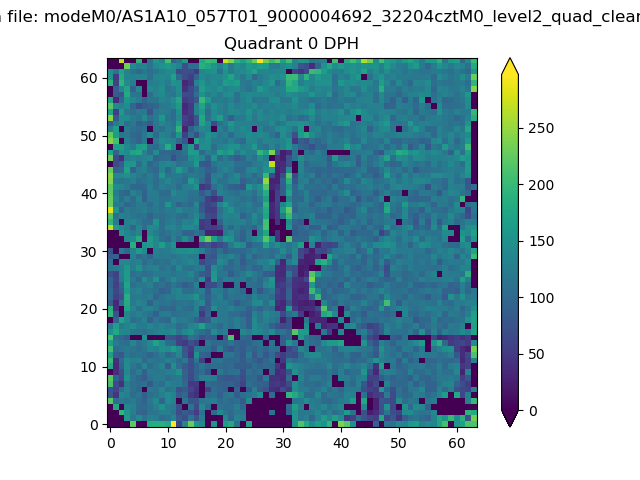 |
 |
Quadrant B |
|---|---|---|---|
| Quadrant D |  |
 |
Quadrant C |
| Plot type | Count rate plots | Images |
|---|---|---|
| Comparison with Poisson distribution Blue bars denote a histogram of data divided into 1 sec bins. Red curve is a Poisson curve with rate = median count rate of data. |
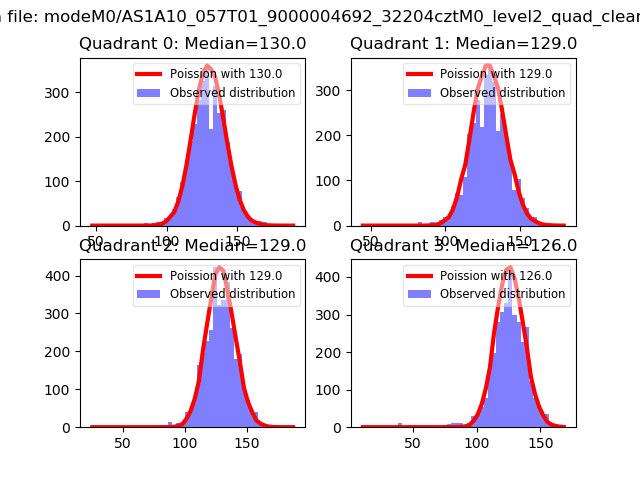 |
 |
| Quadrant-wise count rates Data is divided into 100 sec bins |
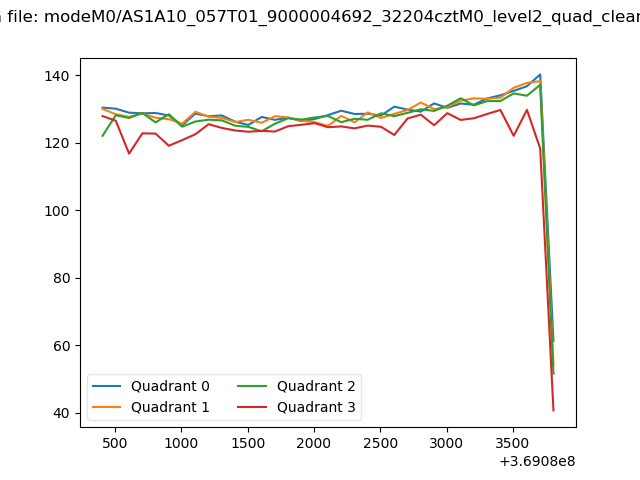 |
|
| Module-wise count rates for Quadrant A Data is divided into 100 sec bins |
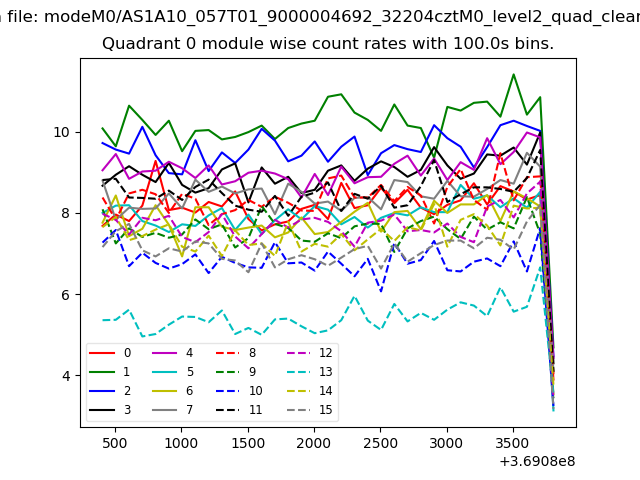 |
 |
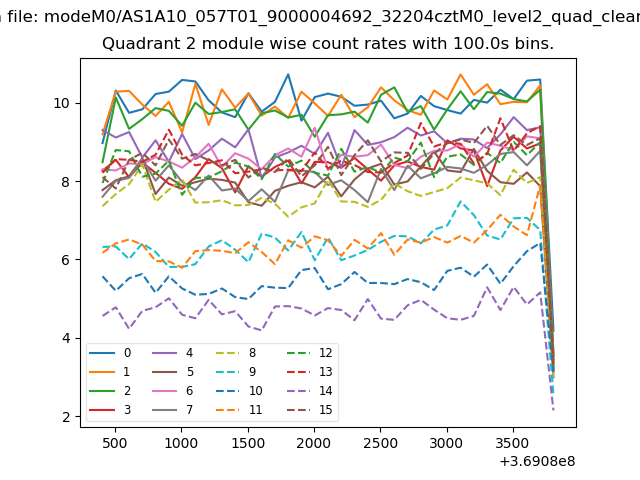
| Module-wise count rates for Quadrant B Data is divided into 100 sec bins |
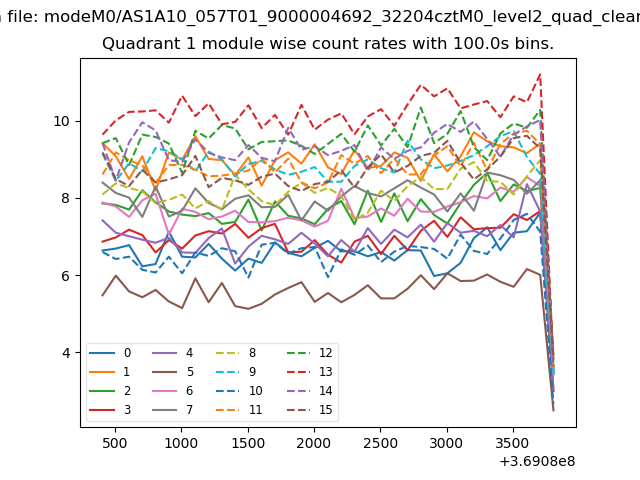 |
 |
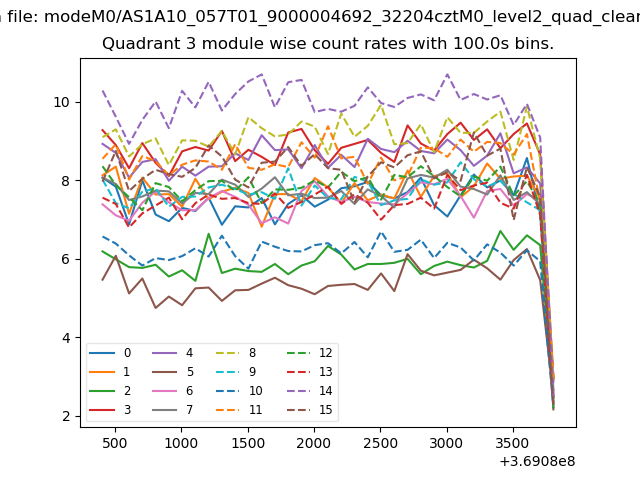
| Module-wise count rates for Quadrant C Data is divided into 100 sec bins |
 |
 |
| Module-wise count rates for Quadrant D Data is divided into 100 sec bins |
 |
 |
| Parameter | Plot |
|---|---|
| CZT HV Monitor | 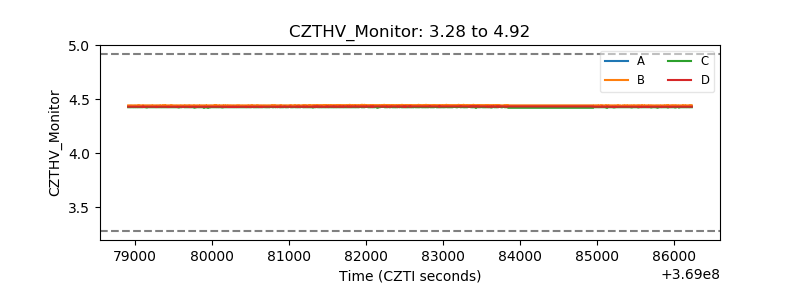 |
| D_VDD | 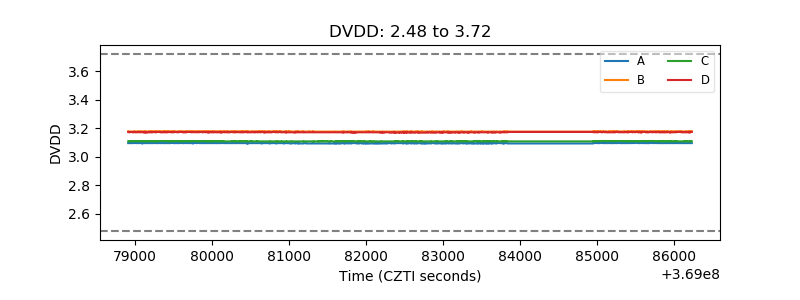 |
| Temperature 1 | 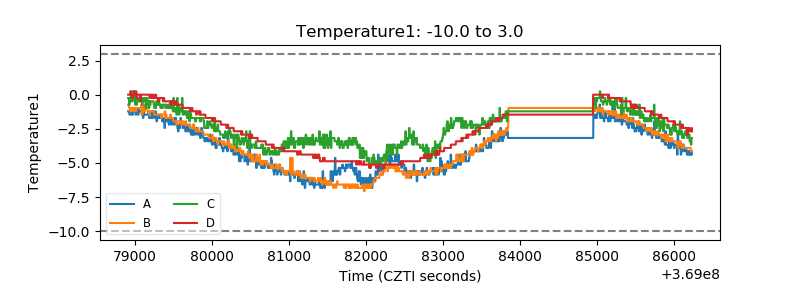 |
| Veto HV Monitor | 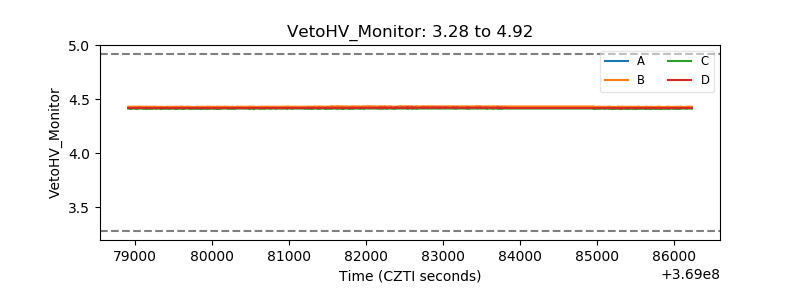 |
| Veto LLD | 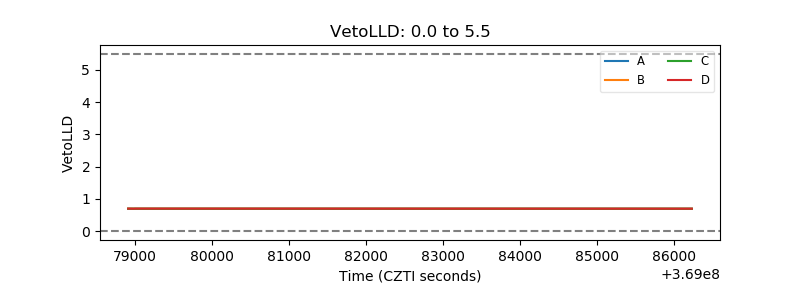 |
| Alpha Counter | 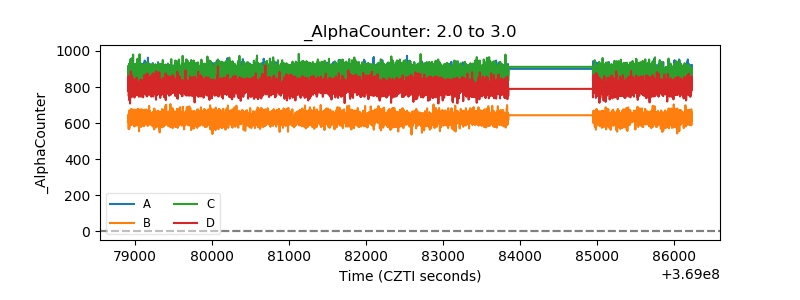 |
| _CPM_Rate | 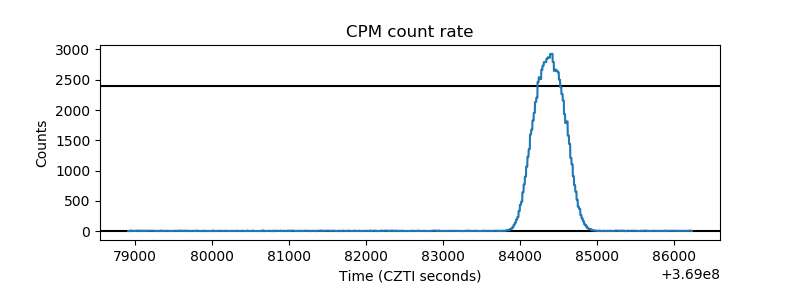 |
| CZT Counter | 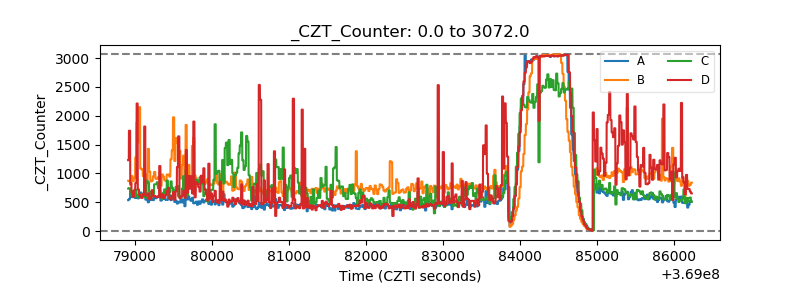 |
| +2.5 Volts monitor |  |
| +5 Volts monitor |  |
| _ROLL_ROT | 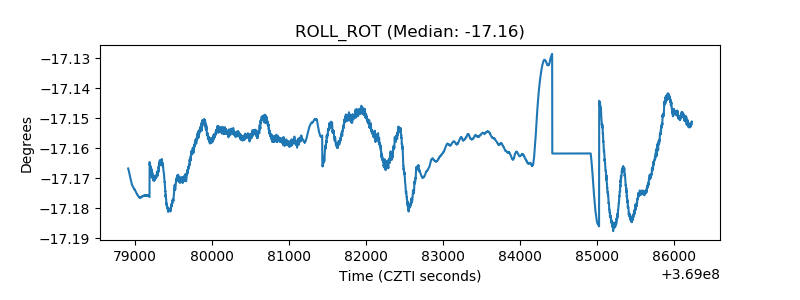 |
| _Roll_DEC | 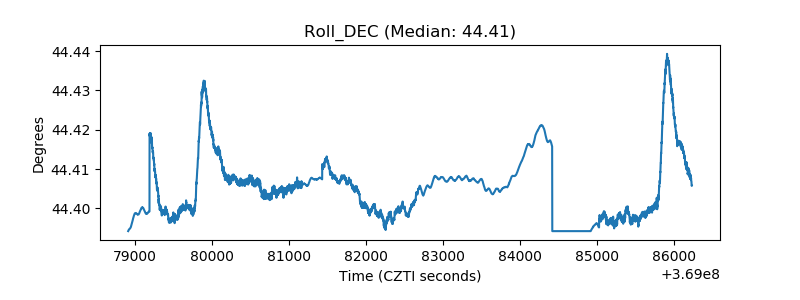 |
| _Roll_RA |  |
| Veto Counter | 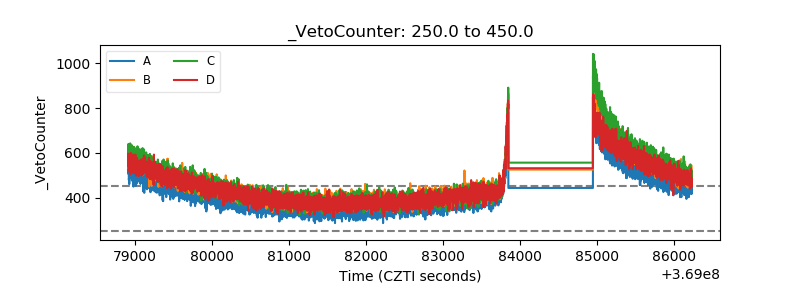 |