| Param | Original file | Final file |
|---|---|---|
| Filename | modeM0/AS1A10_057T01_9000004692_32206cztM0_level2.evt | modeM0/AS1A10_057T01_9000004692_32206cztM0_level2_quad_clean.evt |
| Size (bytes) | 612,089,280 | 100,100,160 |
| Size | 583.7 MB | 95.5 MB |
| Events in quadrant A | 3,311,726 | 660,074 |
| Events in quadrant B | 5,437,881 | 669,613 |
| Events in quadrant C | 4,075,232 | 648,235 |
| Events in quadrant D | 5,296,028 | 623,647 |
| Mode M0 | |||
|---|---|---|---|
| Quadrant | BADHDUFLAG | Total packets | Discarded packets |
| A | 0 | 13859 | 3 |
| B | 0 | 20455 | 2 |
| C | 0 | 16200 | 2 |
| D | 0 | 20209 | 2 |
| Mode SS | |||
|---|---|---|---|
| Quadrant | BADHDUFLAG | Total packets | Discarded packets |
| A | 0 | 126 | 0 |
| B | 0 | 126 | 0 |
| C | 0 | 126 | 0 |
| D | 0 | 126 | 0 |
| Mode M9 | |||
|---|---|---|---|
| Quadrant | BADHDUFLAG | Total packets | Discarded packets |
| A | 0 | 15 | 0 |
| B | 0 | 15 | 0 |
| C | 0 | 15 | 0 |
| D | 0 | 16 | 0 |
| Quadrant | Total seconds | Saturated seconds | Saturation percentage |
|---|---|---|---|
| A | 6155 | 38 | 0.617384% |
| B | 6155 | 240 | 3.899269% |
| C | 6155 | 717 | 11.649066% |
| D | 6155 | 258 | 4.191714% |
Noise dominated data is calculated using 1-second bins in cleaned event files. If a bin has >2000 counts, and if more than 50% of those come from <1% of pixels, then it is considered to be noise-dominated and hence unusable.
| Quadrant | # 1 sec bins | Bins with >0 counts | Bins with >2000 counts | High rate bins dominated by noise | Noise dominated (total time) | Noise dominated (detector-on time) | Marked lightcurve |
|---|---|---|---|---|---|---|---|
| A | 7475 | 6156 | 1 | 1 | 0.01% | 0.02% | 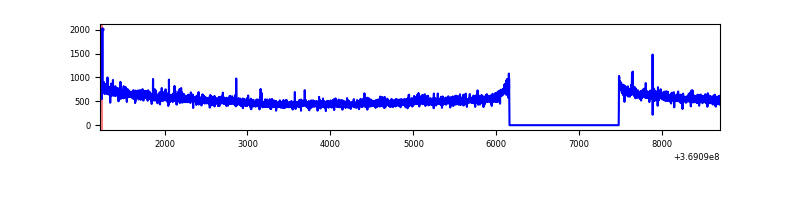 |
| B | 7475 | 6156 | 76 | 76 | 1.02% | 1.23% | 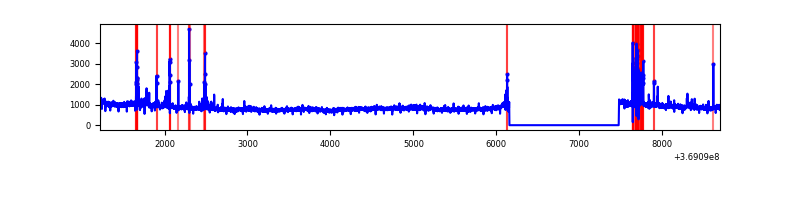 |
| C | 7475 | 6156 | 106 | 106 | 1.42% | 1.72% | 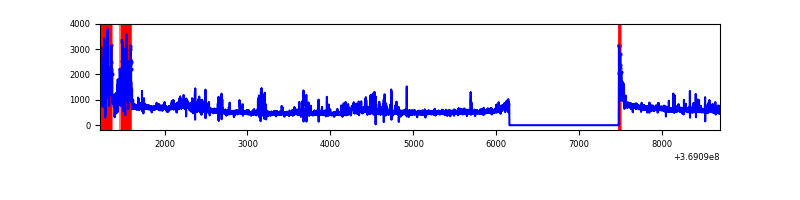 |
| D | 7475 | 6156 | 160 | 160 | 2.14% | 2.60% | 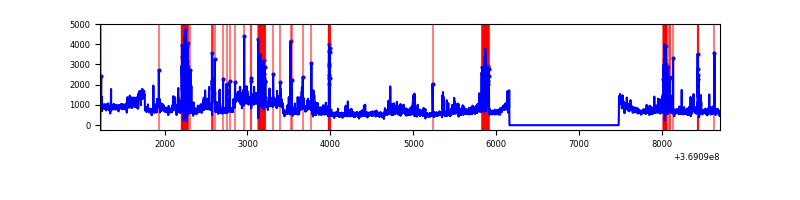 |
Top three noisy pixels from each quadrant. If the there are fewer than three noisy pixels in the level2.evt file, extra rows are filled as -1
| Pixel properties | Quadrant properties | ||||||
|---|---|---|---|---|---|---|---|
| Quadrant | DetID | PixID | Counts | Sigma | Mean | Median | Sigma |
| A | 12 | 189 | 61884 | 369.4 | 836 | 822 | 165.3 |
| A | 13 | 6 | 12832 | 72.66 | 836 | 822 | 165.3 |
| A | 13 | 254 | 12170 | 68.65 | 836 | 822 | 165.3 |
| B | 6 | 159 | 1795138 | 11659.92 | 830 | 810 | 153.9 |
| B | 5 | 172 | 244114 | 1581.04 | 830 | 810 | 153.9 |
| B | 0 | 229 | 71163 | 457.17 | 830 | 810 | 153.9 |
| C | 3 | 233 | 442188 | 2440.36 | 787 | 799 | 180.9 |
| C | 14 | 238 | 244591 | 1347.88 | 787 | 799 | 180.9 |
| C | 14 | 254 | 163112 | 897.4 | 787 | 799 | 180.9 |
| D | 8 | 195 | 1514993 | 7957.96 | 811 | 792 | 190.3 |
| D | 13 | 249 | 407066 | 2135.19 | 811 | 792 | 190.3 |
| D | 12 | 218 | 240806 | 1261.41 | 811 | 792 | 190.3 |
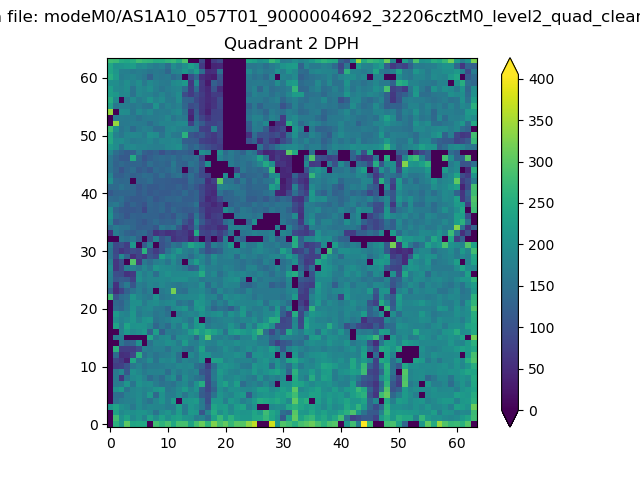
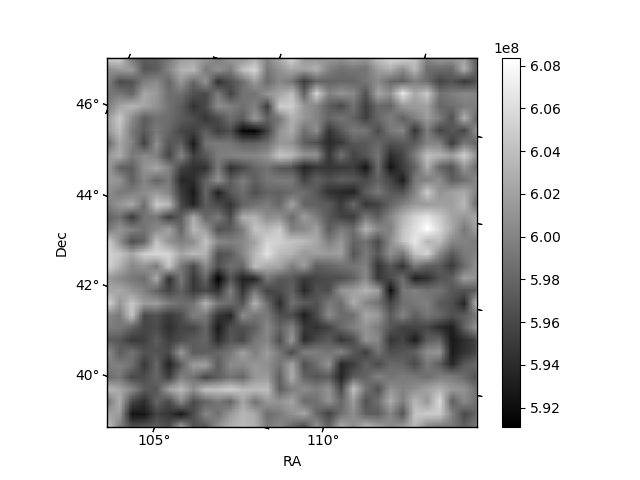
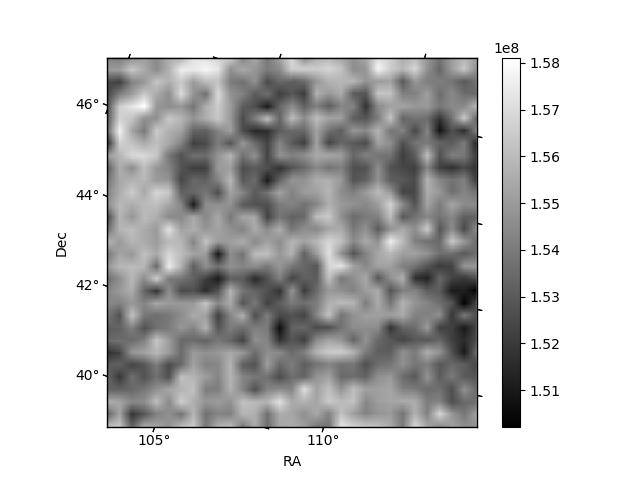
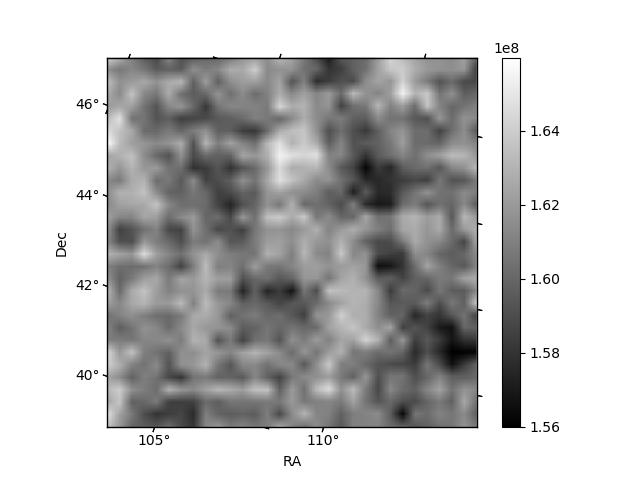
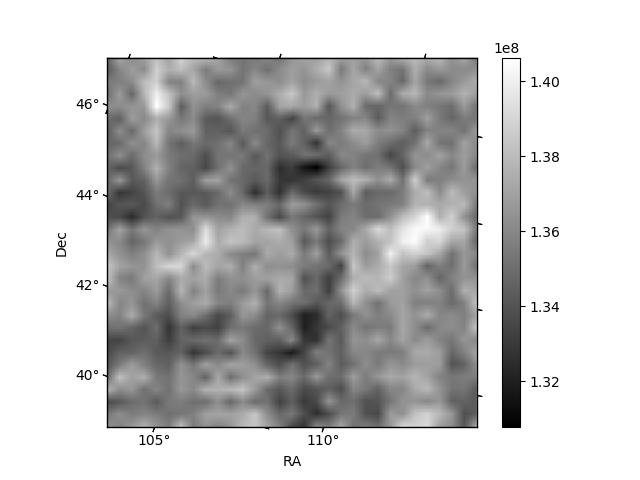
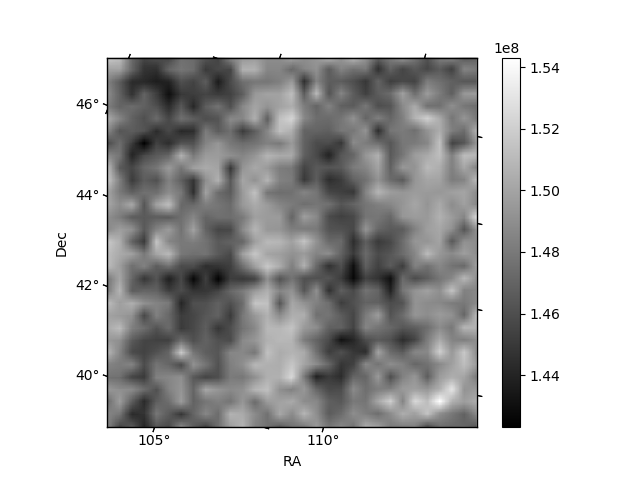
Histogram calculated using DETX and DETY for each event in the final _common_clean file
| Quadrant A | 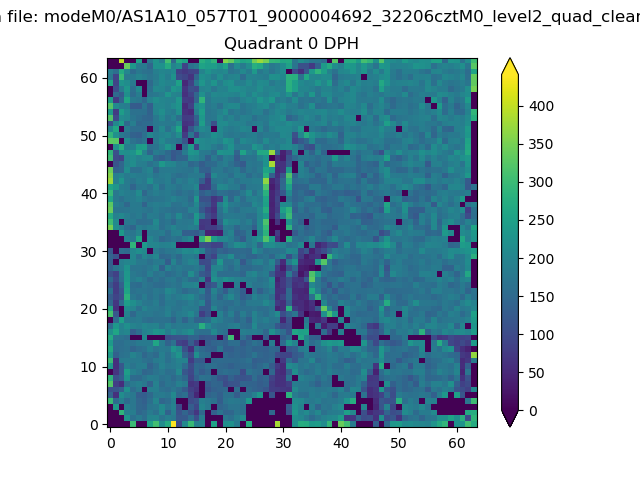 |
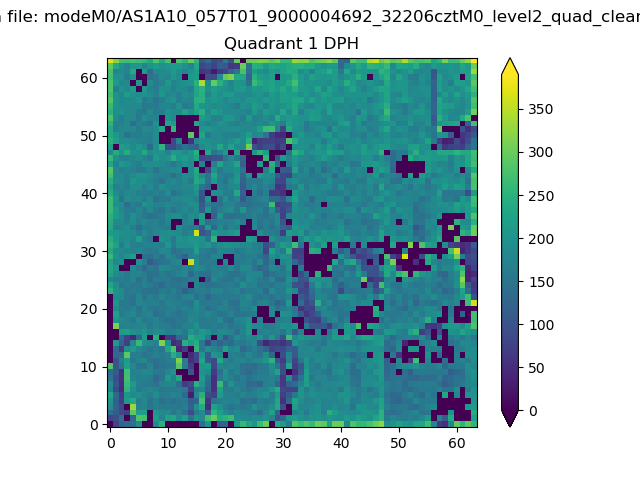 |
Quadrant B |
|---|---|---|---|
| Quadrant D | 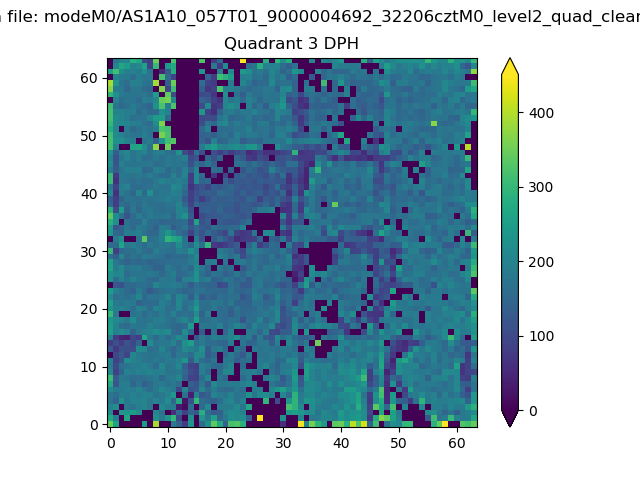 |
 |
Quadrant C |
| Plot type | Count rate plots | Images |
|---|---|---|
| Comparison with Poisson distribution Blue bars denote a histogram of data divided into 1 sec bins. Red curve is a Poisson curve with rate = median count rate of data. |
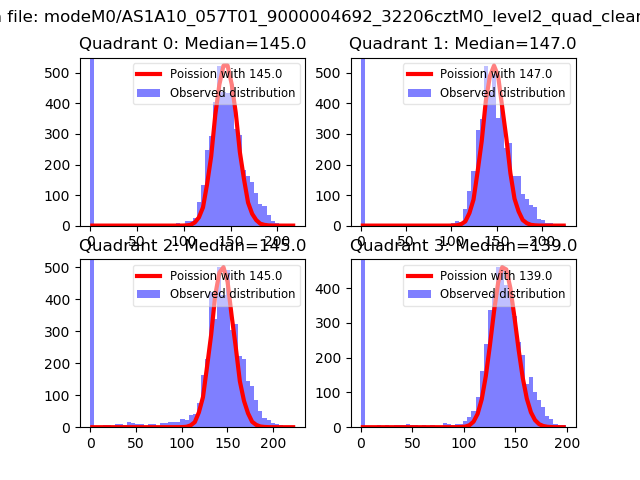 |
 |
| Quadrant-wise count rates Data is divided into 100 sec bins |
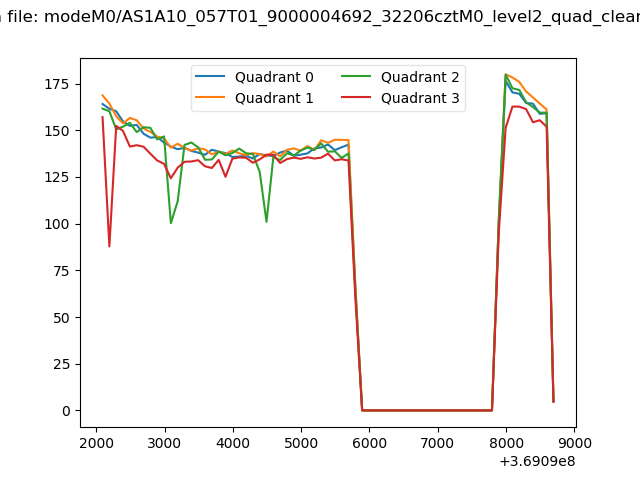 |
|
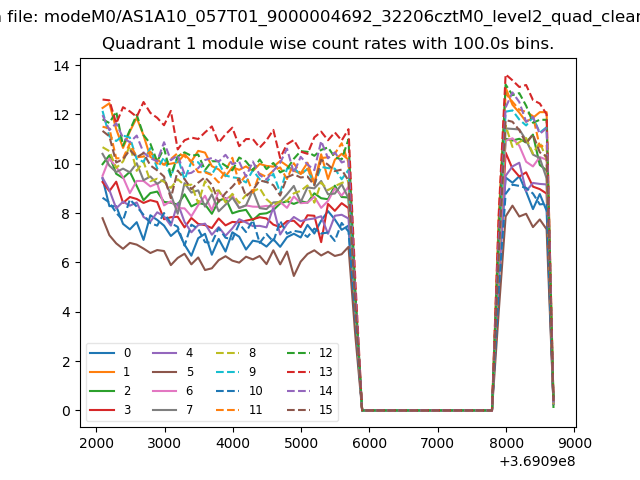
| Module-wise count rates for Quadrant A Data is divided into 100 sec bins |
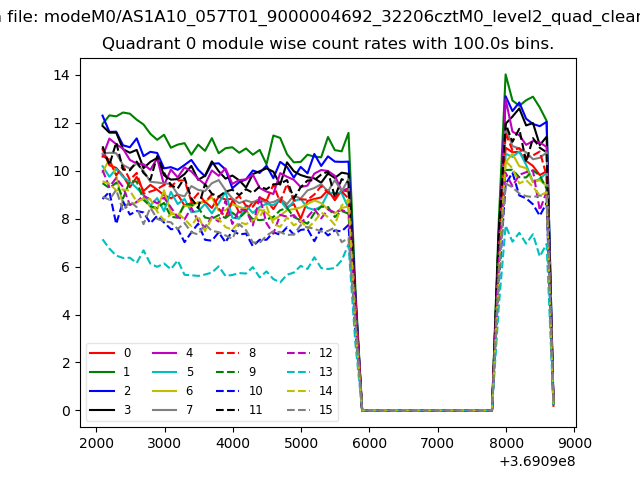 |
 |
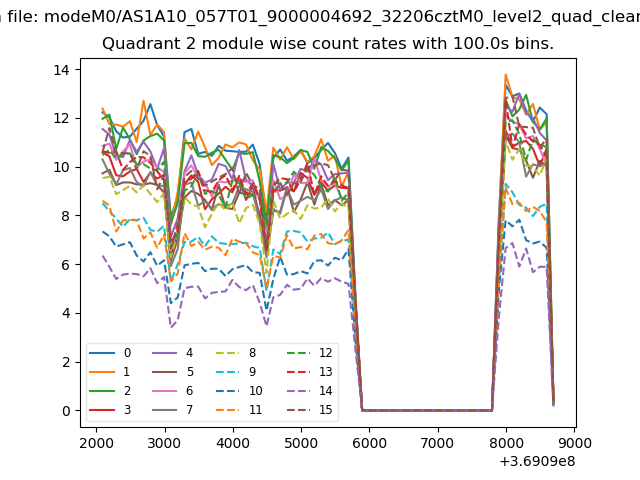
| Module-wise count rates for Quadrant B Data is divided into 100 sec bins |
 |
 |
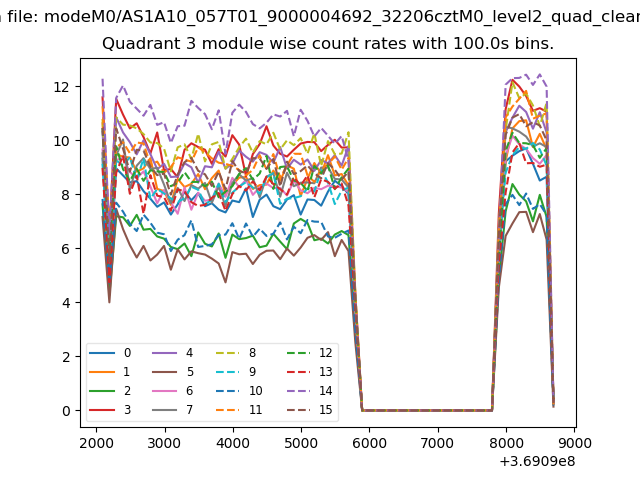
| Module-wise count rates for Quadrant C Data is divided into 100 sec bins |
 |
 |
| Module-wise count rates for Quadrant D Data is divided into 100 sec bins |
 |
 |
| Parameter | Plot |
|---|---|
| CZT HV Monitor |  |
| D_VDD | 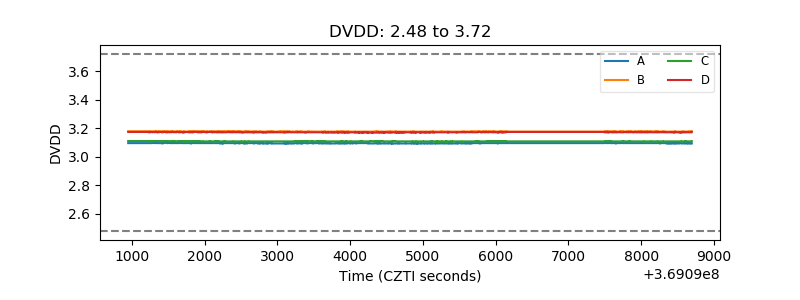 |
| Temperature 1 | 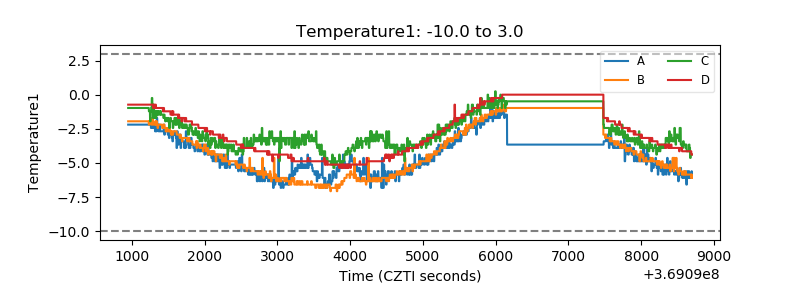 |
| Veto HV Monitor | 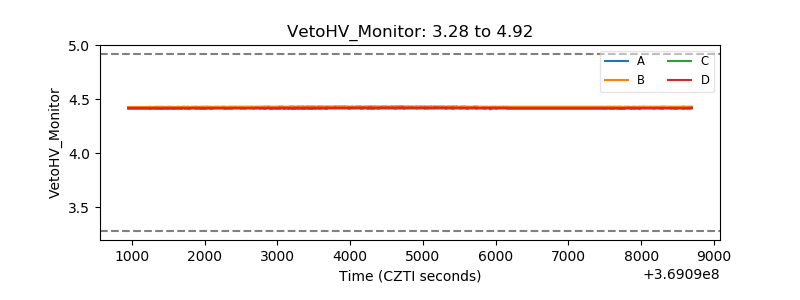 |
| Veto LLD | 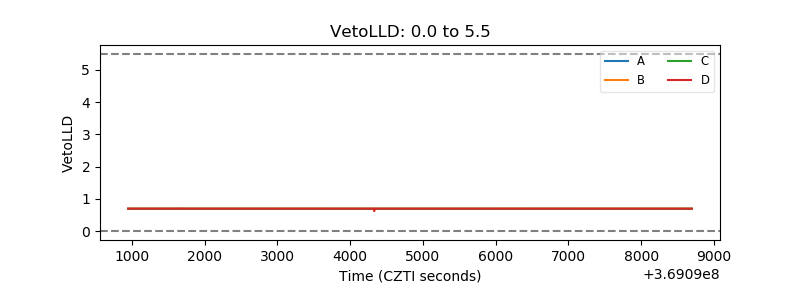 |
| Alpha Counter | 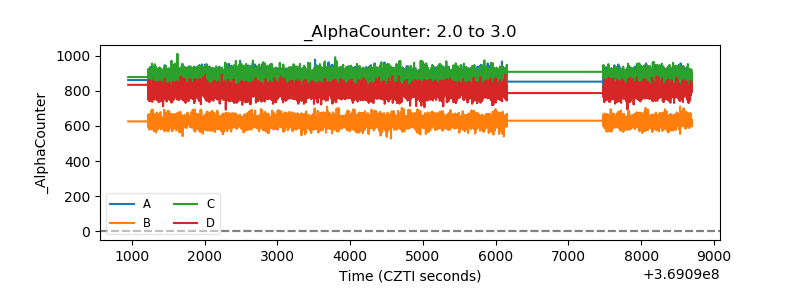 |
| _CPM_Rate | 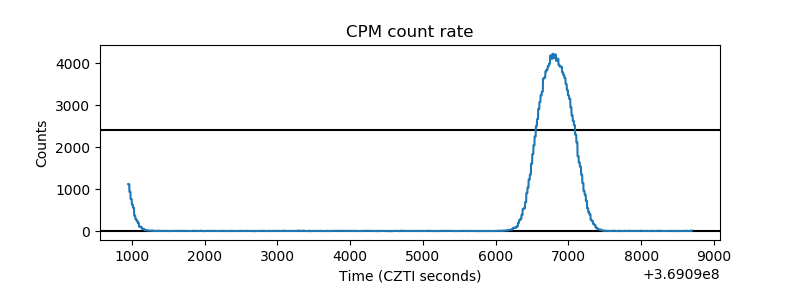 |
| CZT Counter | 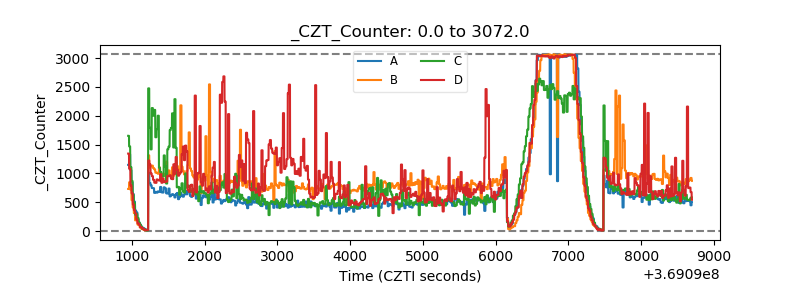 |
| +2.5 Volts monitor | 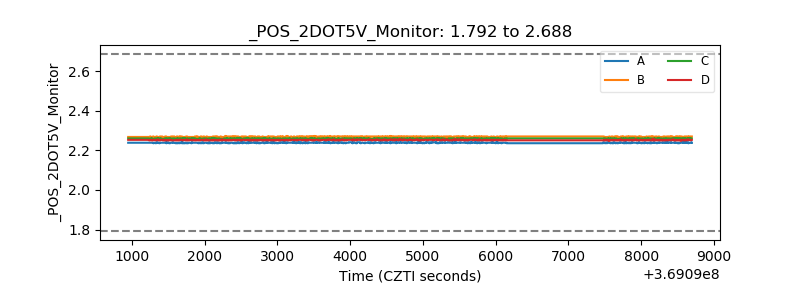 |
| +5 Volts monitor | 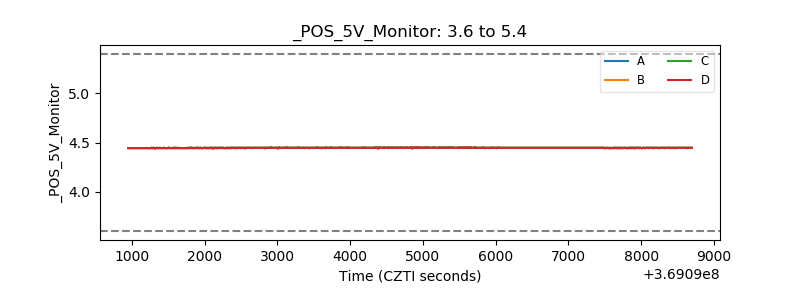 |
| _ROLL_ROT | 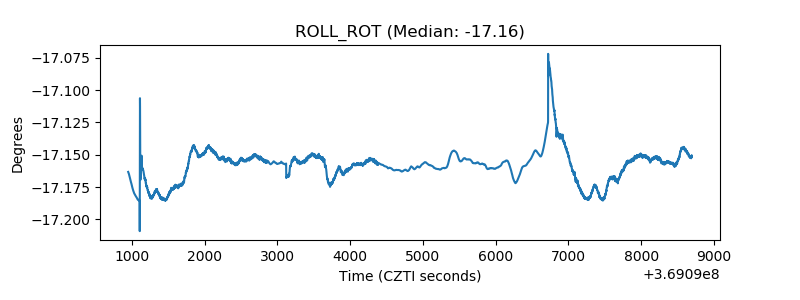 |
| _Roll_DEC | 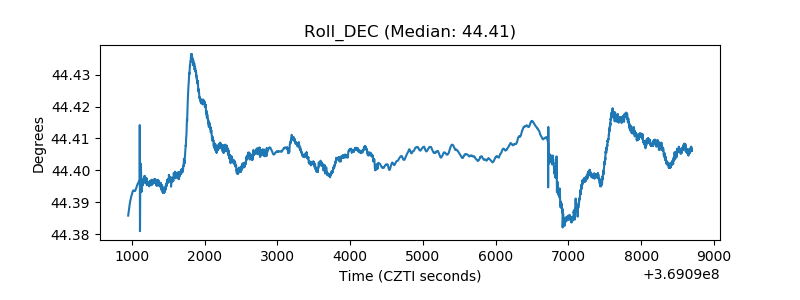 |
| _Roll_RA | 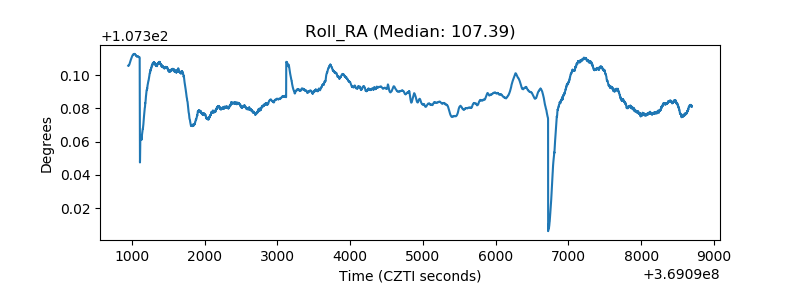 |
| Veto Counter | 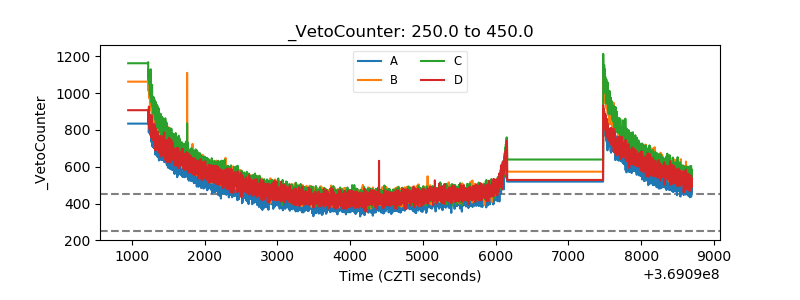 |