| Param | Original file | Final file |
|---|---|---|
| Filename | modeM0/AS1A10_057T01_9000004692_32208cztM0_level2.evt | modeM0/AS1A10_057T01_9000004692_32208cztM0_level2_quad_clean.evt |
| Size (bytes) | 601,891,200 | 119,684,160 |
| Size | 574.0 MB | 114.1 MB |
| Events in quadrant A | 3,330,920 | 803,748 |
| Events in quadrant B | 5,585,234 | 815,138 |
| Events in quadrant C | 3,548,595 | 806,553 |
| Events in quadrant D | 5,321,407 | 743,438 |
| Mode M0 | |||
|---|---|---|---|
| Quadrant | BADHDUFLAG | Total packets | Discarded packets |
| A | 0 | 13986 | 3 |
| B | 0 | 21040 | 2 |
| C | 0 | 14573 | 2 |
| D | 0 | 20124 | 2 |
| Mode SS | |||
|---|---|---|---|
| Quadrant | BADHDUFLAG | Total packets | Discarded packets |
| A | 0 | 132 | 0 |
| B | 0 | 132 | 0 |
| C | 0 | 132 | 0 |
| D | 0 | 132 | 0 |
| Mode M9 | |||
|---|---|---|---|
| Quadrant | BADHDUFLAG | Total packets | Discarded packets |
| A | 0 | 14 | 0 |
| B | 0 | 14 | 0 |
| C | 0 | 14 | 0 |
| D | 0 | 14 | 0 |
| Quadrant | Total seconds | Saturated seconds | Saturation percentage |
|---|---|---|---|
| A | 6542 | 41 | 0.626720% |
| B | 6542 | 241 | 3.683889% |
| C | 6542 | 173 | 2.644451% |
| D | 6543 | 357 | 5.456213% |
Noise dominated data is calculated using 1-second bins in cleaned event files. If a bin has >2000 counts, and if more than 50% of those come from <1% of pixels, then it is considered to be noise-dominated and hence unusable.
| Quadrant | # 1 sec bins | Bins with >0 counts | Bins with >2000 counts | High rate bins dominated by noise | Noise dominated (total time) | Noise dominated (detector-on time) | Marked lightcurve |
|---|---|---|---|---|---|---|---|
| A | 7867 | 6543 | 0 | 0 | 0.00% | 0.00% | 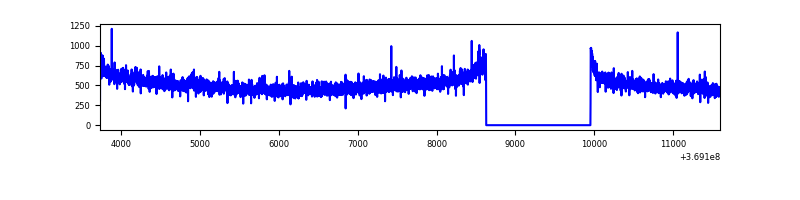 |
| B | 7867 | 6543 | 53 | 53 | 0.67% | 0.81% | 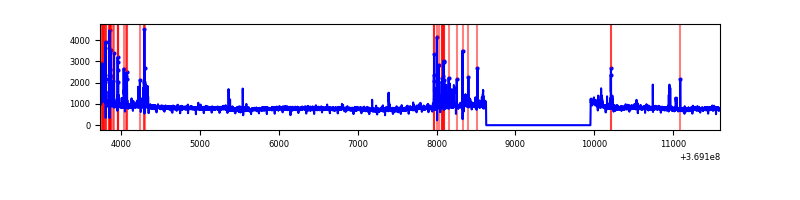 |
| C | 7867 | 6543 | 11 | 11 | 0.14% | 0.17% |  |
| D | 7868 | 6544 | 259 | 259 | 3.29% | 3.96% | 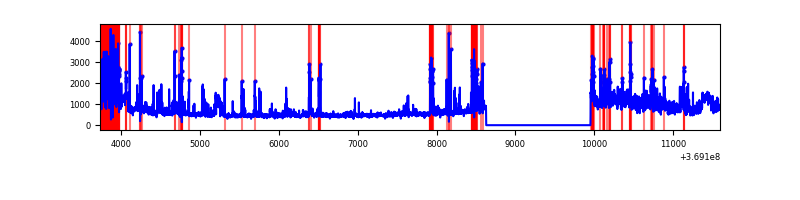 |
Top three noisy pixels from each quadrant. If the there are fewer than three noisy pixels in the level2.evt file, extra rows are filled as -1
| Pixel properties | Quadrant properties | ||||||
|---|---|---|---|---|---|---|---|
| Quadrant | DetID | PixID | Counts | Sigma | Mean | Median | Sigma |
| A | 12 | 189 | 36550 | 213.29 | 848 | 834 | 167.5 |
| A | 13 | 254 | 12246 | 68.15 | 848 | 834 | 167.5 |
| A | 15 | 174 | 8864 | 47.95 | 848 | 834 | 167.5 |
| B | 6 | 159 | 1881488 | 11975.52 | 845 | 828 | 157.0 |
| B | 5 | 172 | 206251 | 1308.08 | 845 | 828 | 157.0 |
| B | 0 | 229 | 67432 | 424.12 | 845 | 828 | 157.0 |
| C | 14 | 238 | 147370 | 761.3 | 828 | 834 | 192.5 |
| C | 0 | 10 | 71051 | 364.8 | 828 | 834 | 192.5 |
| C | 4 | 175 | 49069 | 250.6 | 828 | 834 | 192.5 |
| D | 8 | 195 | 663845 | 3511.77 | 796 | 777 | 188.8 |
| D | 5 | 172 | 493670 | 2610.48 | 796 | 777 | 188.8 |
| D | 13 | 249 | 395002 | 2087.91 | 796 | 777 | 188.8 |
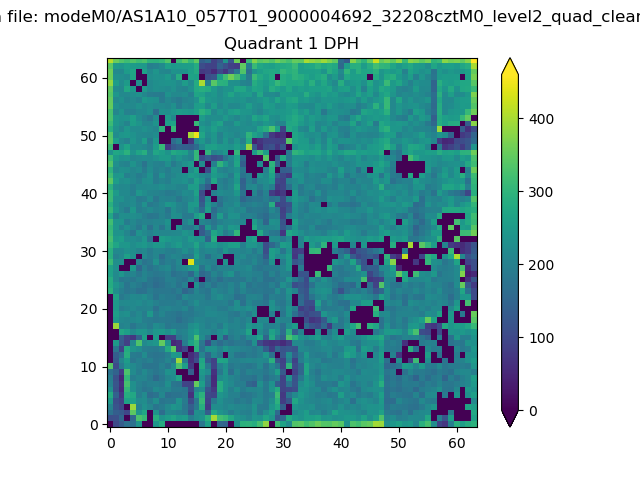
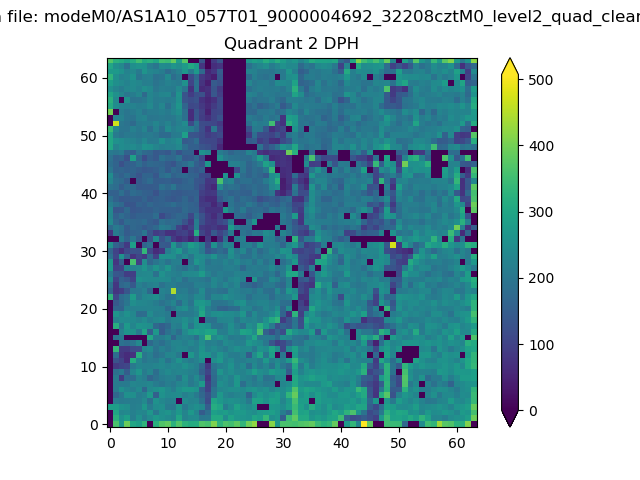
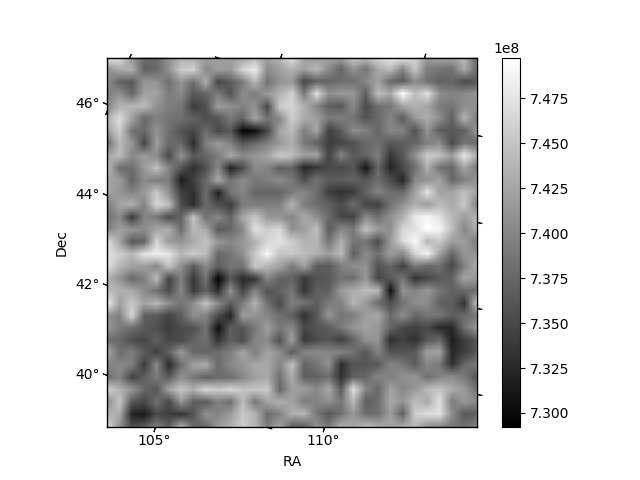
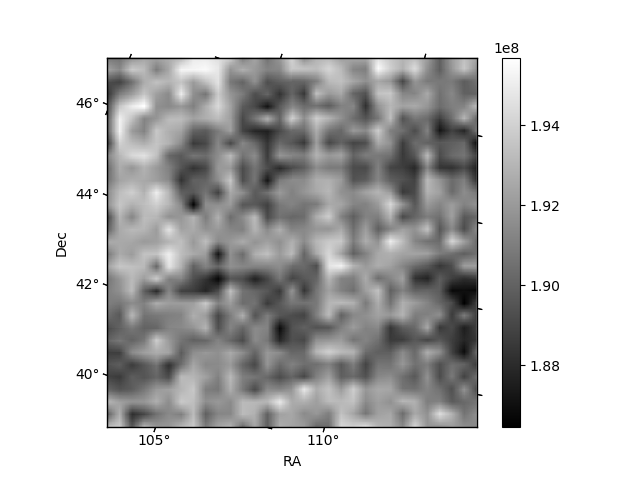
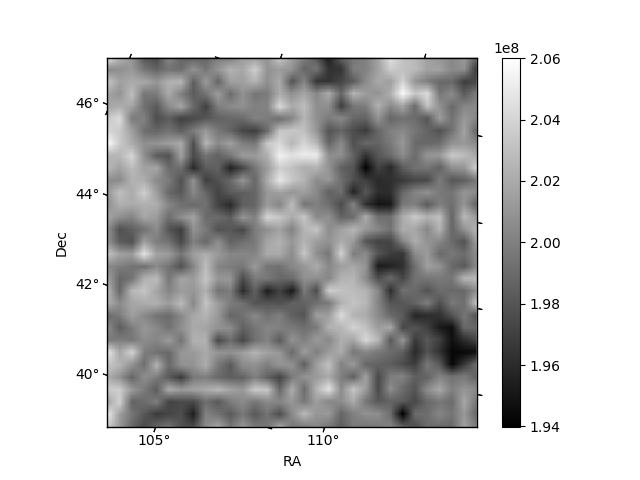
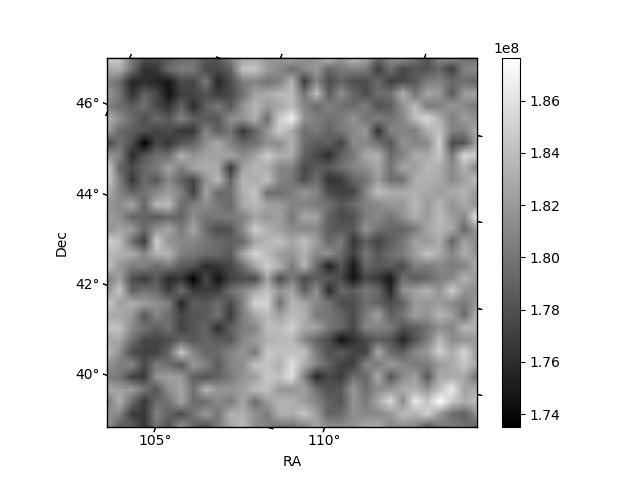
Histogram calculated using DETX and DETY for each event in the final _common_clean file
| Quadrant A | 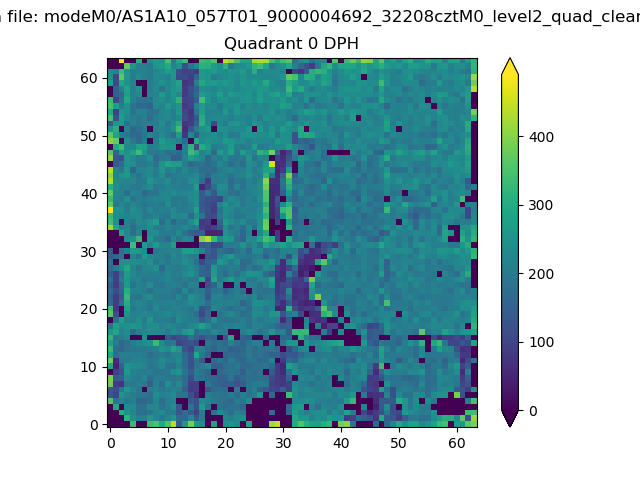 |
 |
Quadrant B |
|---|---|---|---|
| Quadrant D | 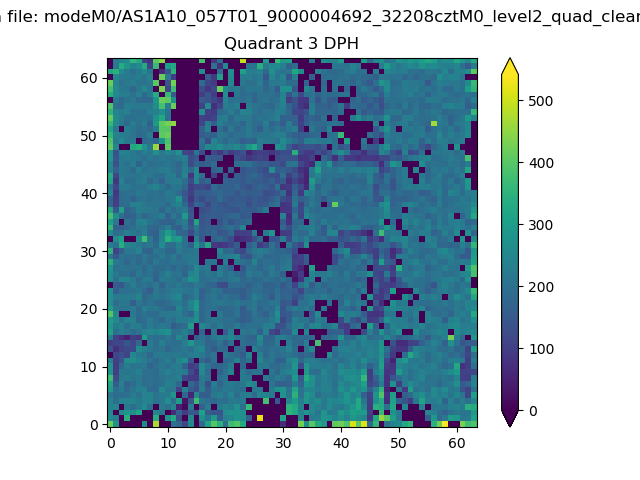 |
 |
Quadrant C |
| Plot type | Count rate plots | Images |
|---|---|---|
| Comparison with Poisson distribution Blue bars denote a histogram of data divided into 1 sec bins. Red curve is a Poisson curve with rate = median count rate of data. |
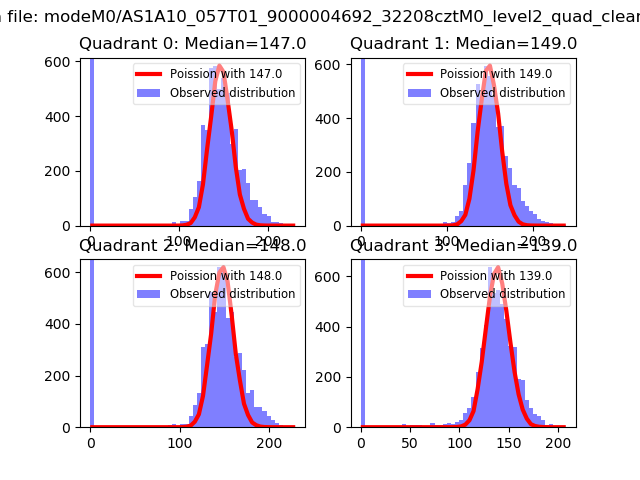 |
 |
| Quadrant-wise count rates Data is divided into 100 sec bins |
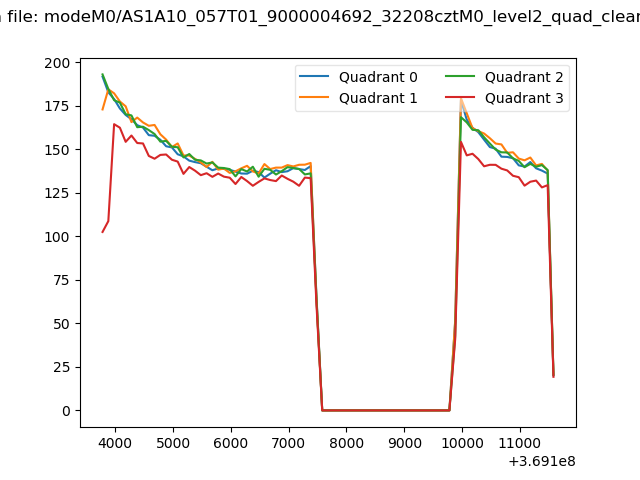 |
|
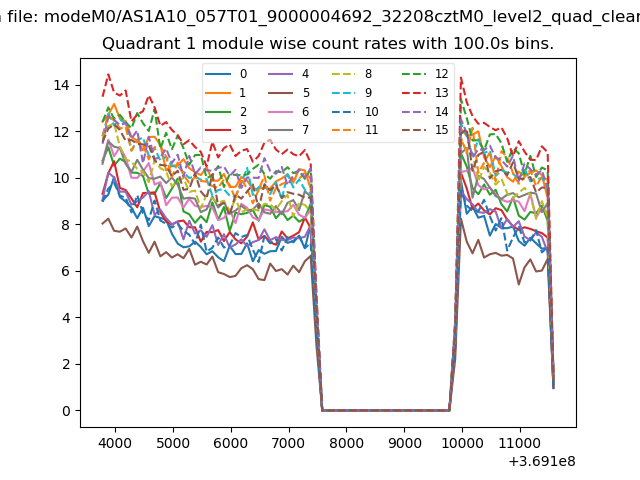
| Module-wise count rates for Quadrant A Data is divided into 100 sec bins |
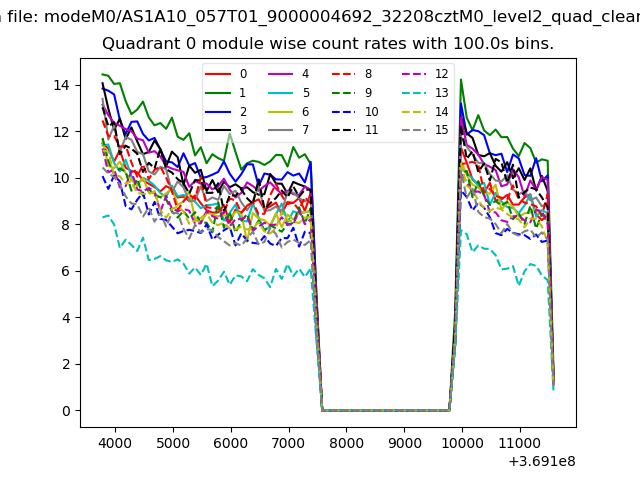 |
 |
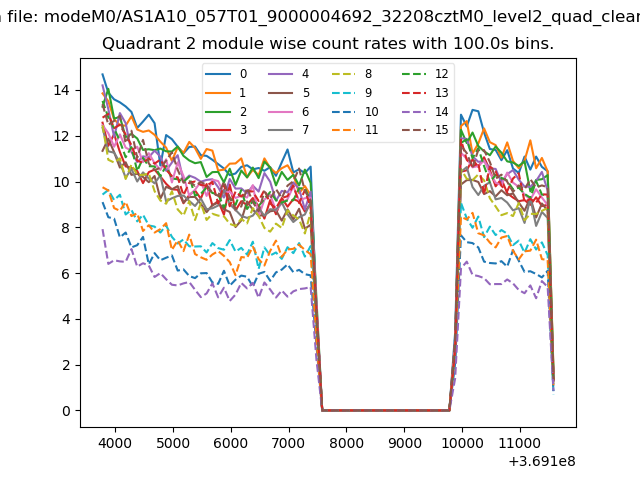
| Module-wise count rates for Quadrant B Data is divided into 100 sec bins |
 |
 |
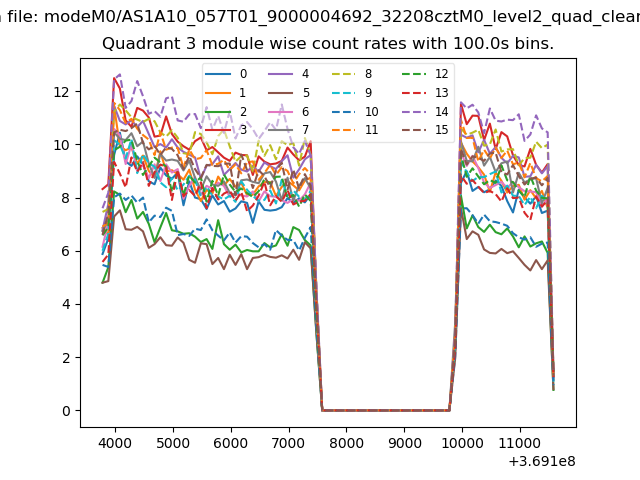
| Module-wise count rates for Quadrant C Data is divided into 100 sec bins |
 |
 |
| Module-wise count rates for Quadrant D Data is divided into 100 sec bins |
 |
 |
| Parameter | Plot |
|---|---|
| CZT HV Monitor |  |
| D_VDD | 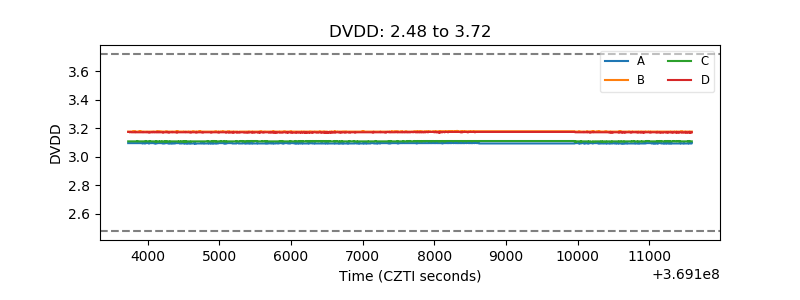 |
| Temperature 1 | 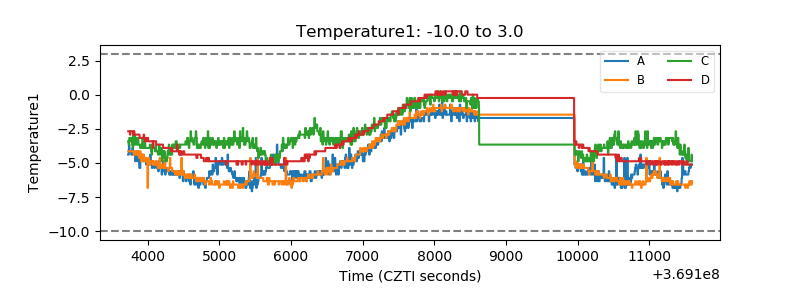 |
| Veto HV Monitor | 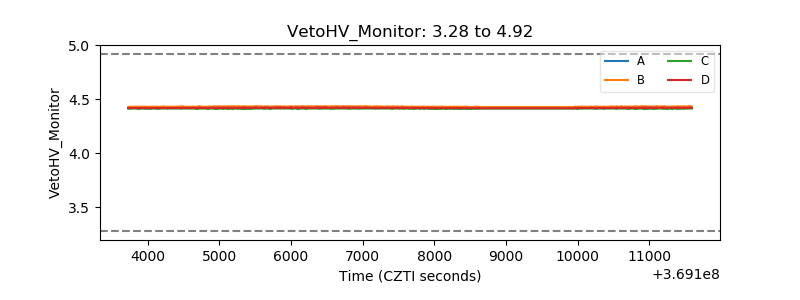 |
| Veto LLD | 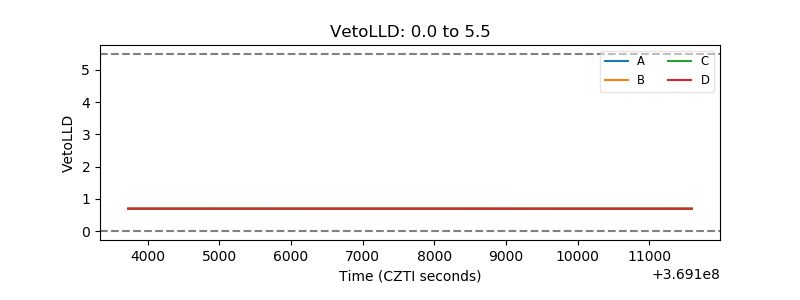 |
| Alpha Counter | 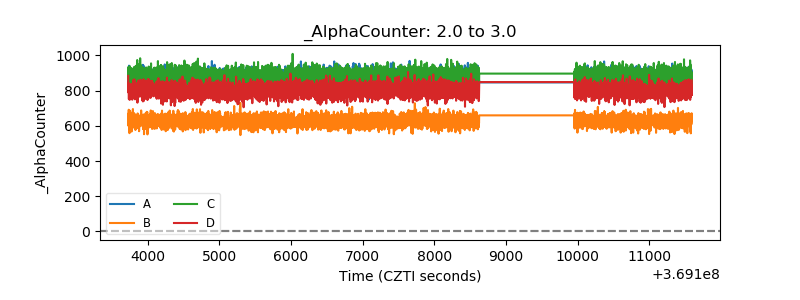 |
| _CPM_Rate | 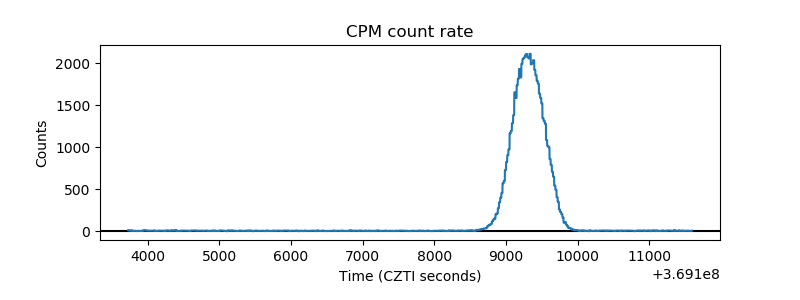 |
| CZT Counter | 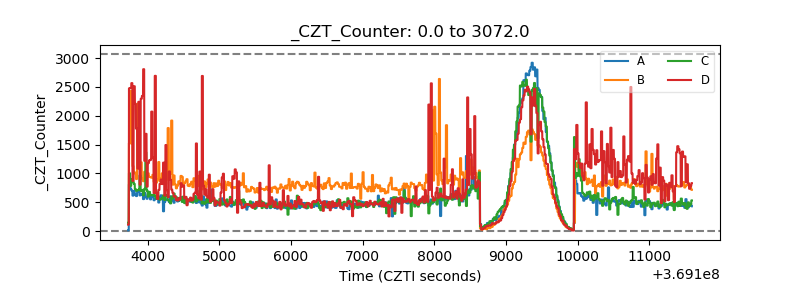 |
| +2.5 Volts monitor |  |
| +5 Volts monitor |  |
| _ROLL_ROT | 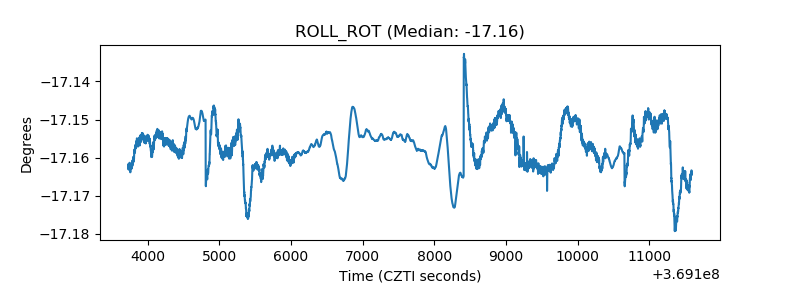 |
| _Roll_DEC | 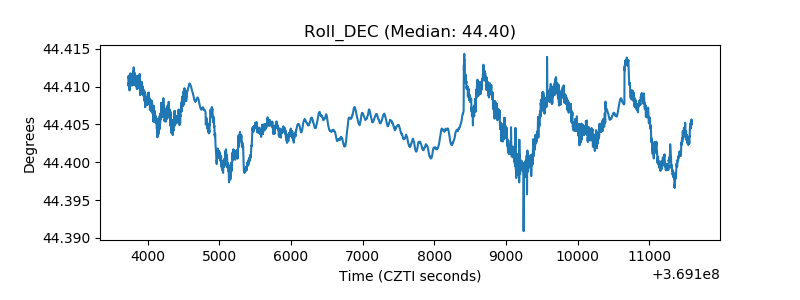 |
| _Roll_RA | 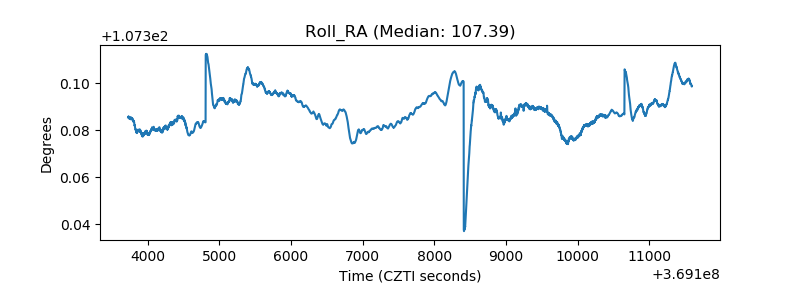 |
| Veto Counter | 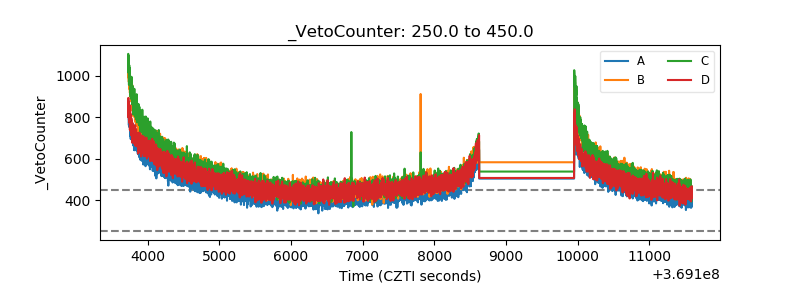 |