| Param | Original file | Final file |
|---|---|---|
| Filename | modeM0/AS1A10_057T01_9000004692_32210cztM0_level2.evt | modeM0/AS1A10_057T01_9000004692_32210cztM0_level2_quad_clean.evt |
| Size (bytes) | 1,097,542,080 | 145,460,160 |
| Size | 1.0 GB | 138.7 MB |
| Events in quadrant A | 5,327,422 | 935,290 |
| Events in quadrant B | 8,616,371 | 943,679 |
| Events in quadrant C | 5,910,197 | 923,775 |
| Events in quadrant D | 12,656,649 | 853,636 |
| Mode M0 | |||
|---|---|---|---|
| Quadrant | BADHDUFLAG | Total packets | Discarded packets |
| A | 0 | 22980 | 3 |
| B | 0 | 33522 | 2 |
| C | 0 | 24536 | 2 |
| D | 0 | 45295 | 2 |
| Mode SS | |||
|---|---|---|---|
| Quadrant | BADHDUFLAG | Total packets | Discarded packets |
| A | 0 | 220 | 0 |
| B | 0 | 220 | 0 |
| C | 0 | 220 | 0 |
| D | 0 | 220 | 0 |
| Mode M9 | |||
|---|---|---|---|
| Quadrant | BADHDUFLAG | Total packets | Discarded packets |
| A | 0 | 20 | 0 |
| B | 0 | 20 | 0 |
| C | 0 | 20 | 0 |
| D | 0 | 20 | 0 |
| Quadrant | Total seconds | Saturated seconds | Saturation percentage |
|---|---|---|---|
| A | 10815 | 79 | 0.730467% |
| B | 10815 | 263 | 2.431808% |
| C | 10815 | 876 | 8.099861% |
| D | 10815 | 1408 | 13.018955% |
Noise dominated data is calculated using 1-second bins in cleaned event files. If a bin has >2000 counts, and if more than 50% of those come from <1% of pixels, then it is considered to be noise-dominated and hence unusable.
| Quadrant | # 1 sec bins | Bins with >0 counts | Bins with >2000 counts | High rate bins dominated by noise | Noise dominated (total time) | Noise dominated (detector-on time) | Marked lightcurve |
|---|---|---|---|---|---|---|---|
| A | 12760 | 10818 | 0 | 0 | 0.00% | 0.00% |  |
| B | 12760 | 10818 | 15 | 15 | 0.12% | 0.14% |  |
| C | 12760 | 10818 | 38 | 38 | 0.30% | 0.35% | 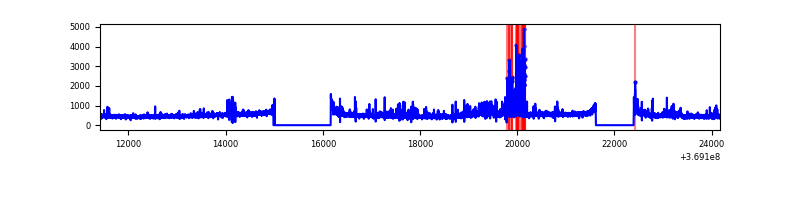 |
| D | 12760 | 10818 | 901 | 901 | 7.06% | 8.33% | 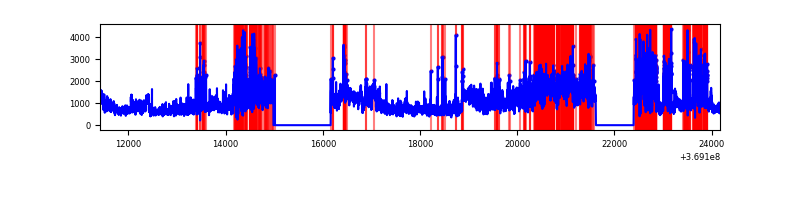 |
Top three noisy pixels from each quadrant. If the there are fewer than three noisy pixels in the level2.evt file, extra rows are filled as -1
| Pixel properties | Quadrant properties | ||||||
|---|---|---|---|---|---|---|---|
| Quadrant | DetID | PixID | Counts | Sigma | Mean | Median | Sigma |
| A | 12 | 189 | 101813 | 382.79 | 1327 | 1304 | 262.6 |
| A | 0 | 6 | 83052 | 311.34 | 1327 | 1304 | 262.6 |
| A | 13 | 254 | 19443 | 69.08 | 1327 | 1304 | 262.6 |
| B | 6 | 159 | 3096894 | 12574.09 | 1316 | 1284 | 246.2 |
| B | 0 | 190 | 108696 | 436.3 | 1316 | 1284 | 246.2 |
| B | 0 | 229 | 83072 | 332.22 | 1316 | 1284 | 246.2 |
| C | 14 | 238 | 421317 | 1454.57 | 1242 | 1252 | 288.8 |
| C | 14 | 254 | 299793 | 1033.76 | 1242 | 1252 | 288.8 |
| C | 0 | 207 | 187229 | 643.99 | 1242 | 1252 | 288.8 |
| D | 5 | 172 | 3384274 | 11592.48 | 1232 | 1200 | 291.8 |
| D | 8 | 195 | 2631583 | 9013.3 | 1232 | 1200 | 291.8 |
| D | 2 | 250 | 1385961 | 4745.04 | 1232 | 1200 | 291.8 |
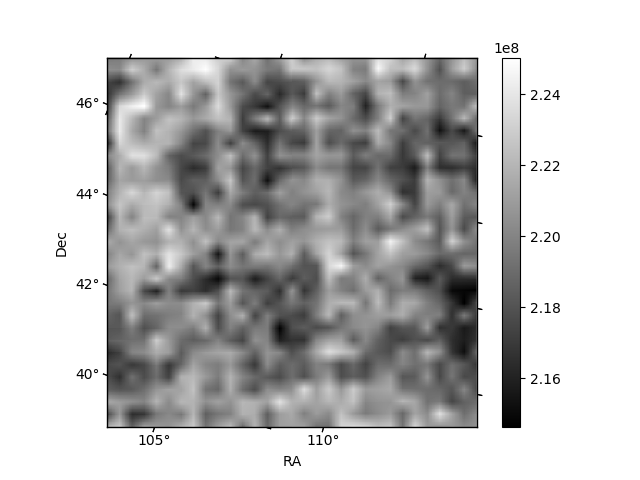
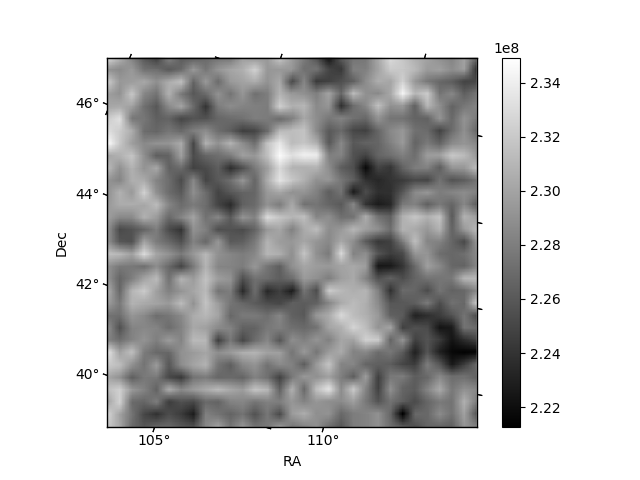
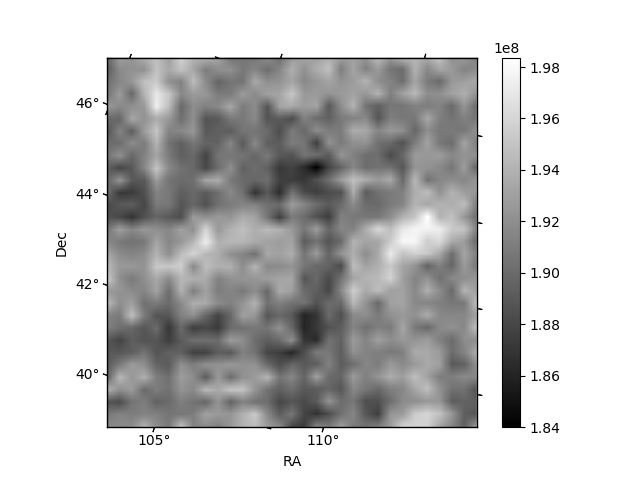
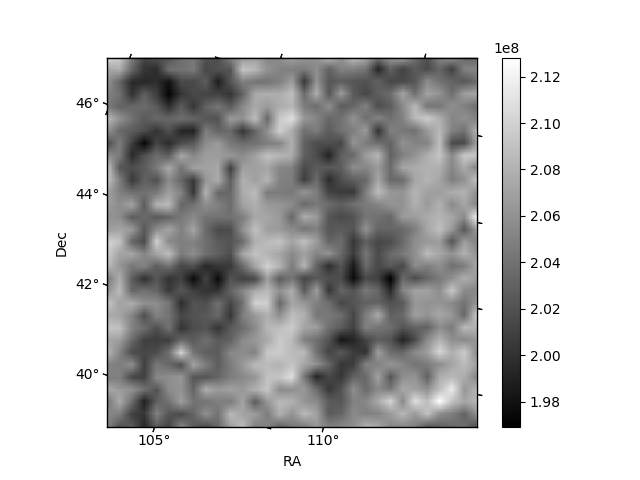
Histogram calculated using DETX and DETY for each event in the final _common_clean file
| Quadrant A | 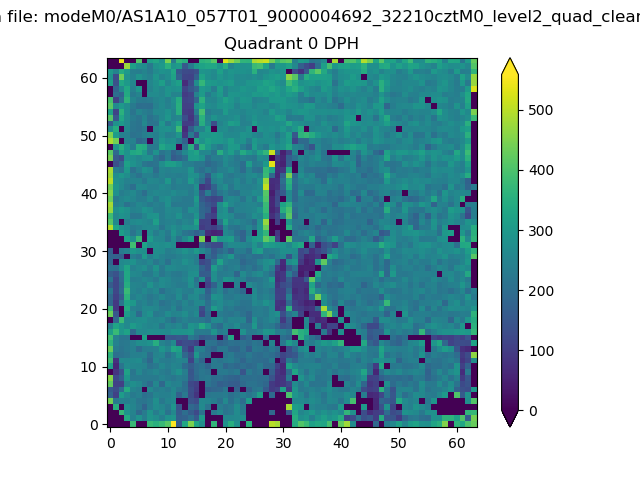 |
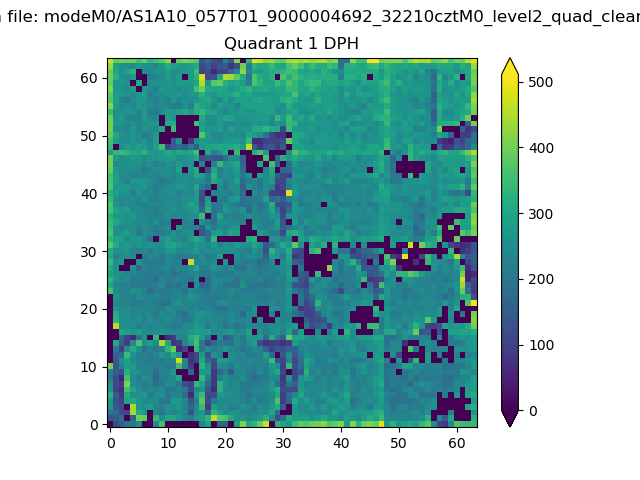 |
Quadrant B |
|---|---|---|---|
| Quadrant D |  |
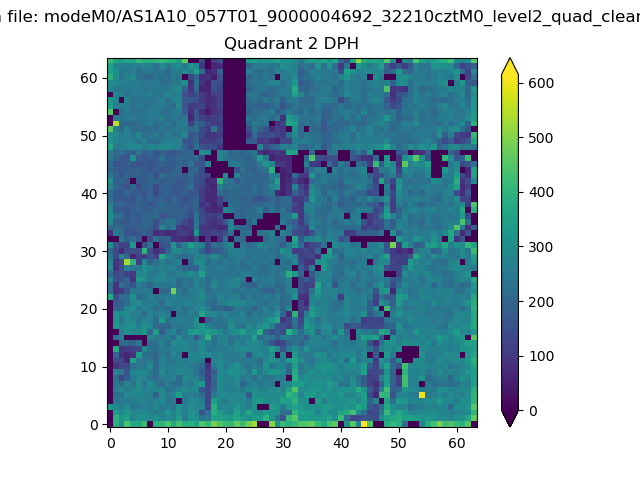 |
Quadrant C |
| Plot type | Count rate plots | Images |
|---|---|---|
| Comparison with Poisson distribution Blue bars denote a histogram of data divided into 1 sec bins. Red curve is a Poisson curve with rate = median count rate of data. |
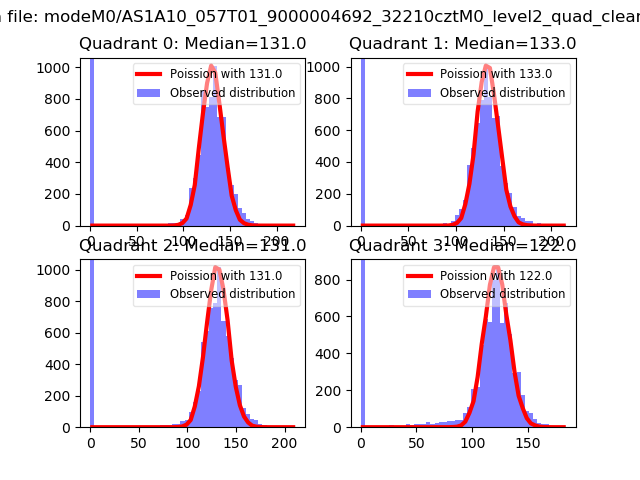 |
 |
| Quadrant-wise count rates Data is divided into 100 sec bins |
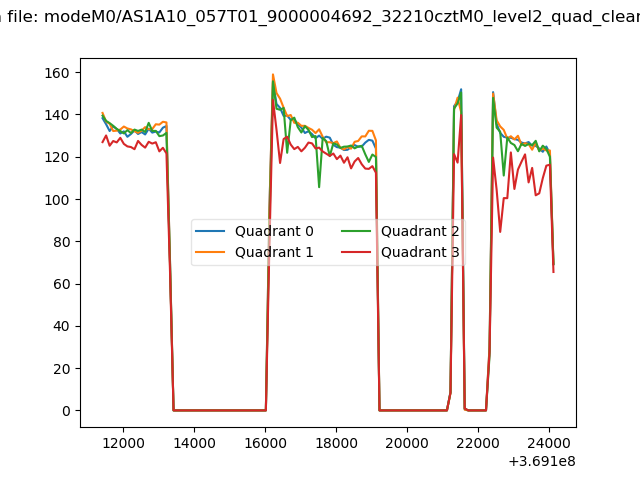 |
|
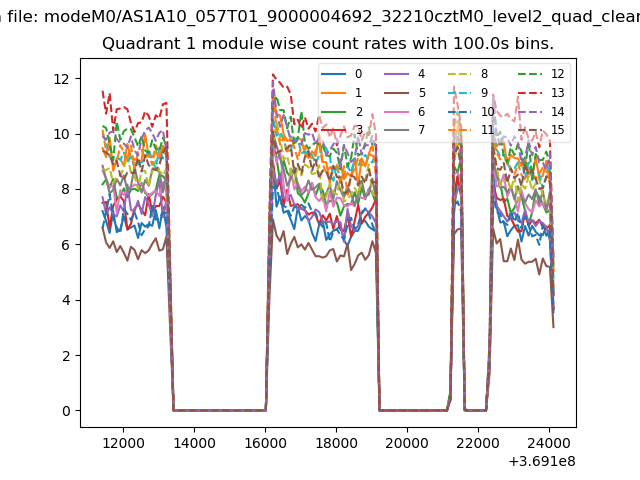
| Module-wise count rates for Quadrant A Data is divided into 100 sec bins |
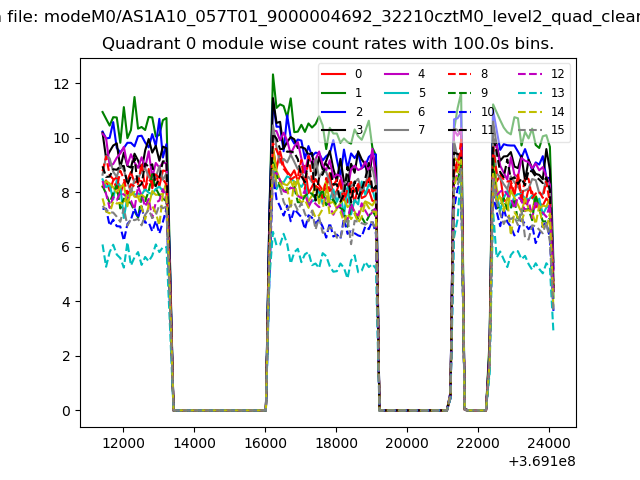 |
 |
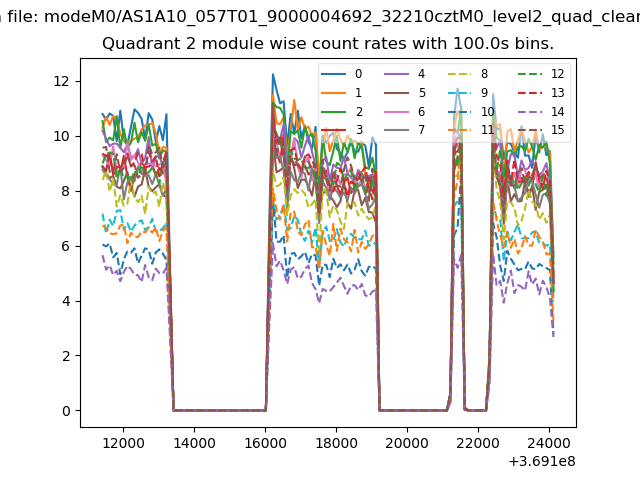
| Module-wise count rates for Quadrant B Data is divided into 100 sec bins |
 |
 |
| Module-wise count rates for Quadrant C Data is divided into 100 sec bins |
 |
 |
| Module-wise count rates for Quadrant D Data is divided into 100 sec bins |
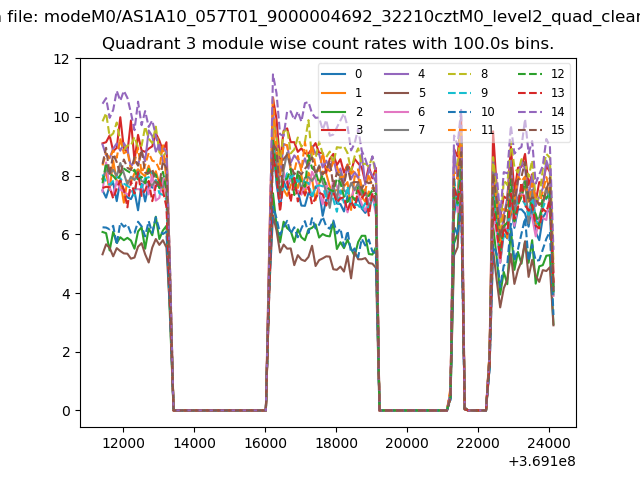 |
 |
| Parameter | Plot |
|---|---|
| CZT HV Monitor | 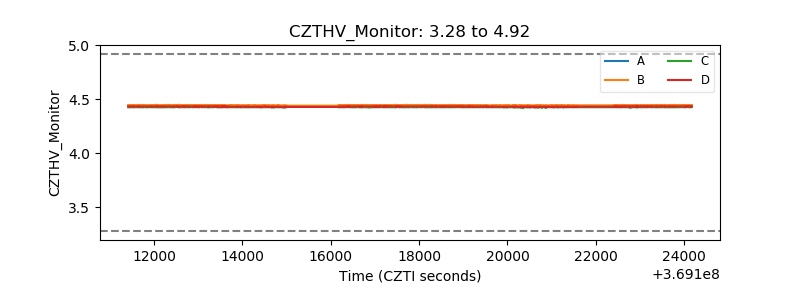 |
| D_VDD | 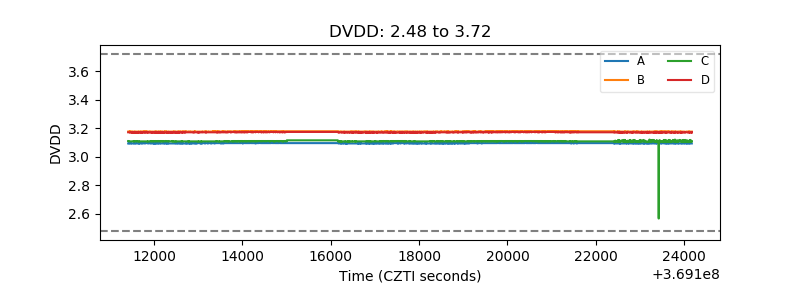 |
| Temperature 1 | 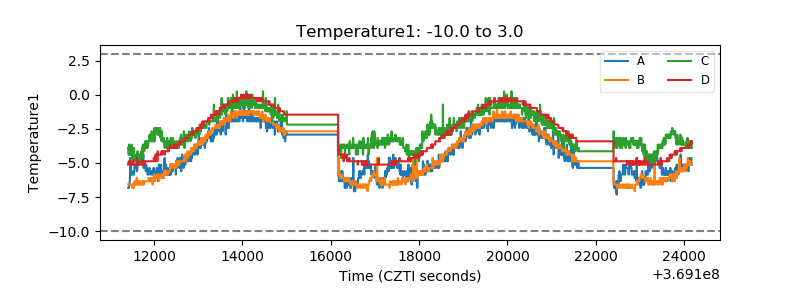 |
| Veto HV Monitor |  |
| Veto LLD |  |
| Alpha Counter | 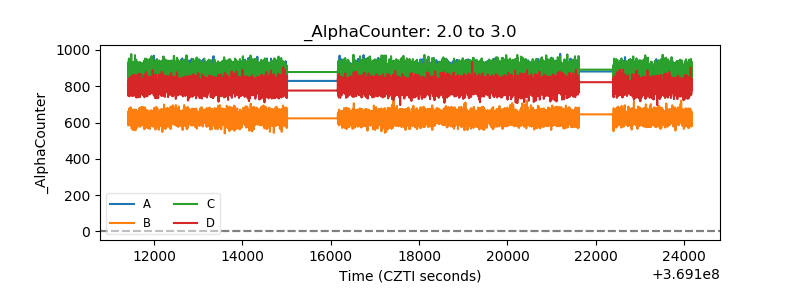 |
| _CPM_Rate | 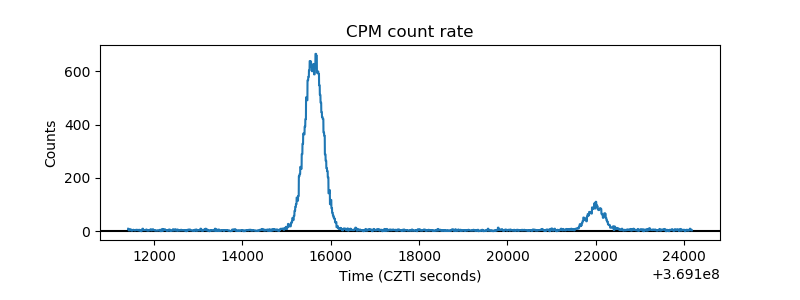 |
| CZT Counter | 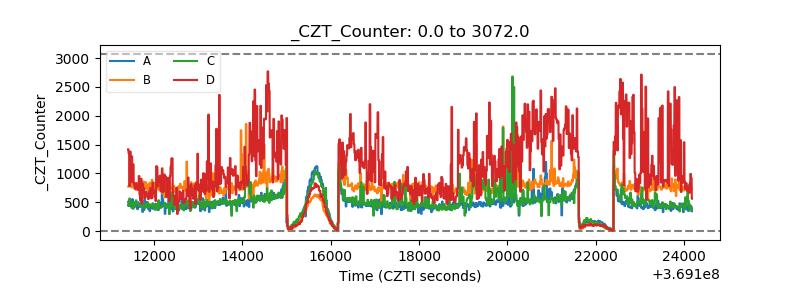 |
| +2.5 Volts monitor |  |
| +5 Volts monitor |  |
| _ROLL_ROT | 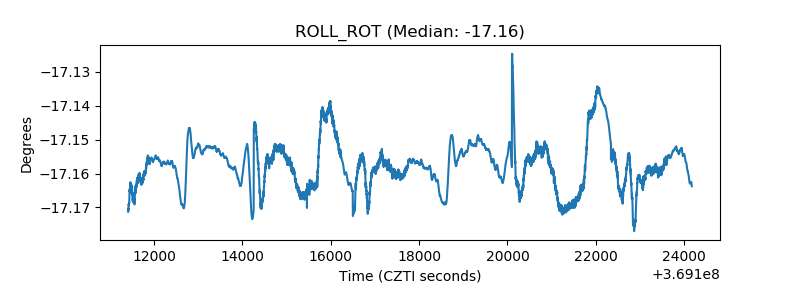 |
| _Roll_DEC | 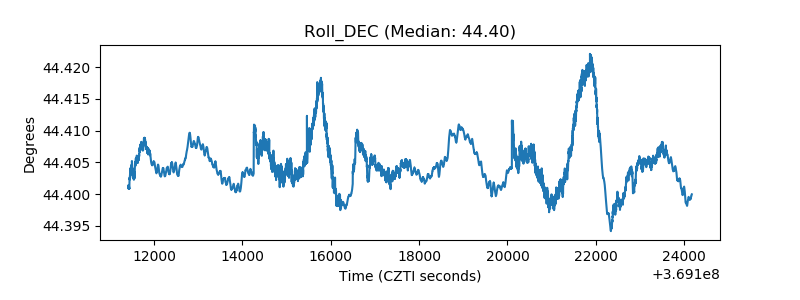 |
| _Roll_RA | 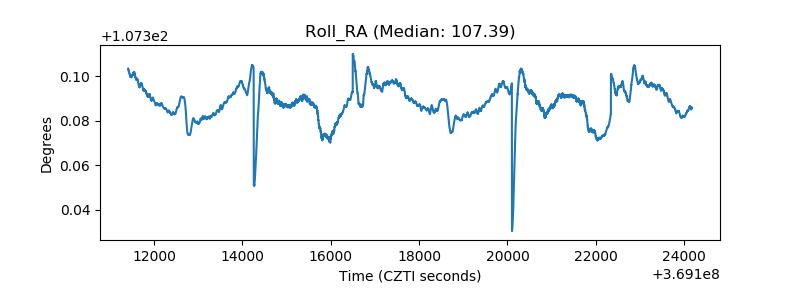 |
| Veto Counter | 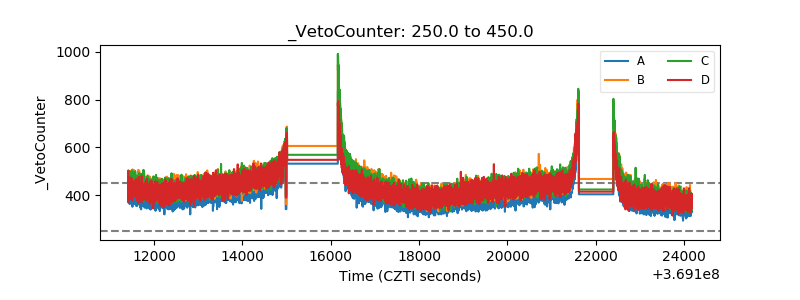 |