| Param | Original file | Final file |
|---|---|---|
| Filename | modeM0/AS1A10_057T01_9000004692_32211cztM0_level2.evt | modeM0/AS1A10_057T01_9000004692_32211cztM0_level2_quad_clean.evt |
| Size (bytes) | 674,498,880 | 98,801,280 |
| Size | 643.3 MB | 94.2 MB |
| Events in quadrant A | 3,467,812 | 641,918 |
| Events in quadrant B | 5,445,137 | 639,862 |
| Events in quadrant C | 3,575,853 | 633,538 |
| Events in quadrant D | 7,457,951 | 581,247 |
| Mode M0 | |||
|---|---|---|---|
| Quadrant | BADHDUFLAG | Total packets | Discarded packets |
| A | 0 | 14880 | 2 |
| B | 0 | 21762 | 1 |
| C | 0 | 15129 | 1 |
| D | 0 | 27107 | 1 |
| Mode SS | |||
|---|---|---|---|
| Quadrant | BADHDUFLAG | Total packets | Discarded packets |
| A | 0 | 144 | 0 |
| B | 0 | 144 | 0 |
| C | 0 | 144 | 0 |
| D | 0 | 144 | 0 |
| Mode M9 | |||
|---|---|---|---|
| Quadrant | BADHDUFLAG | Total packets | Discarded packets |
| A | 0 | 3 | 0 |
| B | 0 | 3 | 0 |
| C | 0 | 3 | 0 |
| D | 0 | 3 | 0 |
| Quadrant | Total seconds | Saturated seconds | Saturation percentage |
|---|---|---|---|
| A | 7111 | 119 | 1.673464% |
| B | 7111 | 214 | 3.009422% |
| C | 7111 | 237 | 3.332865% |
| D | 7111 | 778 | 10.940796% |
Noise dominated data is calculated using 1-second bins in cleaned event files. If a bin has >2000 counts, and if more than 50% of those come from <1% of pixels, then it is considered to be noise-dominated and hence unusable.
| Quadrant | # 1 sec bins | Bins with >0 counts | Bins with >2000 counts | High rate bins dominated by noise | Noise dominated (total time) | Noise dominated (detector-on time) | Marked lightcurve |
|---|---|---|---|---|---|---|---|
| A | 7376 | 7112 | 0 | 0 | 0.00% | 0.00% | 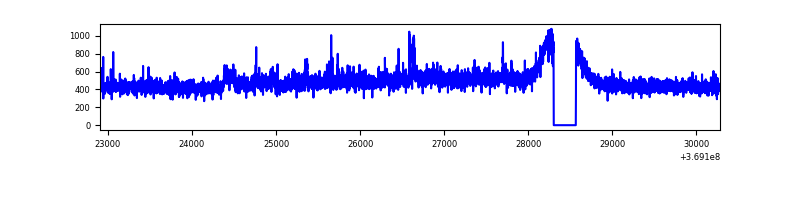 |
| B | 7376 | 7112 | 8 | 8 | 0.11% | 0.11% | 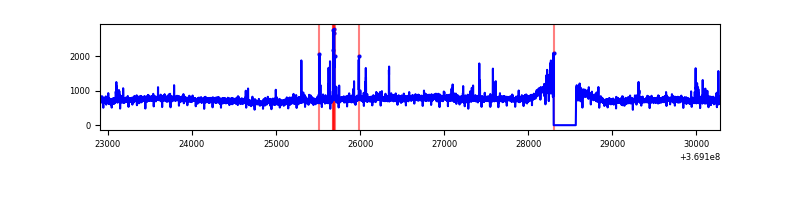 |
| C | 7376 | 7112 | 2 | 2 | 0.03% | 0.03% | 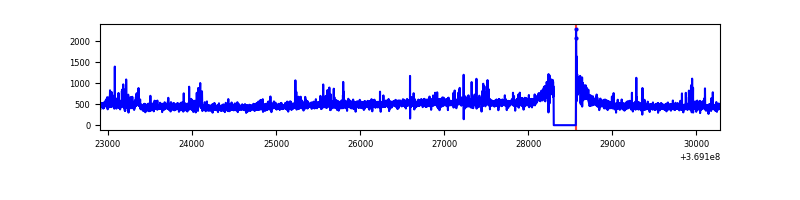 |
| D | 7376 | 7112 | 554 | 554 | 7.51% | 7.79% | 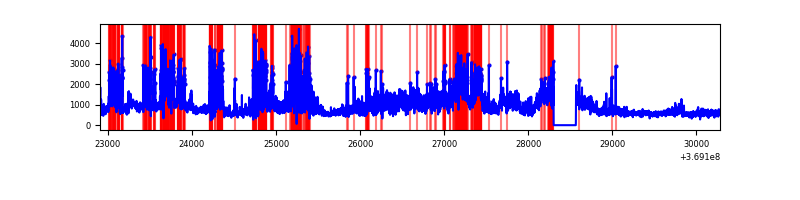 |
Top three noisy pixels from each quadrant. If the there are fewer than three noisy pixels in the level2.evt file, extra rows are filled as -1
| Pixel properties | Quadrant properties | ||||||
|---|---|---|---|---|---|---|---|
| Quadrant | DetID | PixID | Counts | Sigma | Mean | Median | Sigma |
| A | 12 | 189 | 72381 | 410.75 | 862 | 843 | 174.2 |
| A | 0 | 230 | 42978 | 241.93 | 862 | 843 | 174.2 |
| A | 13 | 254 | 13491 | 72.62 | 862 | 843 | 174.2 |
| B | 6 | 159 | 1916103 | 11759.06 | 849 | 825 | 162.9 |
| B | 5 | 172 | 43239 | 260.41 | 849 | 825 | 162.9 |
| B | 12 | 18 | 42235 | 254.24 | 849 | 825 | 162.9 |
| C | 14 | 238 | 175567 | 899.4 | 821 | 826 | 194.3 |
| C | 14 | 254 | 59097 | 299.92 | 821 | 826 | 194.3 |
| C | 3 | 233 | 41062 | 207.09 | 821 | 826 | 194.3 |
| D | 5 | 172 | 1736617 | 9097.21 | 800 | 778 | 190.8 |
| D | 2 | 250 | 1091540 | 5716.48 | 800 | 778 | 190.8 |
| D | 12 | 233 | 829263 | 4341.94 | 800 | 778 | 190.8 |
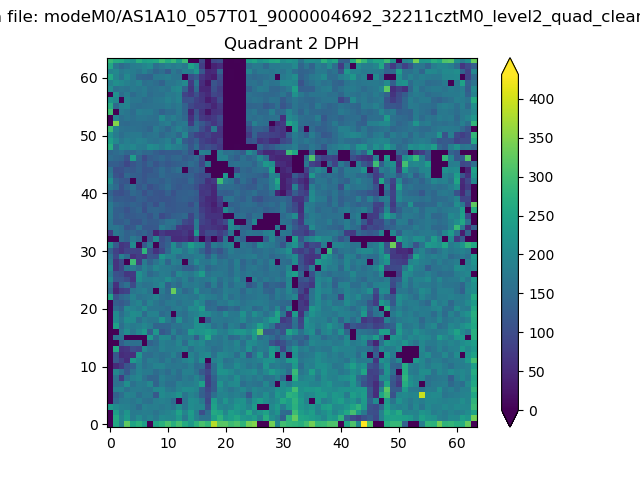
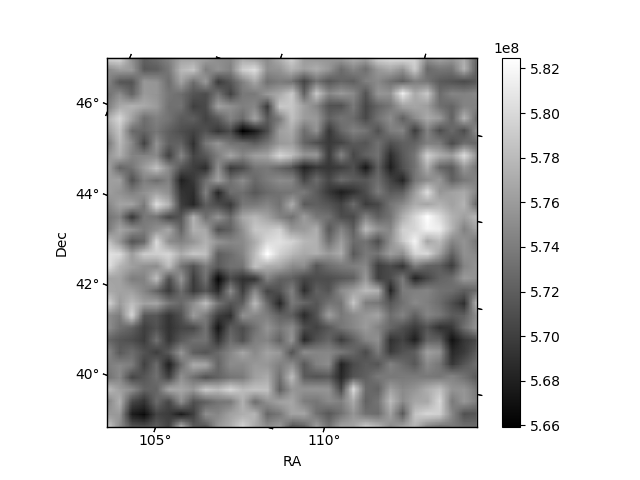
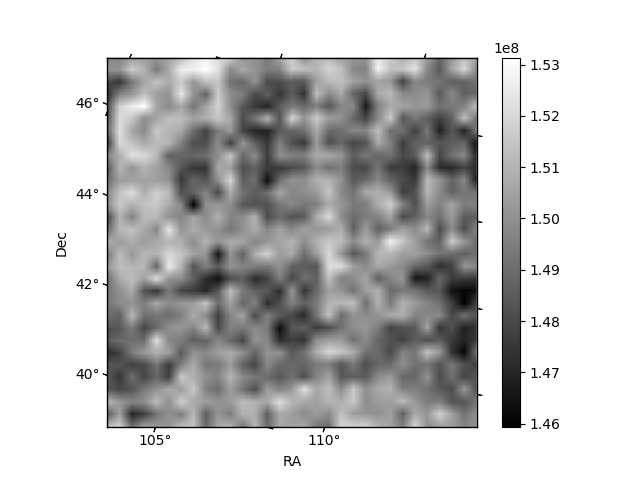
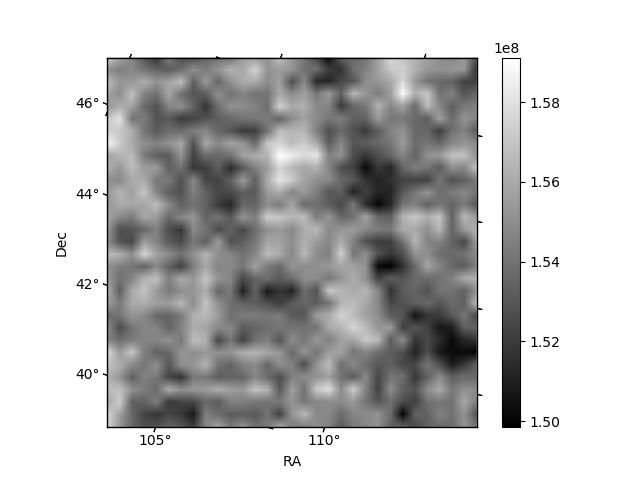
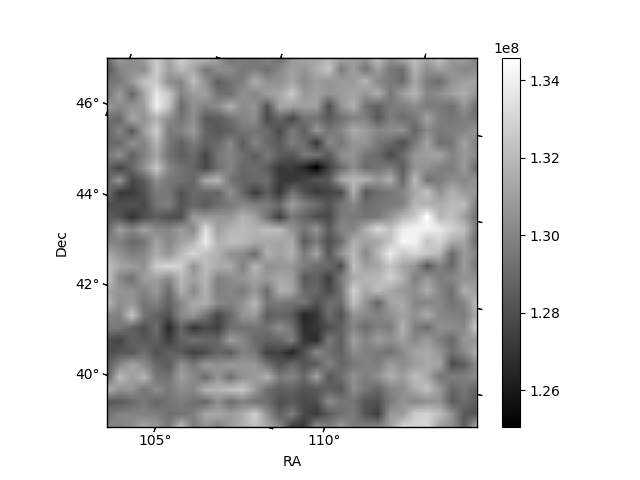
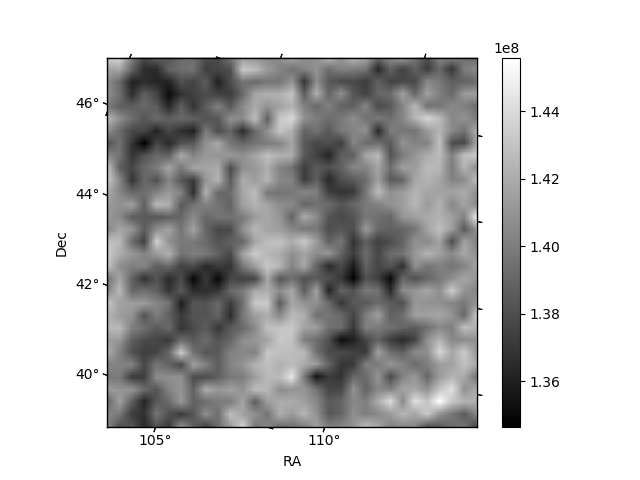
Histogram calculated using DETX and DETY for each event in the final _common_clean file
| Quadrant A | 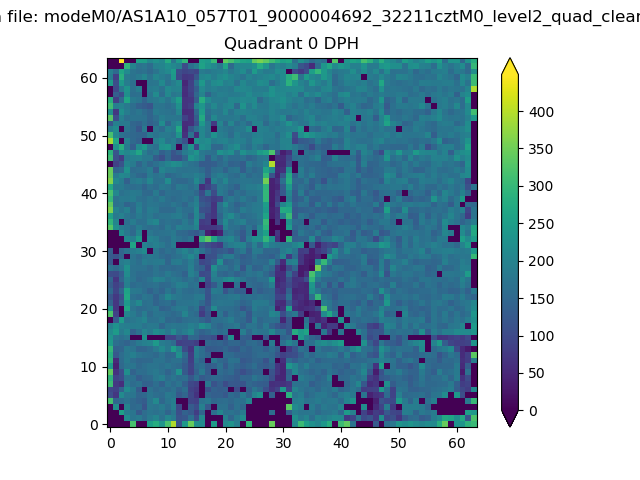 |
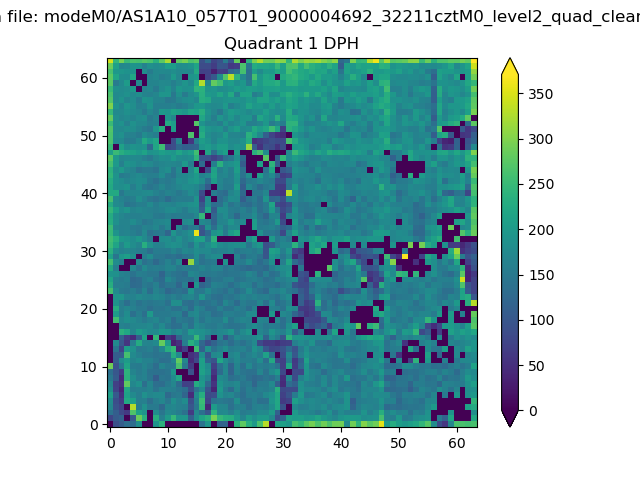 |
Quadrant B |
|---|---|---|---|
| Quadrant D | 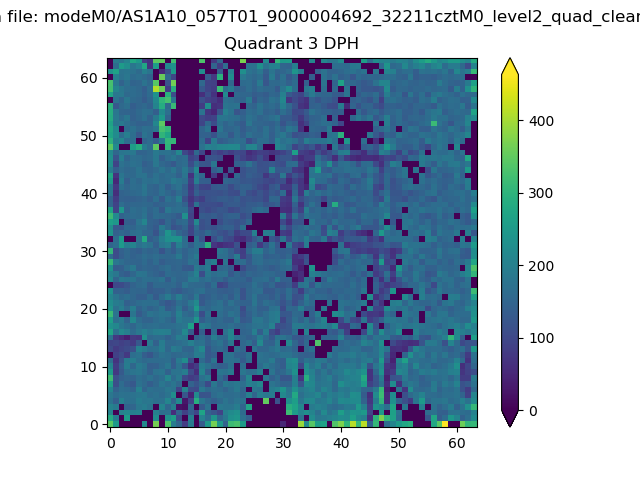 |
 |
Quadrant C |
| Plot type | Count rate plots | Images |
|---|---|---|
| Comparison with Poisson distribution Blue bars denote a histogram of data divided into 1 sec bins. Red curve is a Poisson curve with rate = median count rate of data. |
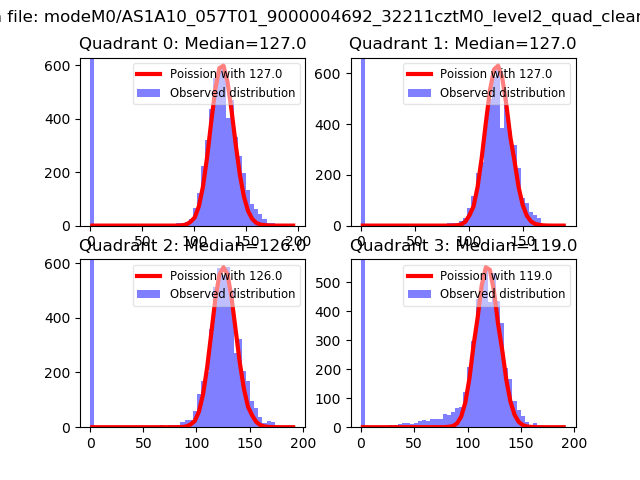 |
 |
| Quadrant-wise count rates Data is divided into 100 sec bins |
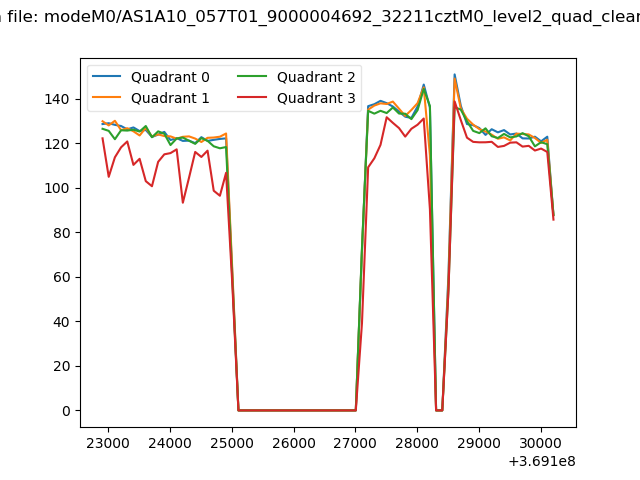 |
|
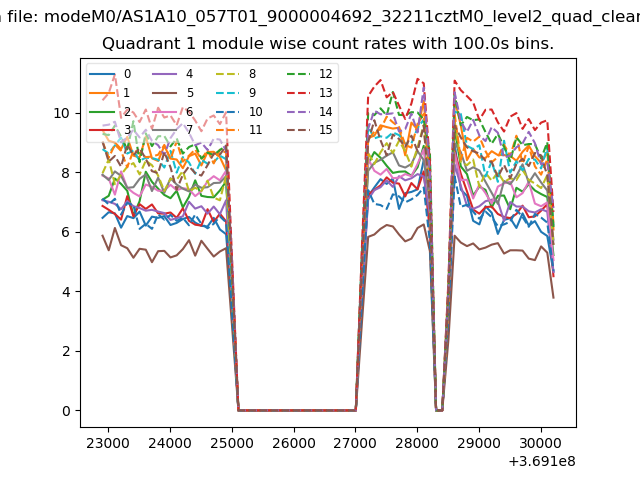
| Module-wise count rates for Quadrant A Data is divided into 100 sec bins |
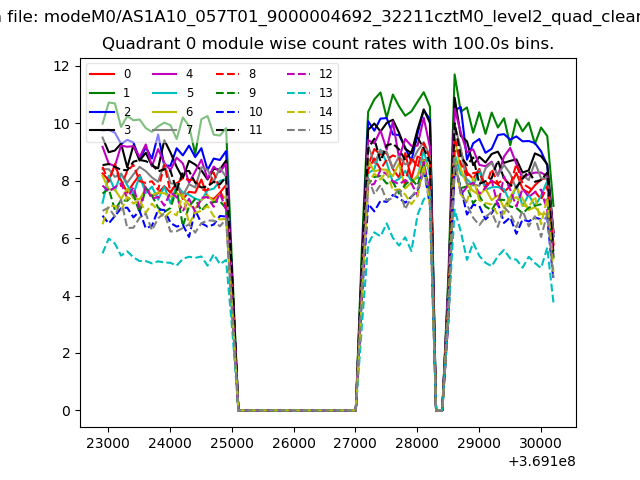 |
 |
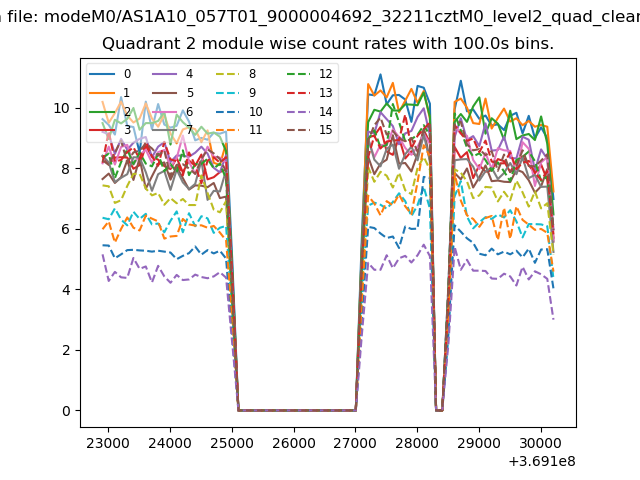
| Module-wise count rates for Quadrant B Data is divided into 100 sec bins |
 |
 |
| Module-wise count rates for Quadrant C Data is divided into 100 sec bins |
 |
 |
| Module-wise count rates for Quadrant D Data is divided into 100 sec bins |
 |
 |
| Parameter | Plot |
|---|---|
| CZT HV Monitor | 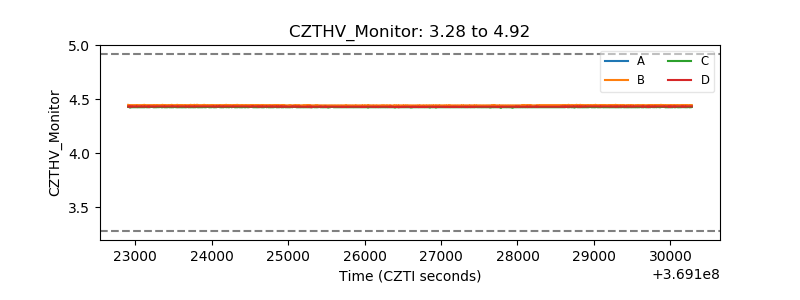 |
| D_VDD | 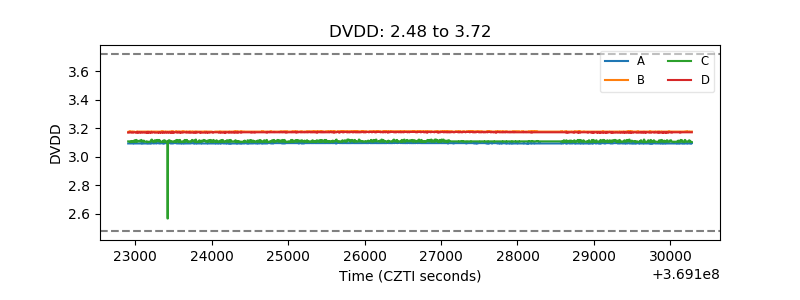 |
| Temperature 1 |  |
| Veto HV Monitor | 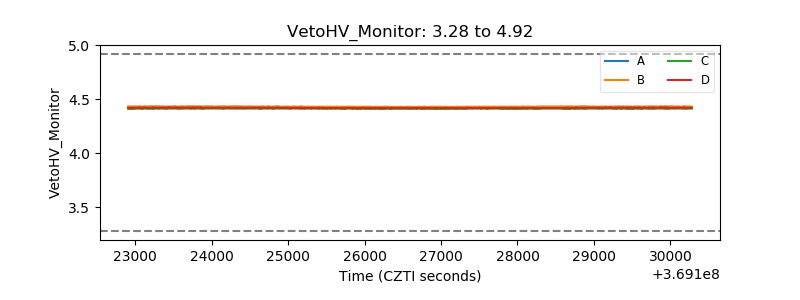 |
| Veto LLD | 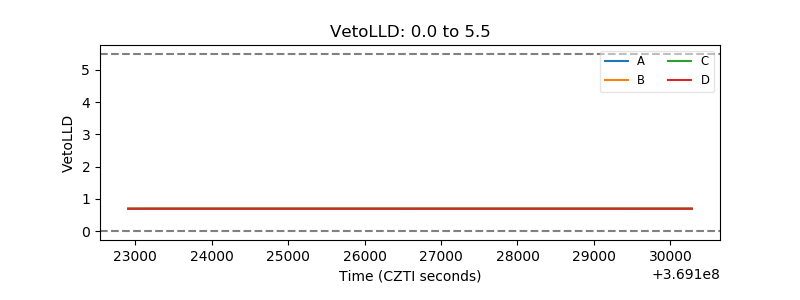 |
| Alpha Counter | 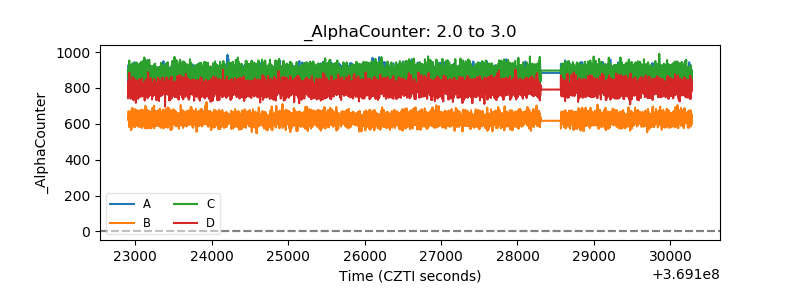 |
| _CPM_Rate | 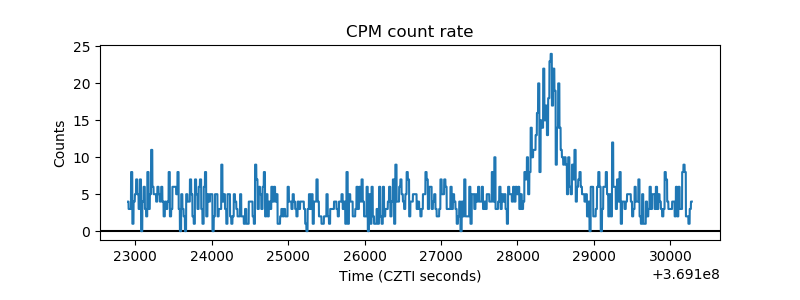 |
| CZT Counter | 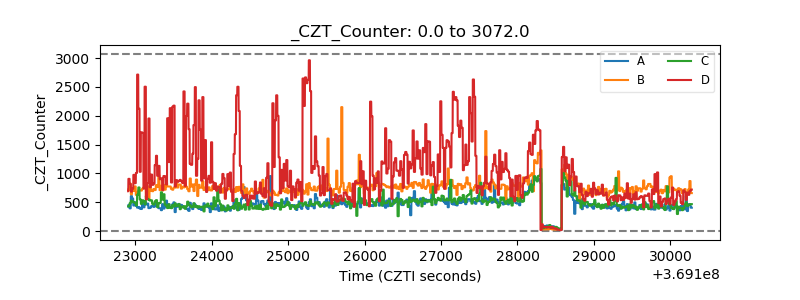 |
| +2.5 Volts monitor |  |
| +5 Volts monitor |  |
| _ROLL_ROT | 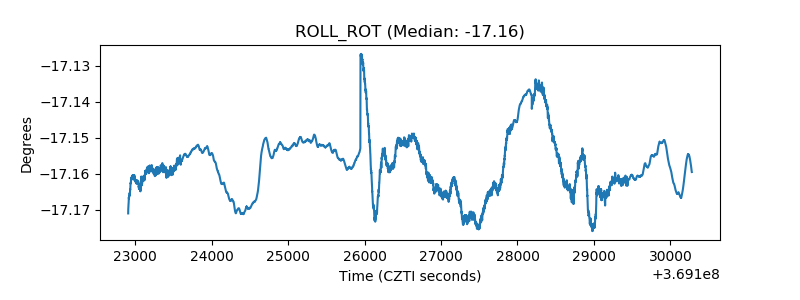 |
| _Roll_DEC | 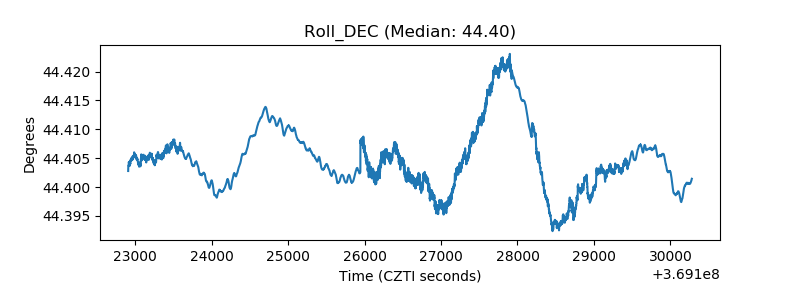 |
| _Roll_RA | 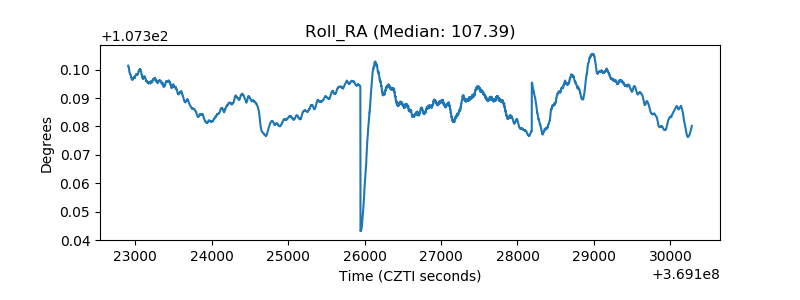 |
| Veto Counter | 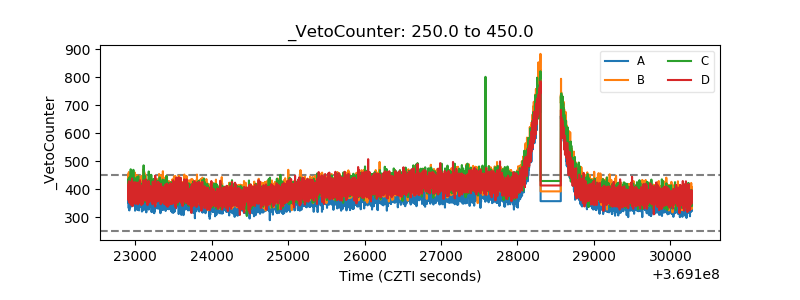 |