| Param | Original file | Final file |
|---|---|---|
| Filename | modeM0/AS1A10_057T01_9000004692_32212cztM0_level2.evt | modeM0/AS1A10_057T01_9000004692_32212cztM0_level2_quad_clean.evt |
| Size (bytes) | 676,834,560 | 99,564,480 |
| Size | 645.5 MB | 95.0 MB |
| Events in quadrant A | 3,450,108 | 642,359 |
| Events in quadrant B | 6,833,807 | 631,073 |
| Events in quadrant C | 3,536,525 | 632,291 |
| Events in quadrant D | 6,194,620 | 611,854 |
| Mode M0 | |||
|---|---|---|---|
| Quadrant | BADHDUFLAG | Total packets | Discarded packets |
| A | 0 | 14896 | 1 |
| B | 0 | 25615 | 0 |
| C | 0 | 15048 | 0 |
| D | 0 | 23535 | 0 |
| Mode SS | |||
|---|---|---|---|
| Quadrant | BADHDUFLAG | Total packets | Discarded packets |
| A | 0 | 144 | 0 |
| B | 0 | 144 | 0 |
| C | 0 | 144 | 0 |
| D | 0 | 144 | 0 |
| Quadrant | Total seconds | Saturated seconds | Saturation percentage |
|---|---|---|---|
| A | 7136 | 204 | 2.858744% |
| B | 7136 | 950 | 13.312780% |
| C | 7136 | 310 | 4.344170% |
| D | 7136 | 269 | 3.769619% |
Noise dominated data is calculated using 1-second bins in cleaned event files. If a bin has >2000 counts, and if more than 50% of those come from <1% of pixels, then it is considered to be noise-dominated and hence unusable.
| Quadrant | # 1 sec bins | Bins with >0 counts | Bins with >2000 counts | High rate bins dominated by noise | Noise dominated (total time) | Noise dominated (detector-on time) | Marked lightcurve |
|---|---|---|---|---|---|---|---|
| A | 7136 | 7136 | 0 | 0 | 0.00% | 0.00% | 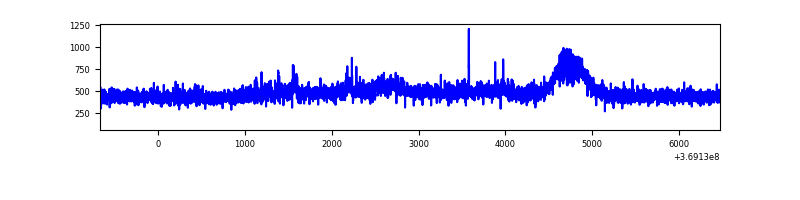 |
| B | 7136 | 7136 | 377 | 377 | 5.28% | 5.28% | 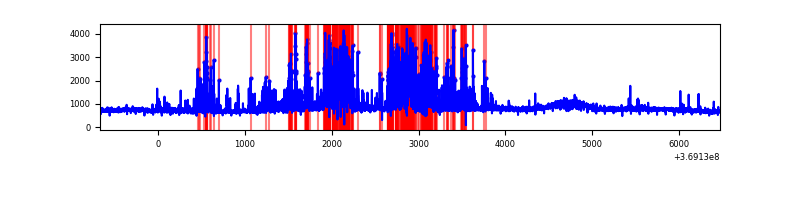 |
| C | 7136 | 7136 | 0 | 0 | 0.00% | 0.00% | 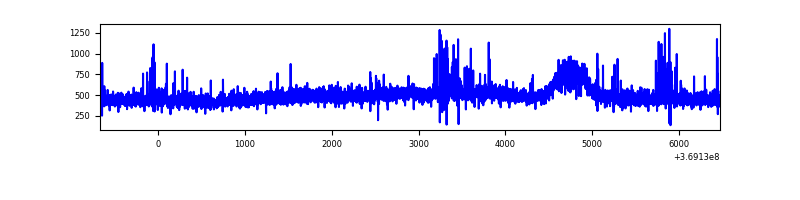 |
| D | 7136 | 7136 | 81 | 81 | 1.14% | 1.14% |  |
Top three noisy pixels from each quadrant. If the there are fewer than three noisy pixels in the level2.evt file, extra rows are filled as -1
| Pixel properties | Quadrant properties | ||||||
|---|---|---|---|---|---|---|---|
| Quadrant | DetID | PixID | Counts | Sigma | Mean | Median | Sigma |
| A | 12 | 189 | 49240 | 274.36 | 867 | 847 | 176.4 |
| A | 0 | 6 | 31786 | 175.41 | 867 | 847 | 176.4 |
| A | 13 | 254 | 12809 | 67.82 | 867 | 847 | 176.4 |
| B | 6 | 159 | 1877895 | 11805.45 | 824 | 803 | 159.0 |
| B | 12 | 18 | 1562094 | 9819.31 | 824 | 803 | 159.0 |
| B | 0 | 190 | 36049 | 221.67 | 824 | 803 | 159.0 |
| C | 14 | 238 | 182262 | 928.4 | 826 | 829 | 195.4 |
| C | 14 | 254 | 67260 | 339.93 | 826 | 829 | 195.4 |
| C | 2 | 114 | 16518 | 80.28 | 826 | 829 | 195.4 |
| D | 5 | 172 | 2354019 | 11593.49 | 837 | 811 | 203.0 |
| D | 8 | 195 | 262478 | 1289.15 | 837 | 811 | 203.0 |
| D | 12 | 233 | 174505 | 855.73 | 837 | 811 | 203.0 |
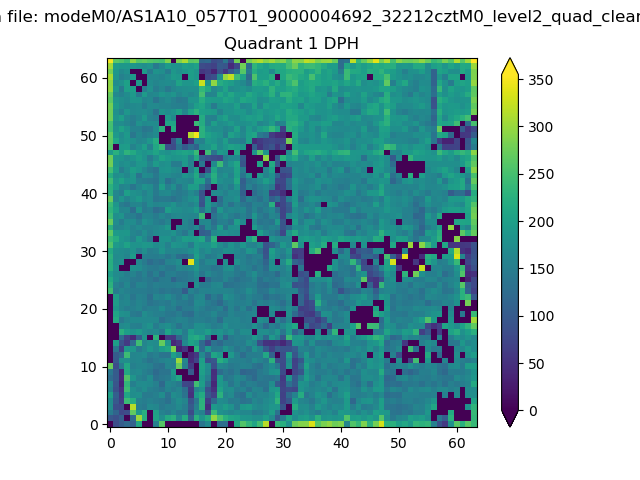
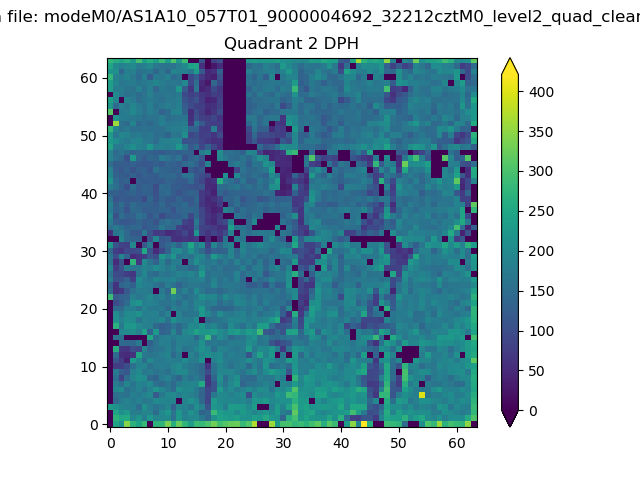
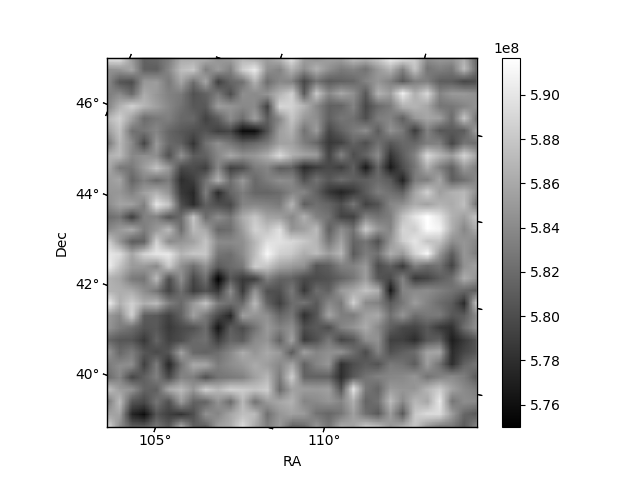
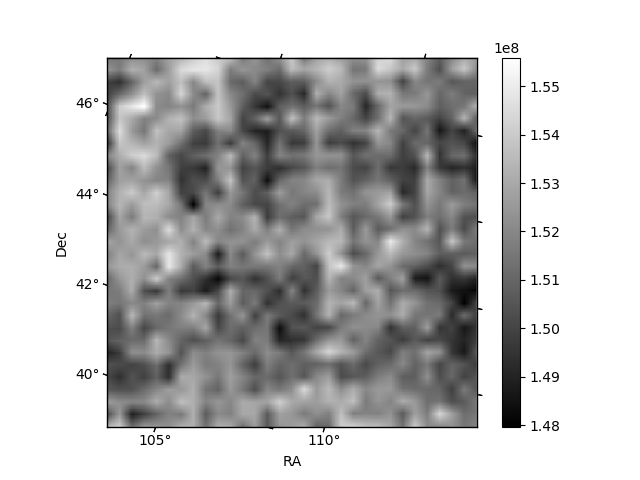
Histogram calculated using DETX and DETY for each event in the final _common_clean file
| Quadrant A | 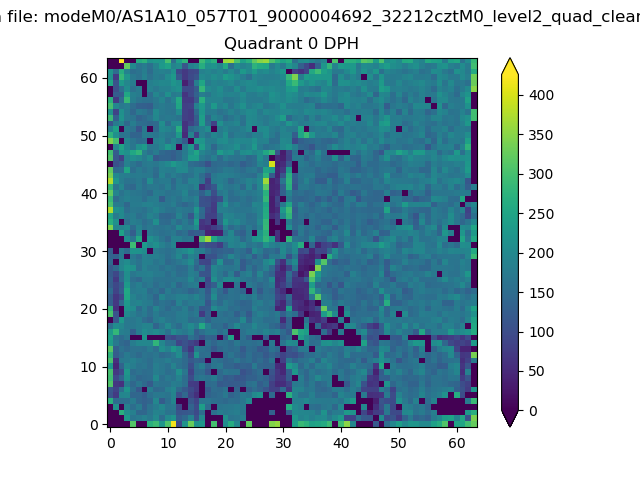 |
 |
Quadrant B |
|---|---|---|---|
| Quadrant D | 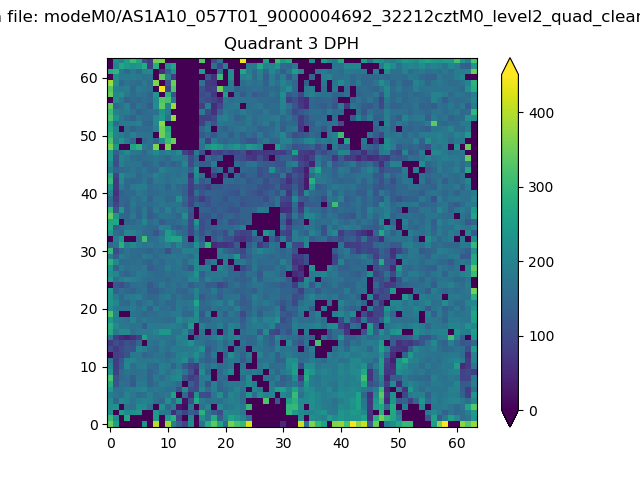 |
 |
Quadrant C |
| Plot type | Count rate plots | Images |
|---|---|---|
| Comparison with Poisson distribution Blue bars denote a histogram of data divided into 1 sec bins. Red curve is a Poisson curve with rate = median count rate of data. |
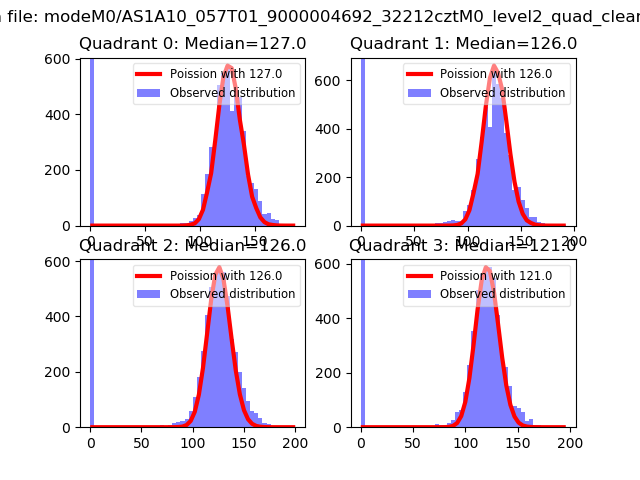 |
 |
| Quadrant-wise count rates Data is divided into 100 sec bins |
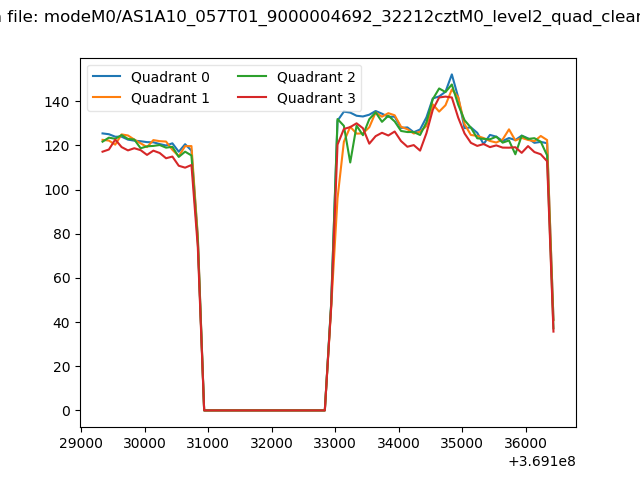 |
|
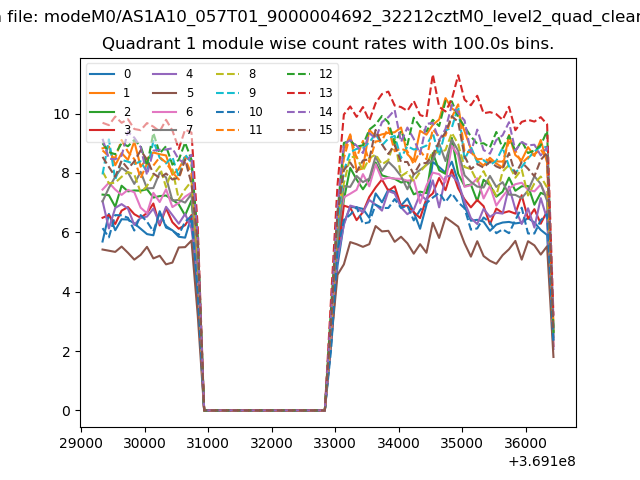
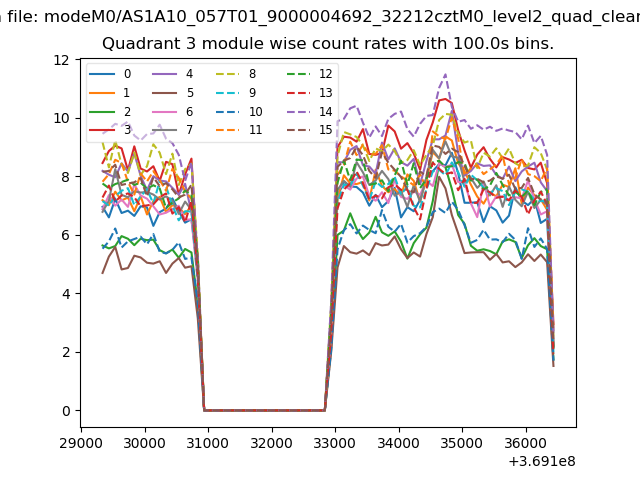
| Module-wise count rates for Quadrant A Data is divided into 100 sec bins |
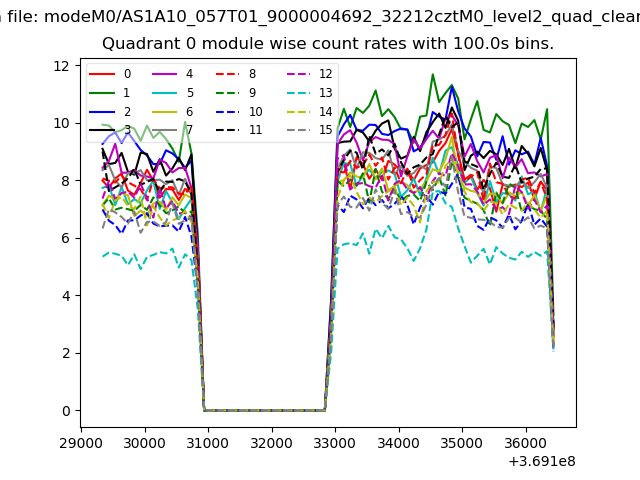 |
 |
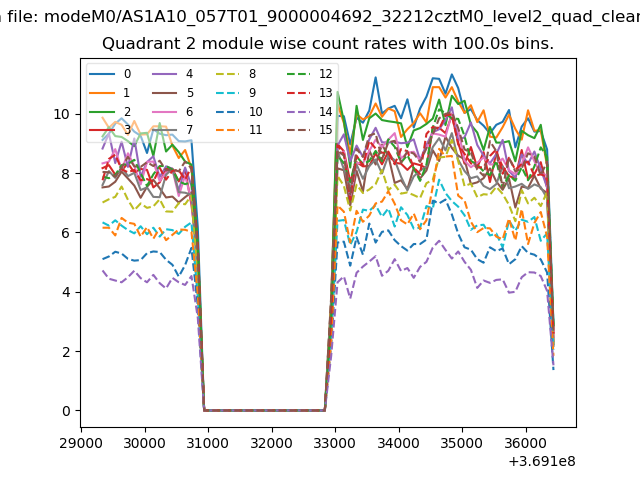
| Module-wise count rates for Quadrant B Data is divided into 100 sec bins |
 |
 |
| Module-wise count rates for Quadrant C Data is divided into 100 sec bins |
 |
 |
| Module-wise count rates for Quadrant D Data is divided into 100 sec bins |
 |
 |
| Parameter | Plot |
|---|---|
| CZT HV Monitor | 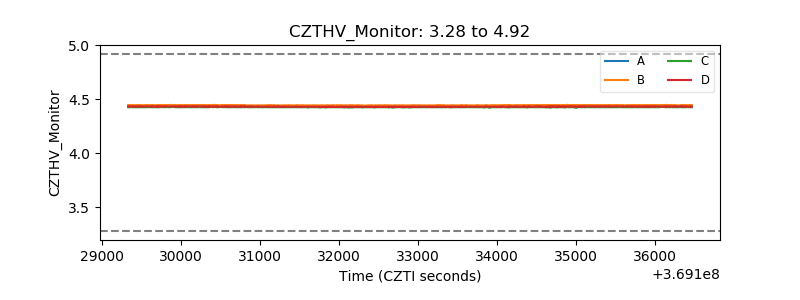 |
| D_VDD | 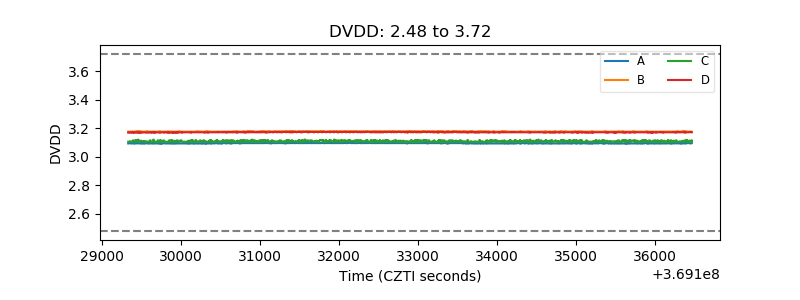 |
| Temperature 1 | 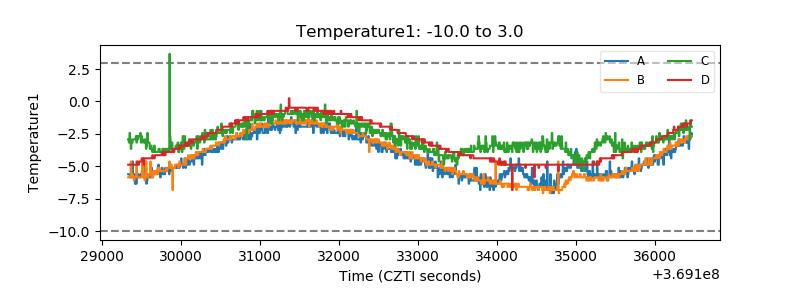 |
| Veto HV Monitor | 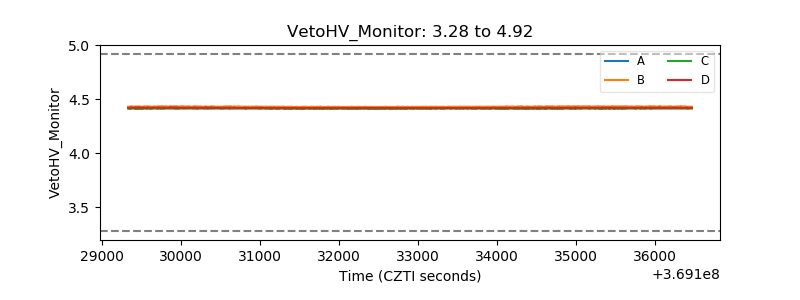 |
| Veto LLD | 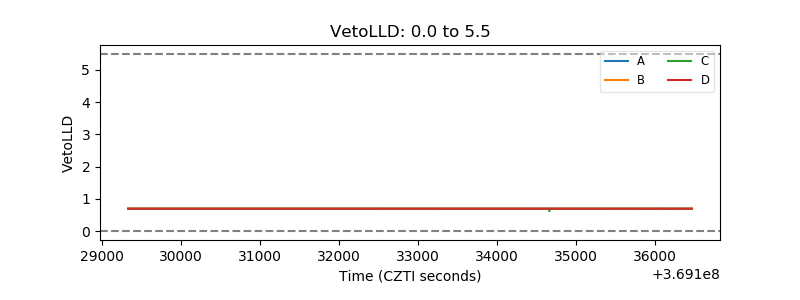 |
| Alpha Counter | 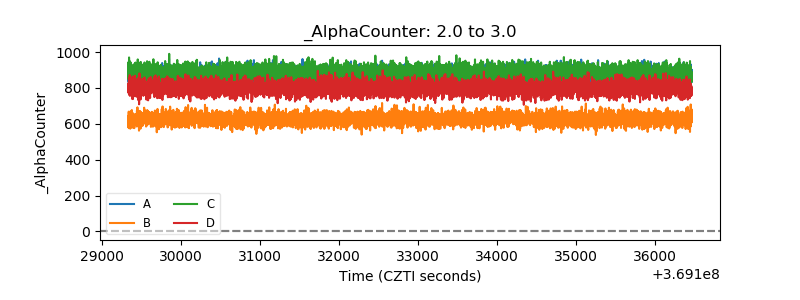 |
| _CPM_Rate | 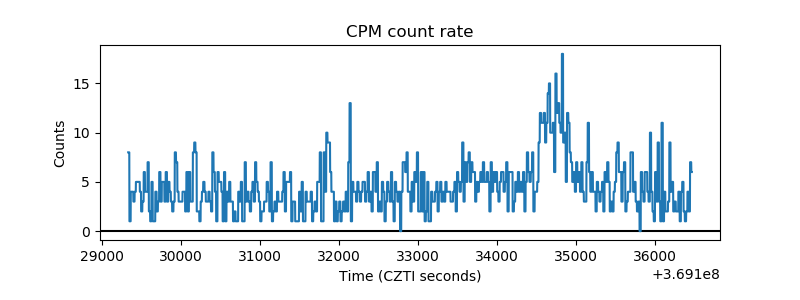 |
| CZT Counter | 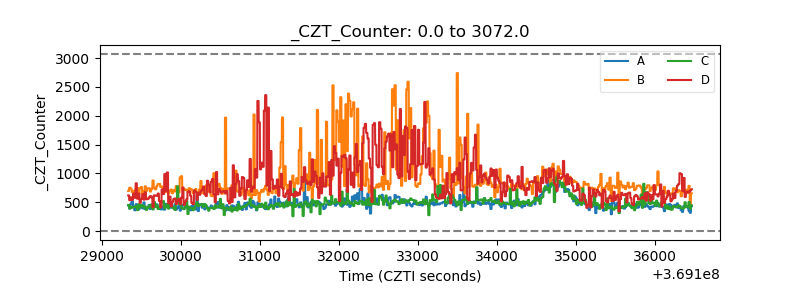 |
| +2.5 Volts monitor |  |
| +5 Volts monitor | 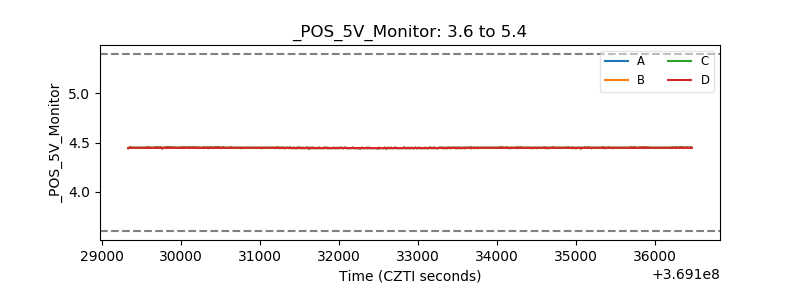 |
| _ROLL_ROT | 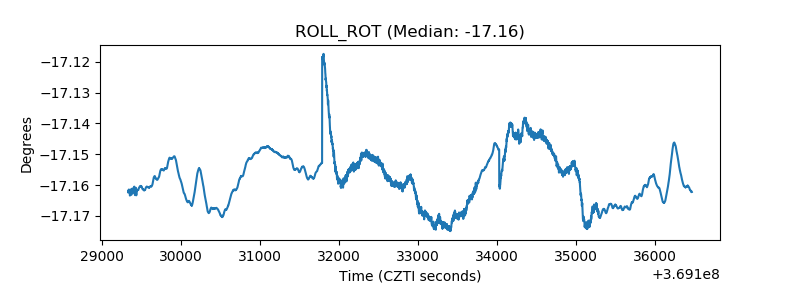 |
| _Roll_DEC | 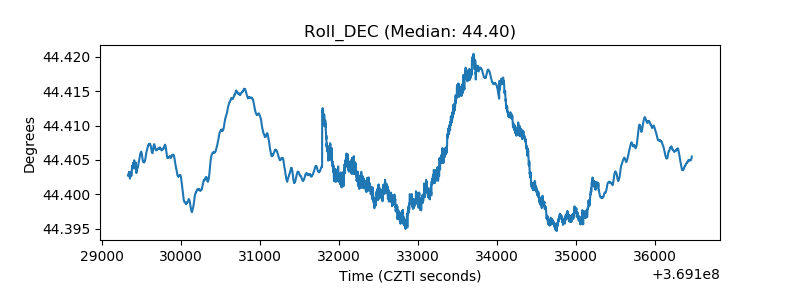 |
| _Roll_RA | 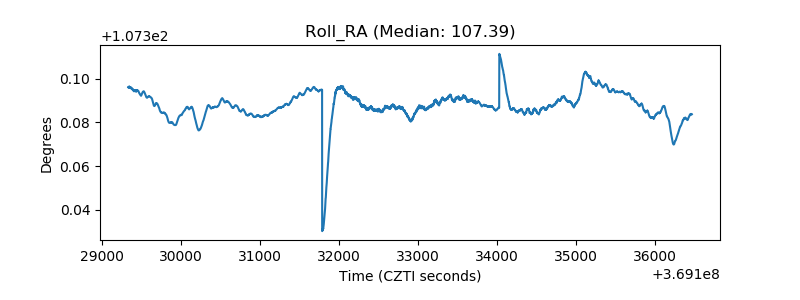 |
| Veto Counter | 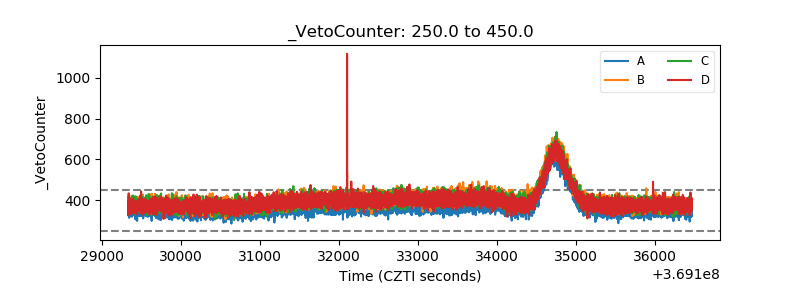 |