| Param | Original file | Final file |
|---|---|---|
| Filename | modeM0/AS1A10_057T01_9000004692_32215cztM0_level2.evt | modeM0/AS1A10_057T01_9000004692_32215cztM0_level2_quad_clean.evt |
| Size (bytes) | 833,538,240 | 88,551,360 |
| Size | 794.9 MB | 84.4 MB |
| Events in quadrant A | 3,911,232 | 552,384 |
| Events in quadrant B | 6,542,466 | 553,748 |
| Events in quadrant C | 3,877,136 | 538,658 |
| Events in quadrant D | 10,378,838 | 485,362 |
| Mode M0 | |||
|---|---|---|---|
| Quadrant | BADHDUFLAG | Total packets | Discarded packets |
| A | 0 | 16607 | 2 |
| B | 0 | 25437 | 1 |
| C | 0 | 16386 | 1 |
| D | 0 | 36434 | 1 |
| Mode SS | |||
|---|---|---|---|
| Quadrant | BADHDUFLAG | Total packets | Discarded packets |
| A | 0 | 160 | 0 |
| B | 0 | 160 | 0 |
| C | 0 | 160 | 0 |
| D | 0 | 160 | 0 |
| Mode M9 | |||
|---|---|---|---|
| Quadrant | BADHDUFLAG | Total packets | Discarded packets |
| A | 0 | 5 | 0 |
| B | 0 | 5 | 0 |
| C | 0 | 5 | 0 |
| D | 0 | 5 | 0 |
| Quadrant | Total seconds | Saturated seconds | Saturation percentage |
|---|---|---|---|
| A | 7924 | 94 | 1.186270% |
| B | 7924 | 350 | 4.416961% |
| C | 7924 | 246 | 3.104493% |
| D | 7924 | 1380 | 17.415447% |
Noise dominated data is calculated using 1-second bins in cleaned event files. If a bin has >2000 counts, and if more than 50% of those come from <1% of pixels, then it is considered to be noise-dominated and hence unusable.
| Quadrant | # 1 sec bins | Bins with >0 counts | Bins with >2000 counts | High rate bins dominated by noise | Noise dominated (total time) | Noise dominated (detector-on time) | Marked lightcurve |
|---|---|---|---|---|---|---|---|
| A | 8394 | 7925 | 3 | 3 | 0.04% | 0.04% | 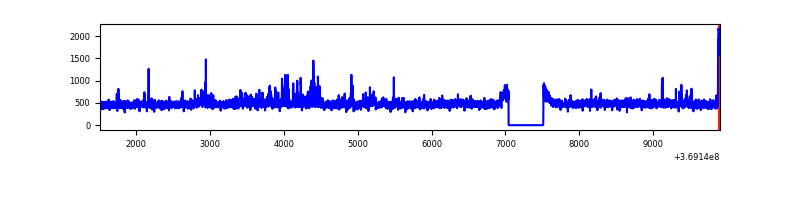 |
| B | 8394 | 7925 | 147 | 147 | 1.75% | 1.85% |  |
| C | 8394 | 7925 | 9 | 9 | 0.11% | 0.11% | 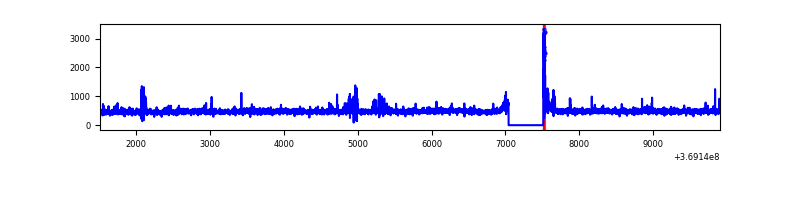 |
| D | 8394 | 7925 | 1162 | 1162 | 13.84% | 14.66% | 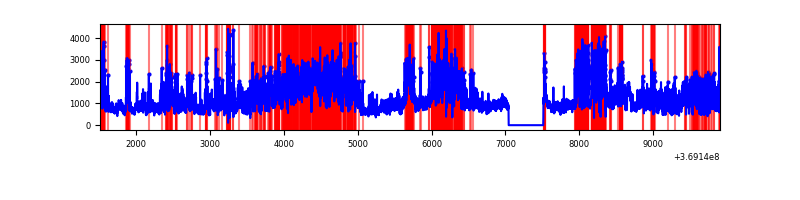 |
Top three noisy pixels from each quadrant. If the there are fewer than three noisy pixels in the level2.evt file, extra rows are filled as -1
| Pixel properties | Quadrant properties | ||||||
|---|---|---|---|---|---|---|---|
| Quadrant | DetID | PixID | Counts | Sigma | Mean | Median | Sigma |
| A | 12 | 189 | 213062 | 1100.39 | 953 | 932 | 192.8 |
| A | 13 | 254 | 14781 | 71.84 | 953 | 932 | 192.8 |
| A | 3 | 137 | 9765 | 45.82 | 953 | 932 | 192.8 |
| B | 6 | 159 | 2129230 | 11877.64 | 928 | 907 | 179.2 |
| B | 5 | 172 | 511319 | 2848.48 | 928 | 907 | 179.2 |
| B | 0 | 190 | 160483 | 890.55 | 928 | 907 | 179.2 |
| C | 14 | 238 | 190706 | 889.19 | 903 | 908 | 213.5 |
| C | 14 | 254 | 66595 | 307.74 | 903 | 908 | 213.5 |
| C | 0 | 10 | 48721 | 224.0 | 903 | 908 | 213.5 |
| D | 5 | 172 | 3186202 | 15056.88 | 873 | 847 | 211.6 |
| D | 2 | 250 | 1354227 | 6397.3 | 873 | 847 | 211.6 |
| D | 8 | 195 | 1271441 | 6005.98 | 873 | 847 | 211.6 |
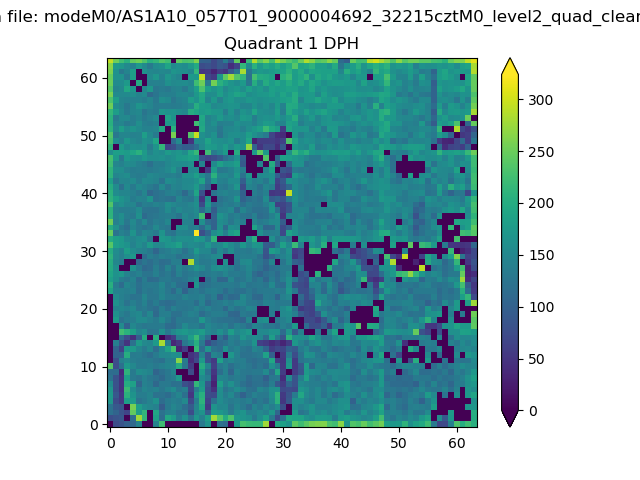
Histogram calculated using DETX and DETY for each event in the final _common_clean file
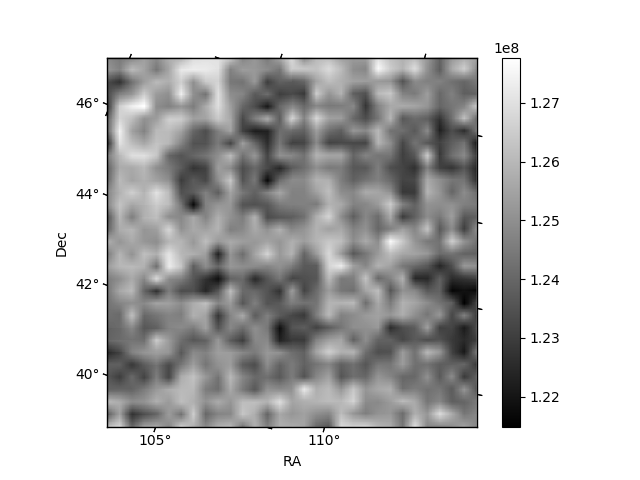
| Quadrant A |  |
 |
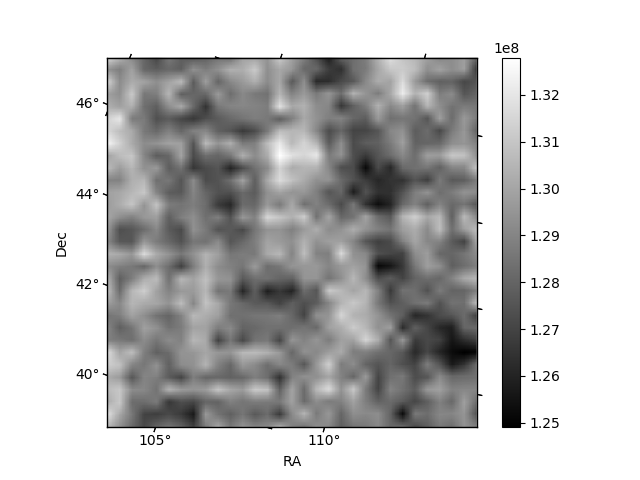
Quadrant B |
|---|---|---|---|
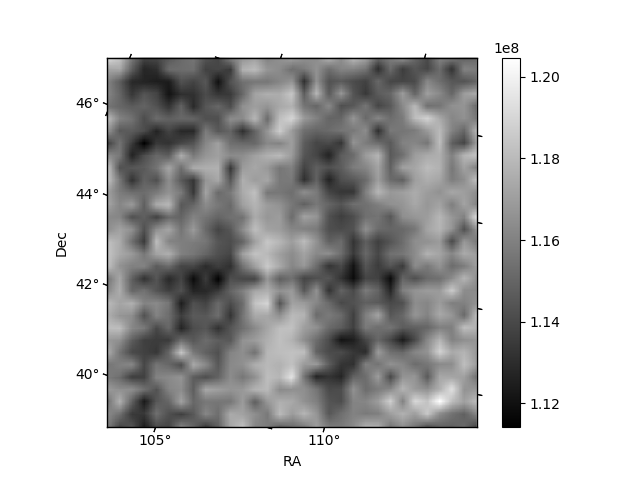
| Quadrant D | 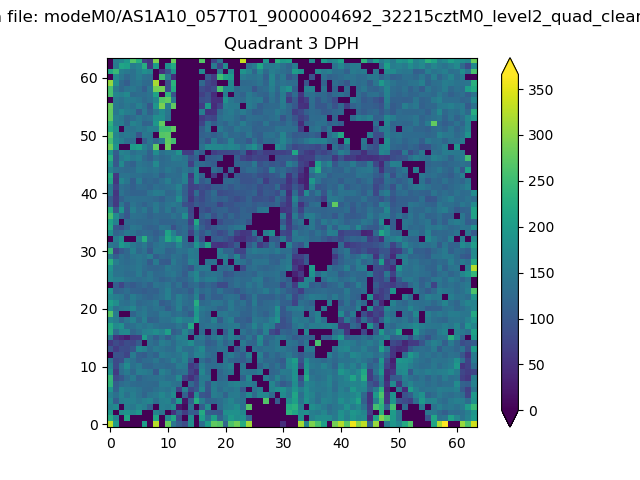 |
 |
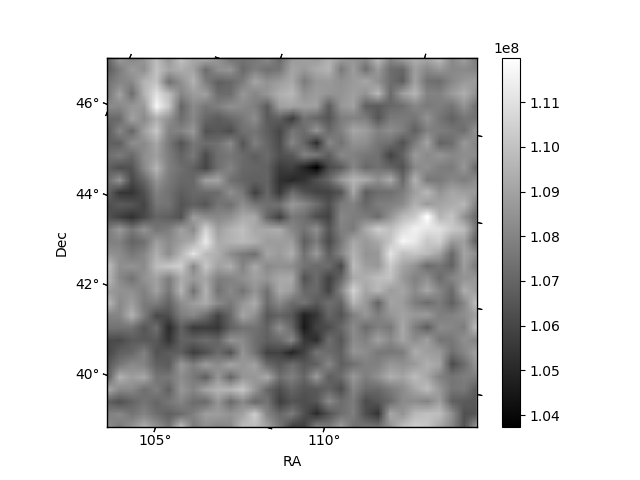
Quadrant C |
| Plot type | Count rate plots | Images |
|---|---|---|
| Comparison with Poisson distribution Blue bars denote a histogram of data divided into 1 sec bins. Red curve is a Poisson curve with rate = median count rate of data. |
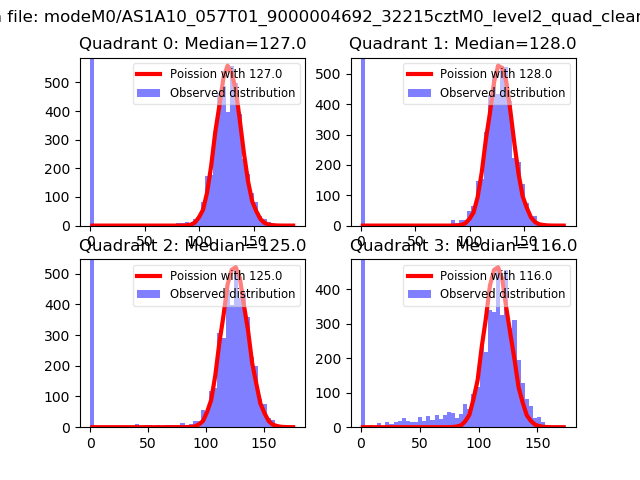 |
 |
| Quadrant-wise count rates Data is divided into 100 sec bins |
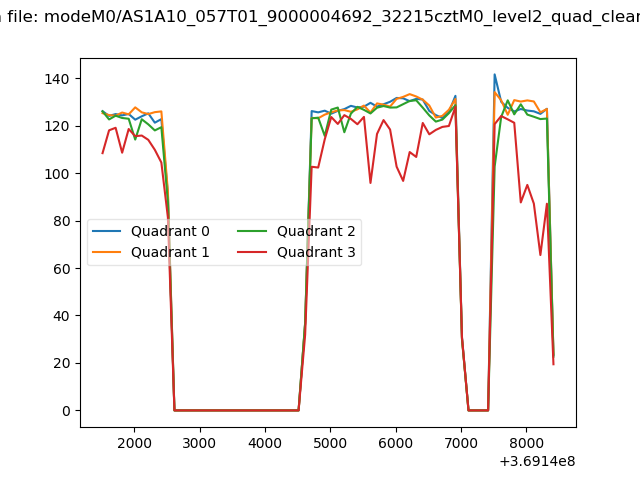 |
|
| Module-wise count rates for Quadrant A Data is divided into 100 sec bins |
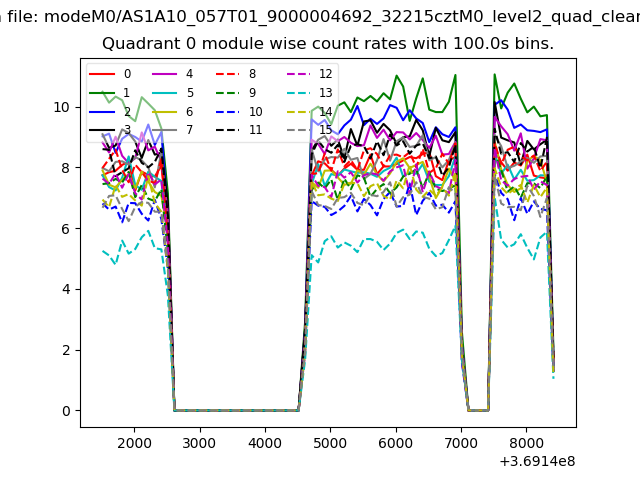 |
 |
| Module-wise count rates for Quadrant B Data is divided into 100 sec bins |
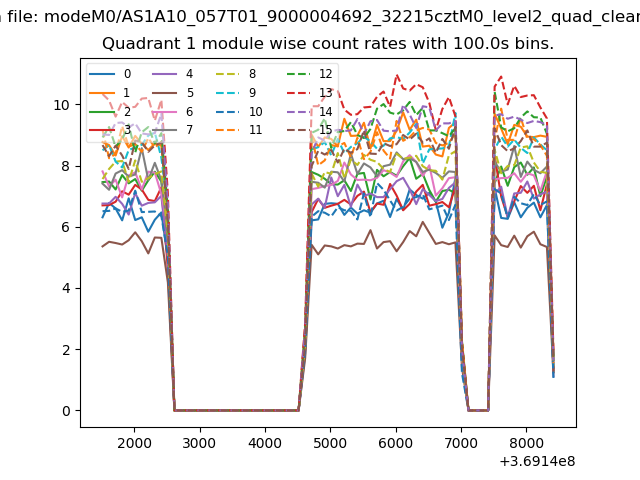 |
 |
| Module-wise count rates for Quadrant C Data is divided into 100 sec bins |
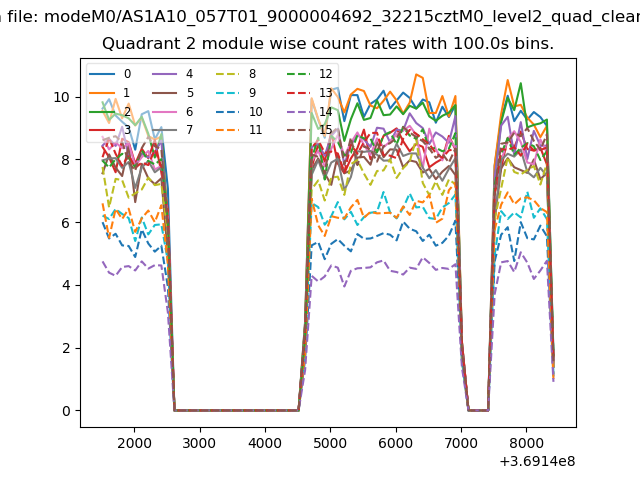 |
 |
| Module-wise count rates for Quadrant D Data is divided into 100 sec bins |
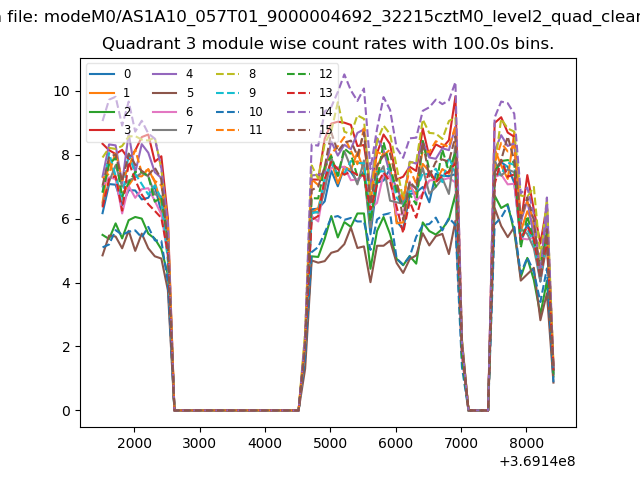 |
 |
| Parameter | Plot |
|---|---|
| CZT HV Monitor | 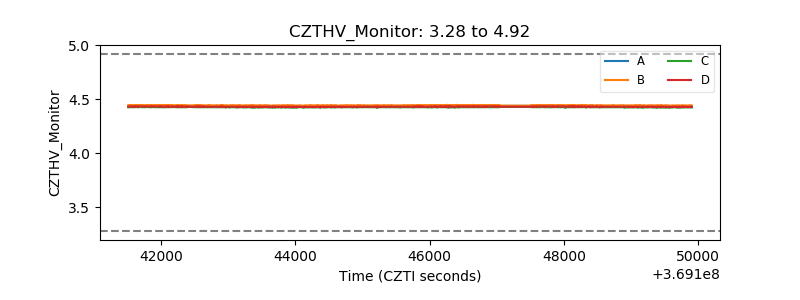 |
| D_VDD | 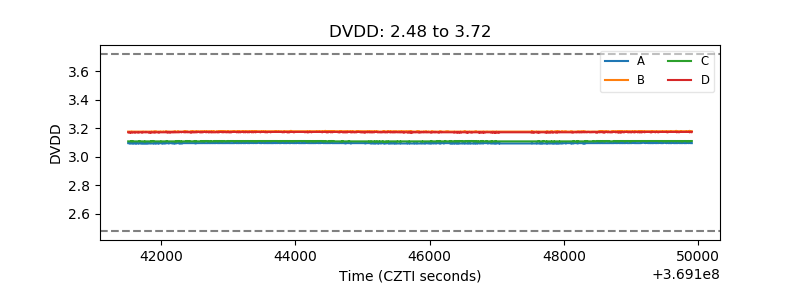 |
| Temperature 1 | 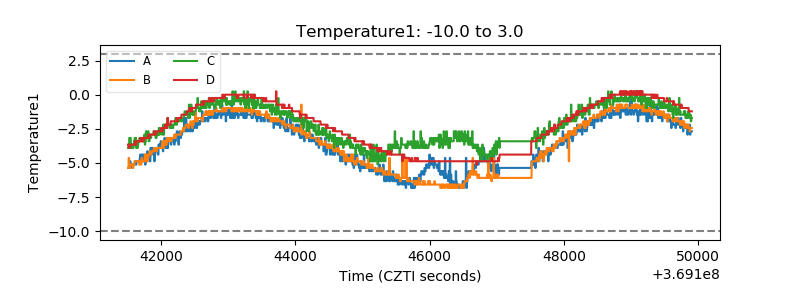 |
| Veto HV Monitor | 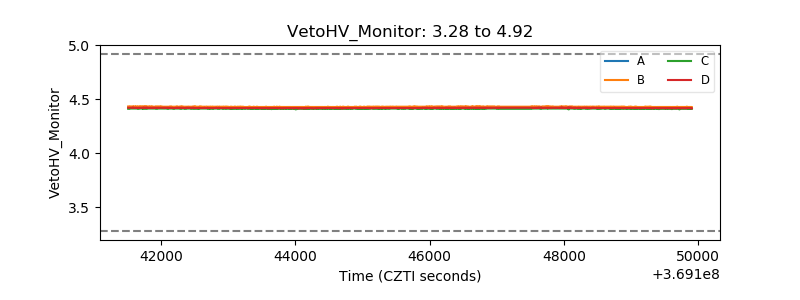 |
| Veto LLD | 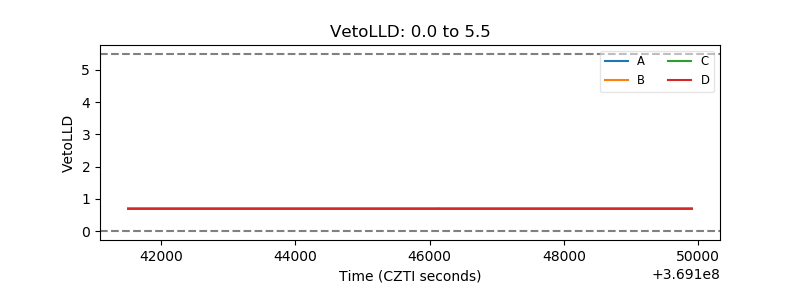 |
| Alpha Counter | 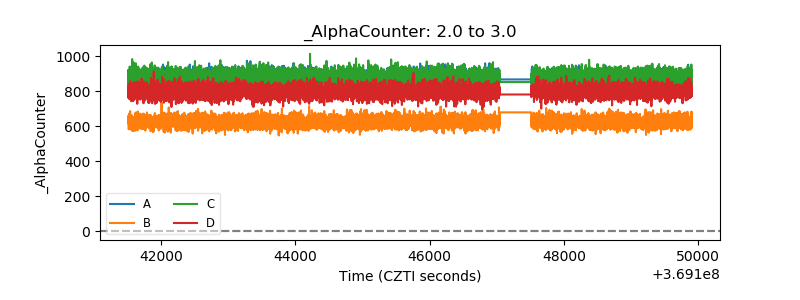 |
| _CPM_Rate | 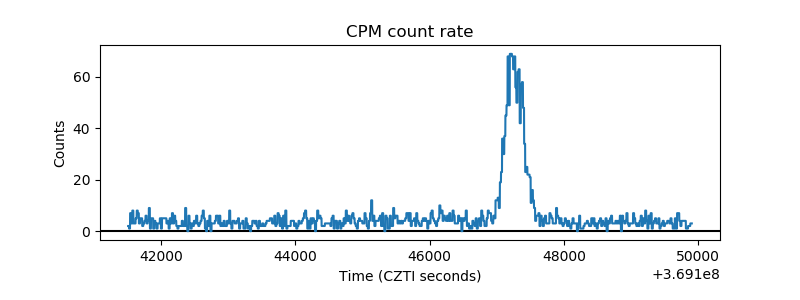 |
| CZT Counter | 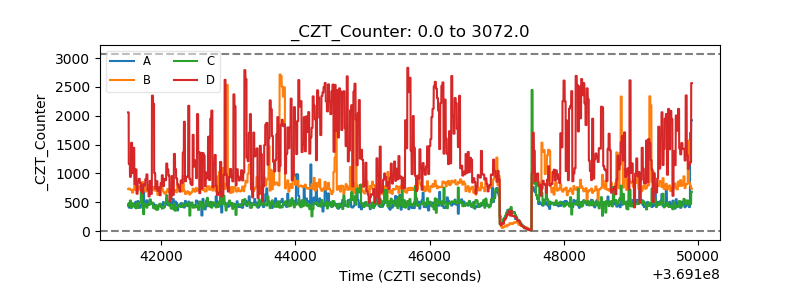 |
| +2.5 Volts monitor |  |
| +5 Volts monitor |  |
| _ROLL_ROT | 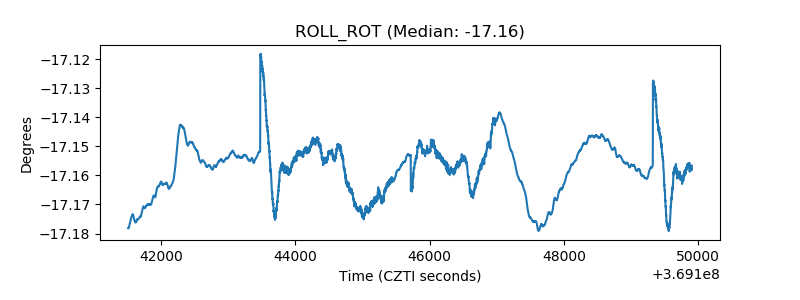 |
| _Roll_DEC | 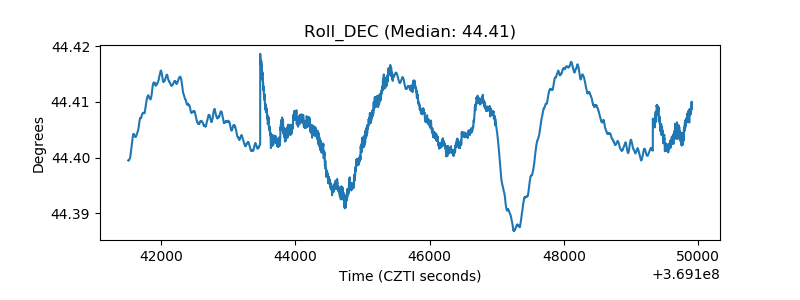 |
| _Roll_RA | 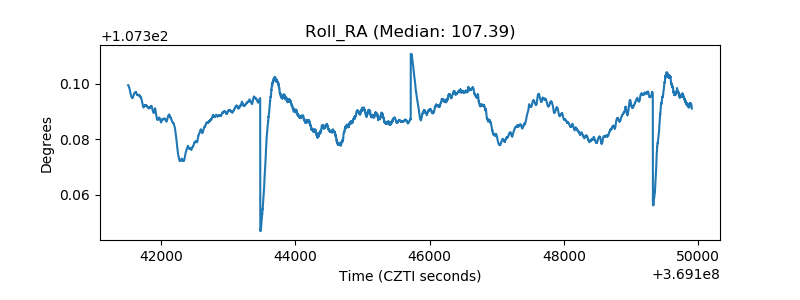 |
| Veto Counter | 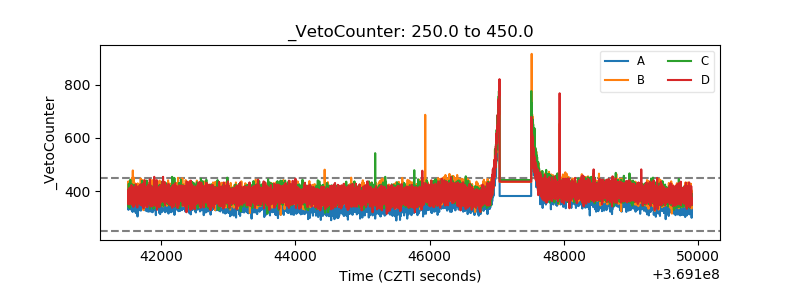 |