| Param | Original file | Final file |
|---|---|---|
| Filename | modeM0/AS1A10_057T01_9000004692_32216cztM0_level2.evt | modeM0/AS1A10_057T01_9000004692_32216cztM0_level2_quad_clean.evt |
| Size (bytes) | 948,090,240 | 122,304,960 |
| Size | 904.2 MB | 116.6 MB |
| Events in quadrant A | 5,196,034 | 762,241 |
| Events in quadrant B | 8,606,690 | 754,843 |
| Events in quadrant C | 5,390,588 | 738,486 |
| Events in quadrant D | 8,813,365 | 722,979 |
| Mode M0 | |||
|---|---|---|---|
| Quadrant | BADHDUFLAG | Total packets | Discarded packets |
| A | 0 | 22076 | 3 |
| B | 0 | 32936 | 2 |
| C | 0 | 22474 | 2 |
| D | 0 | 33192 | 2 |
| Mode SS | |||
|---|---|---|---|
| Quadrant | BADHDUFLAG | Total packets | Discarded packets |
| A | 0 | 214 | 0 |
| B | 0 | 214 | 0 |
| C | 0 | 214 | 0 |
| D | 0 | 214 | 0 |
| Mode M9 | |||
|---|---|---|---|
| Quadrant | BADHDUFLAG | Total packets | Discarded packets |
| A | 0 | 15 | 0 |
| B | 0 | 15 | 0 |
| C | 0 | 15 | 0 |
| D | 0 | 15 | 0 |
| Quadrant | Total seconds | Saturated seconds | Saturation percentage |
|---|---|---|---|
| A | 10466 | 125 | 1.194344% |
| B | 10466 | 287 | 2.742213% |
| C | 10466 | 570 | 5.446207% |
| D | 10466 | 638 | 6.095930% |
Noise dominated data is calculated using 1-second bins in cleaned event files. If a bin has >2000 counts, and if more than 50% of those come from <1% of pixels, then it is considered to be noise-dominated and hence unusable.
| Quadrant | # 1 sec bins | Bins with >0 counts | Bins with >2000 counts | High rate bins dominated by noise | Noise dominated (total time) | Noise dominated (detector-on time) | Marked lightcurve |
|---|---|---|---|---|---|---|---|
| A | 11986 | 10468 | 4 | 4 | 0.03% | 0.04% | 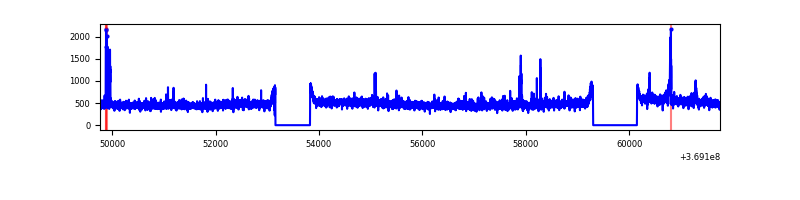 |
| B | 11986 | 10468 | 55 | 55 | 0.46% | 0.53% |  |
| C | 11986 | 10468 | 0 | 0 | 0.00% | 0.00% | 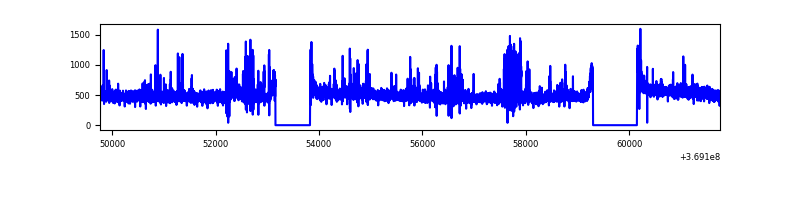 |
| D | 11986 | 10468 | 392 | 392 | 3.27% | 3.74% | 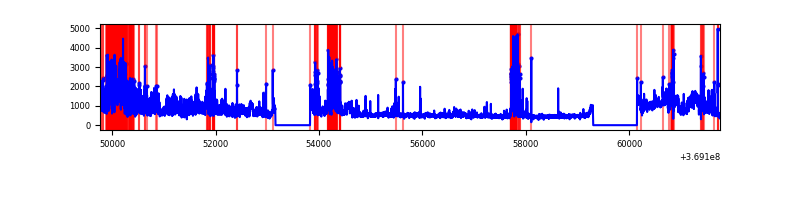 |
Top three noisy pixels from each quadrant. If the there are fewer than three noisy pixels in the level2.evt file, extra rows are filled as -1
| Pixel properties | Quadrant properties | ||||||
|---|---|---|---|---|---|---|---|
| Quadrant | DetID | PixID | Counts | Sigma | Mean | Median | Sigma |
| A | 12 | 189 | 194934 | 750.88 | 1281 | 1253 | 257.9 |
| A | 0 | 6 | 43647 | 164.36 | 1281 | 1253 | 257.9 |
| A | 13 | 254 | 20068 | 72.94 | 1281 | 1253 | 257.9 |
| B | 6 | 159 | 2961643 | 12357.31 | 1264 | 1231 | 239.6 |
| B | 5 | 172 | 328065 | 1364.27 | 1264 | 1231 | 239.6 |
| B | 0 | 229 | 141745 | 586.53 | 1264 | 1231 | 239.6 |
| C | 14 | 238 | 339138 | 1183.37 | 1218 | 1226 | 285.5 |
| C | 14 | 254 | 202586 | 705.17 | 1218 | 1226 | 285.5 |
| C | 4 | 175 | 42826 | 145.68 | 1218 | 1226 | 285.5 |
| D | 5 | 172 | 1458941 | 4971.78 | 1223 | 1189 | 293.2 |
| D | 8 | 195 | 1266747 | 4316.29 | 1223 | 1189 | 293.2 |
| D | 2 | 250 | 729723 | 2484.72 | 1223 | 1189 | 293.2 |
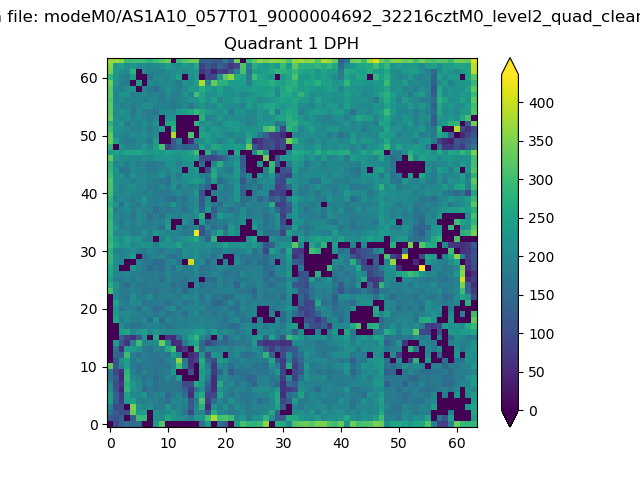
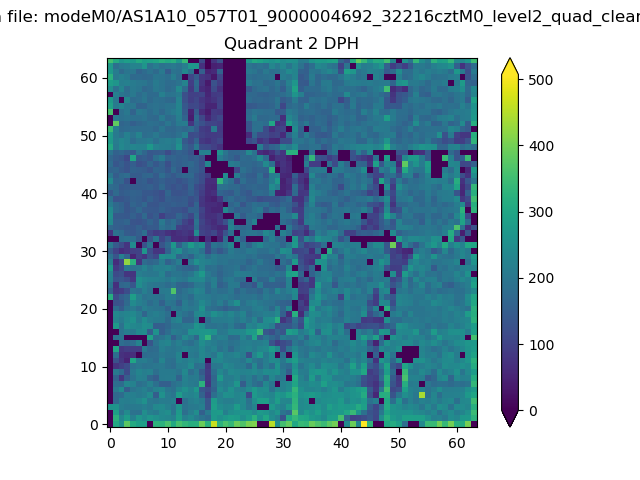
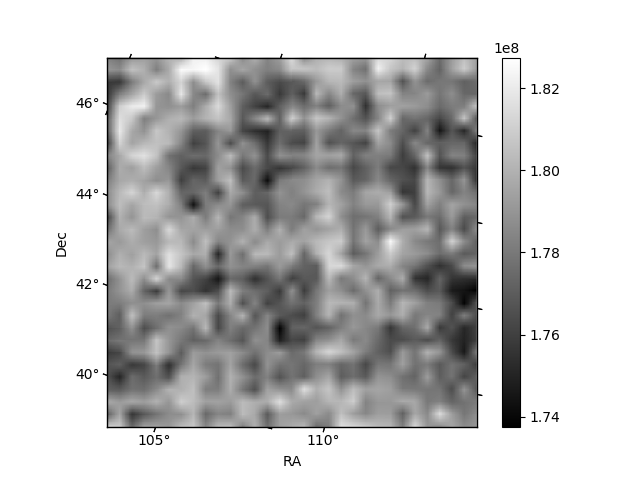
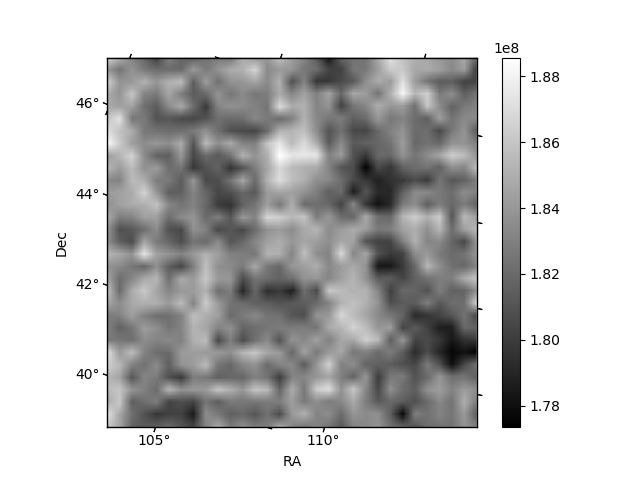
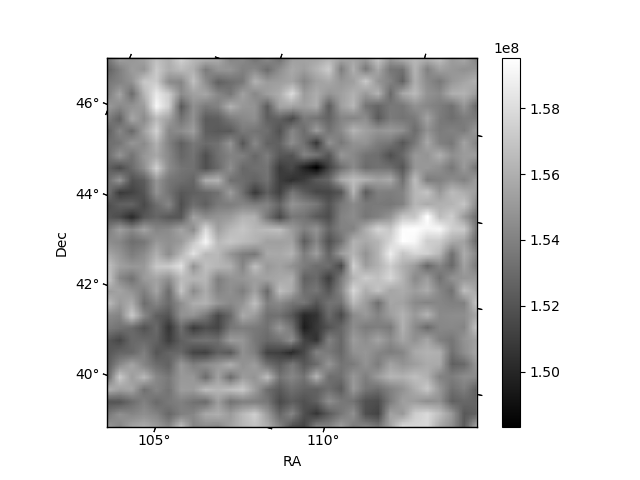
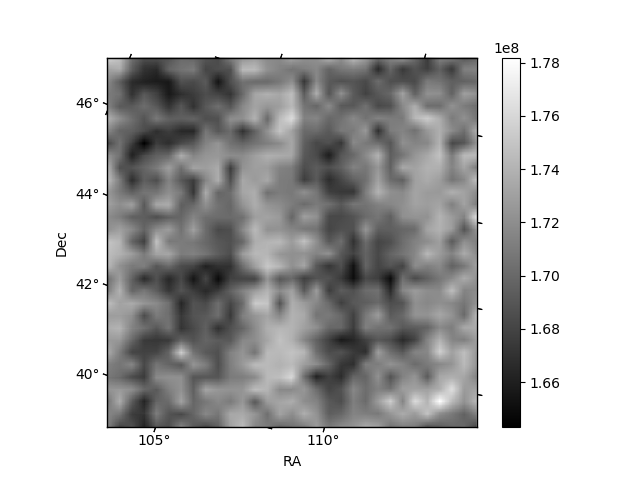
Histogram calculated using DETX and DETY for each event in the final _common_clean file
| Quadrant A | 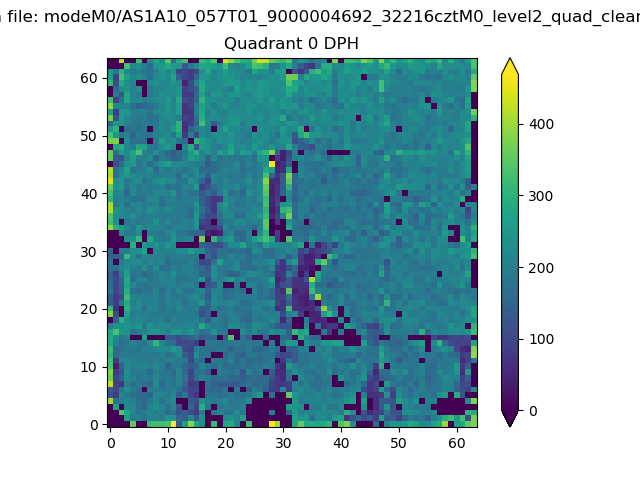 |
 |
Quadrant B |
|---|---|---|---|
| Quadrant D |  |
 |
Quadrant C |
| Plot type | Count rate plots | Images |
|---|---|---|
| Comparison with Poisson distribution Blue bars denote a histogram of data divided into 1 sec bins. Red curve is a Poisson curve with rate = median count rate of data. |
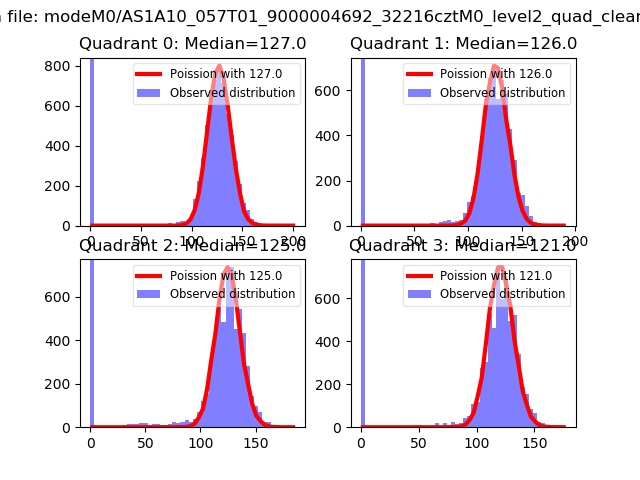 |
 |
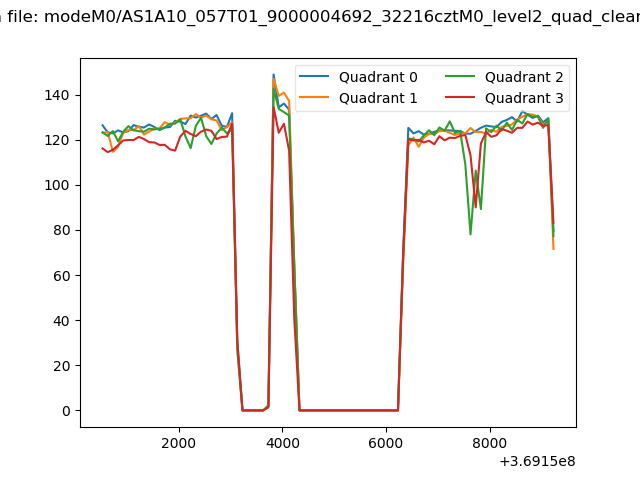
| Quadrant-wise count rates Data is divided into 100 sec bins |
 |
|
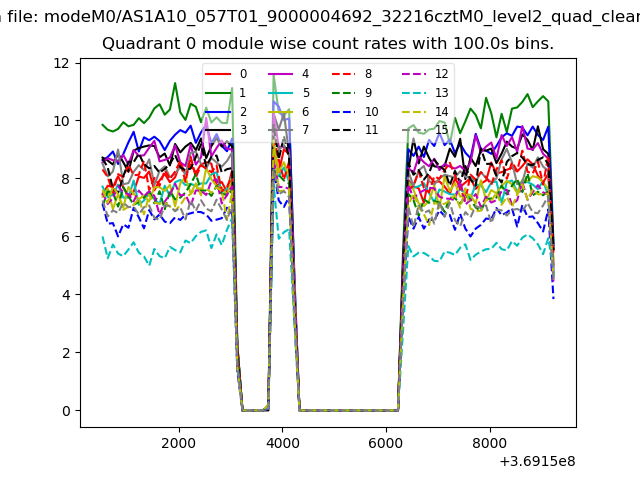
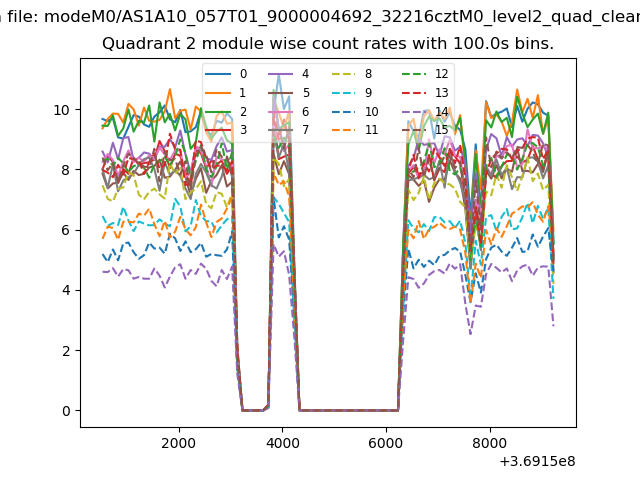
| Module-wise count rates for Quadrant A Data is divided into 100 sec bins |
 |
 |
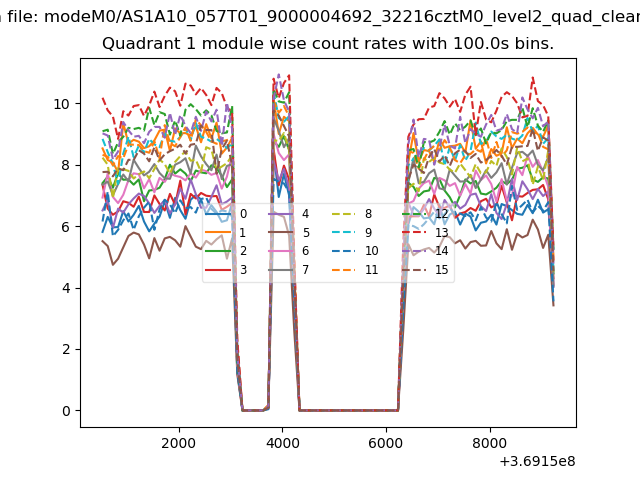
| Module-wise count rates for Quadrant B Data is divided into 100 sec bins |
 |
 |
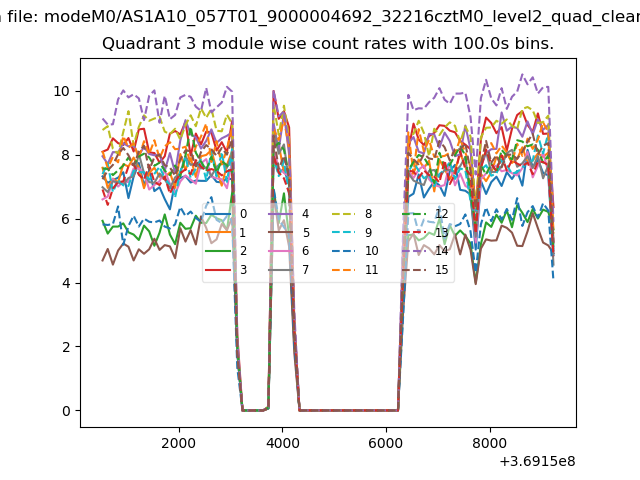
| Module-wise count rates for Quadrant C Data is divided into 100 sec bins |
 |
 |
| Module-wise count rates for Quadrant D Data is divided into 100 sec bins |
 |
 |
| Parameter | Plot |
|---|---|
| CZT HV Monitor | 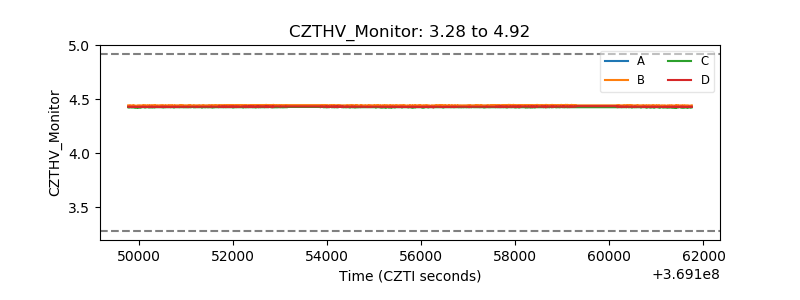 |
| D_VDD | 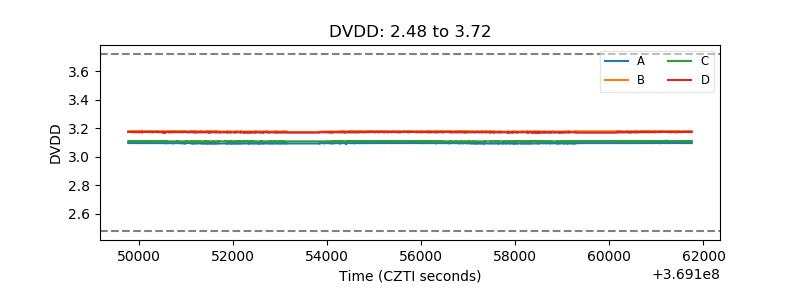 |
| Temperature 1 | 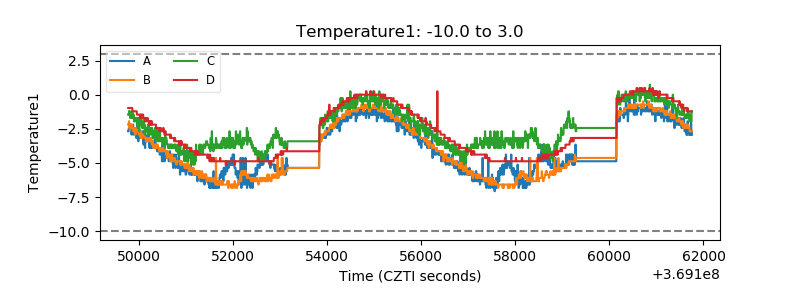 |
| Veto HV Monitor | 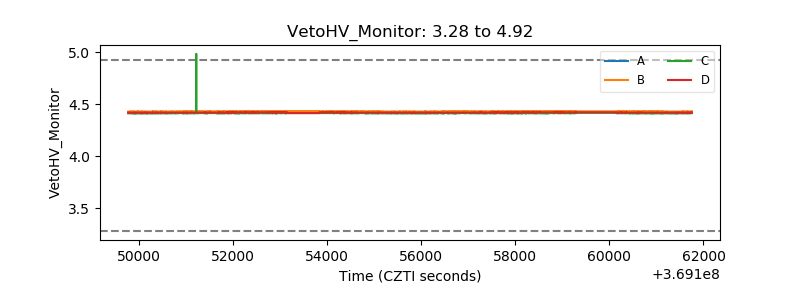 |
| Veto LLD |  |
| Alpha Counter | 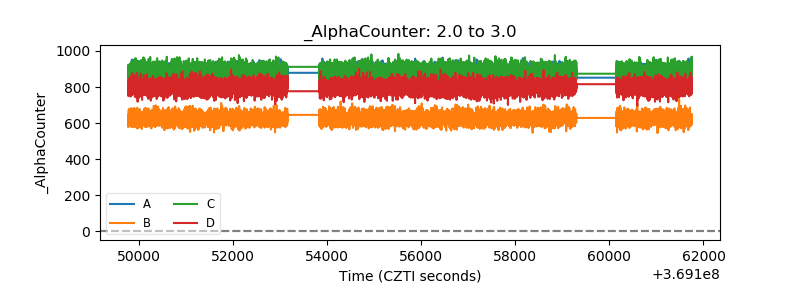 |
| _CPM_Rate | 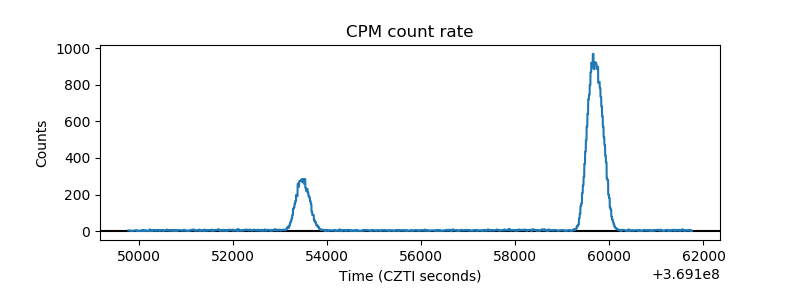 |
| CZT Counter | 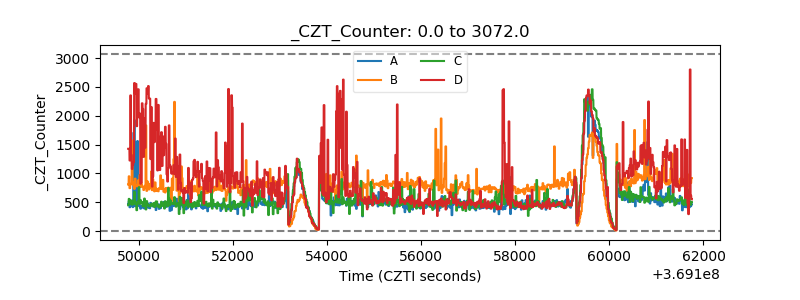 |
| +2.5 Volts monitor |  |
| +5 Volts monitor |  |
| _ROLL_ROT | 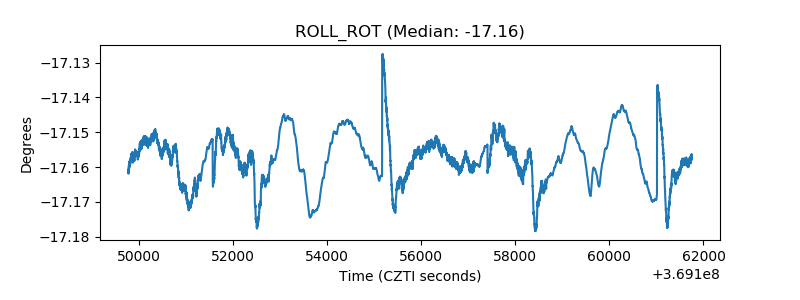 |
| _Roll_DEC | 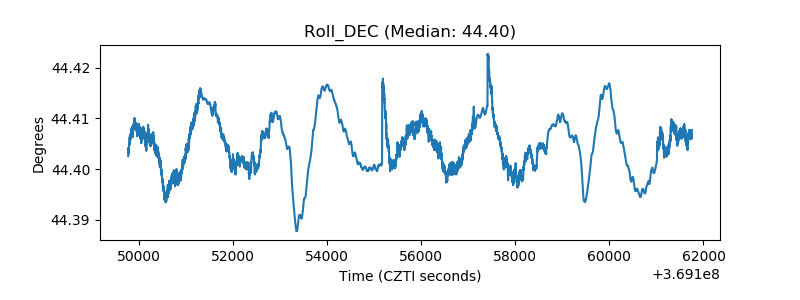 |
| _Roll_RA | 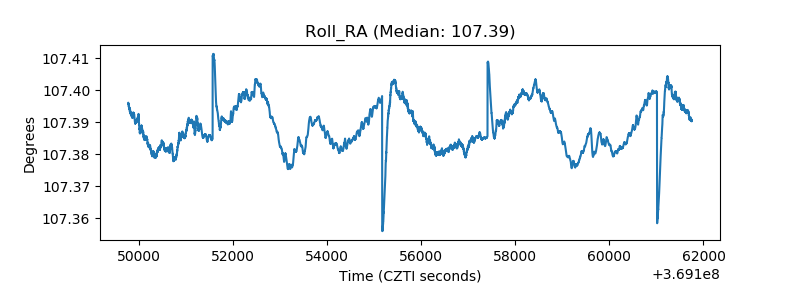 |
| Veto Counter | 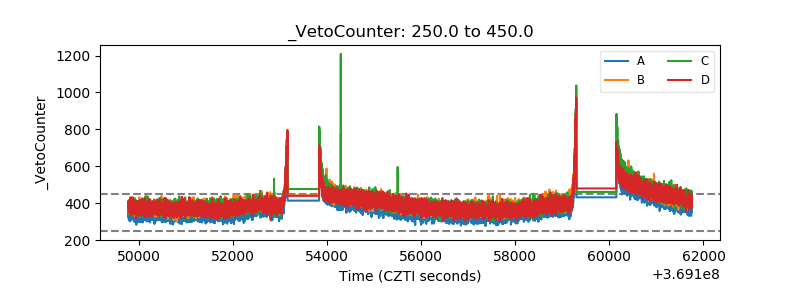 |