| Param | Original file | Final file |
|---|---|---|
| Filename | modeM0/AS1A10_057T01_9000004692_32217cztM0_level2.evt | modeM0/AS1A10_057T01_9000004692_32217cztM0_level2_quad_clean.evt |
| Size (bytes) | 543,818,880 | 67,343,040 |
| Size | 518.6 MB | 64.2 MB |
| Events in quadrant A | 3,029,275 | 408,415 |
| Events in quadrant B | 5,212,636 | 406,710 |
| Events in quadrant C | 3,293,416 | 400,518 |
| Events in quadrant D | 4,521,875 | 398,325 |
| Mode M0 | |||
|---|---|---|---|
| Quadrant | BADHDUFLAG | Total packets | Discarded packets |
| A | 0 | 12975 | 2 |
| B | 0 | 19906 | 1 |
| C | 0 | 13816 | 1 |
| D | 0 | 17529 | 1 |
| Mode SS | |||
|---|---|---|---|
| Quadrant | BADHDUFLAG | Total packets | Discarded packets |
| A | 0 | 122 | 0 |
| B | 0 | 122 | 0 |
| C | 0 | 122 | 0 |
| D | 0 | 122 | 0 |
| Mode M9 | |||
|---|---|---|---|
| Quadrant | BADHDUFLAG | Total packets | Discarded packets |
| A | 0 | 11 | 0 |
| B | 0 | 11 | 0 |
| C | 0 | 11 | 0 |
| D | 0 | 11 | 0 |
| Quadrant | Total seconds | Saturated seconds | Saturation percentage |
|---|---|---|---|
| A | 6092 | 55 | 0.902823% |
| B | 6092 | 183 | 3.003940% |
| C | 6092 | 407 | 6.680893% |
| D | 6092 | 317 | 5.203546% |
Noise dominated data is calculated using 1-second bins in cleaned event files. If a bin has >2000 counts, and if more than 50% of those come from <1% of pixels, then it is considered to be noise-dominated and hence unusable.
| Quadrant | # 1 sec bins | Bins with >0 counts | Bins with >2000 counts | High rate bins dominated by noise | Noise dominated (total time) | Noise dominated (detector-on time) | Marked lightcurve |
|---|---|---|---|---|---|---|---|
| A | 7117 | 6093 | 1 | 1 | 0.01% | 0.02% |  |
| B | 7117 | 6093 | 41 | 41 | 0.58% | 0.67% |  |
| C | 7117 | 6093 | 3 | 3 | 0.04% | 0.05% |  |
| D | 7117 | 6093 | 152 | 152 | 2.14% | 2.49% |  |
Top three noisy pixels from each quadrant. If the there are fewer than three noisy pixels in the level2.evt file, extra rows are filled as -1
| Pixel properties | Quadrant properties | ||||||
|---|---|---|---|---|---|---|---|
| Quadrant | DetID | PixID | Counts | Sigma | Mean | Median | Sigma |
| A | 12 | 189 | 37812 | 241.21 | 767 | 749 | 153.7 |
| A | 0 | 6 | 22392 | 140.86 | 767 | 749 | 153.7 |
| A | 13 | 254 | 14436 | 89.08 | 767 | 749 | 153.7 |
| B | 6 | 159 | 1838404 | 12698.78 | 758 | 739 | 144.7 |
| B | 0 | 190 | 165342 | 1137.45 | 758 | 739 | 144.7 |
| B | 5 | 172 | 125532 | 862.35 | 758 | 739 | 144.7 |
| C | 14 | 238 | 196495 | 1147.86 | 725 | 730 | 170.5 |
| C | 14 | 254 | 115690 | 674.06 | 725 | 730 | 170.5 |
| C | 0 | 10 | 71710 | 416.19 | 725 | 730 | 170.5 |
| D | 8 | 195 | 1195619 | 6754.73 | 739 | 718 | 176.9 |
| D | 12 | 218 | 94272 | 528.86 | 739 | 718 | 176.9 |
| D | 14 | 52 | 89916 | 504.23 | 739 | 718 | 176.9 |
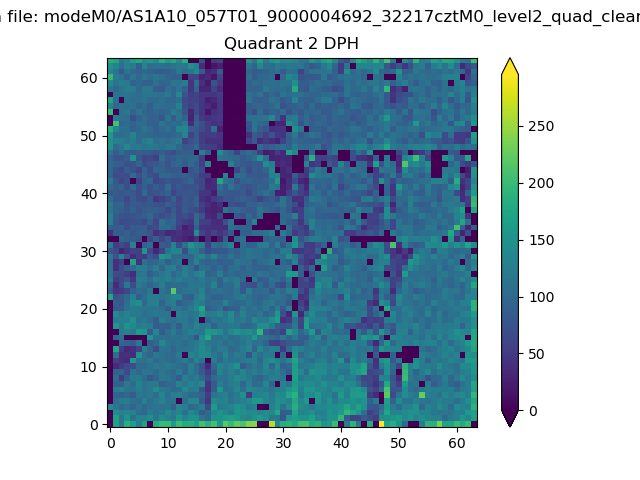
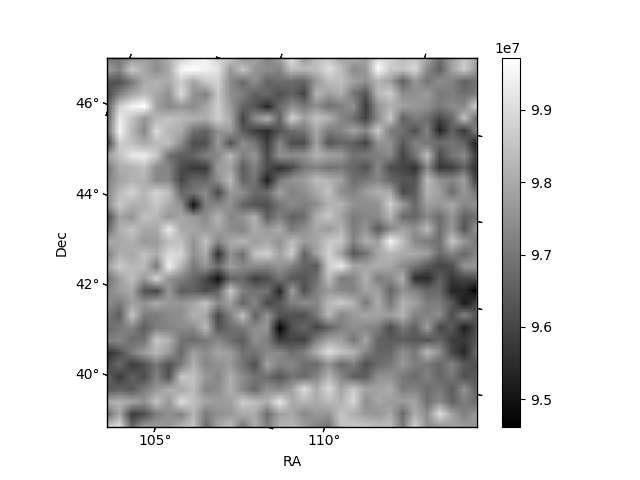
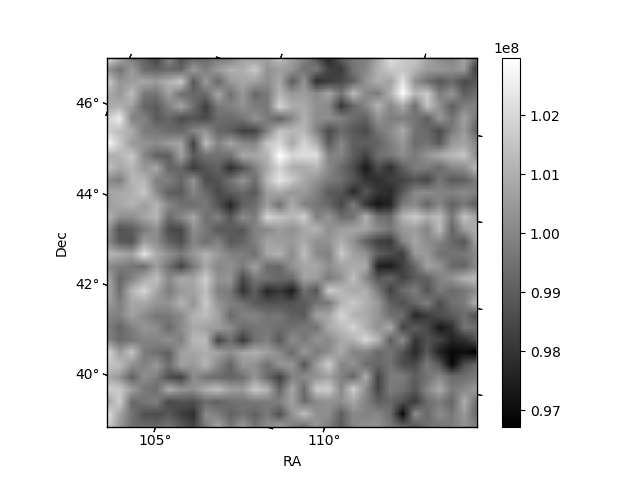
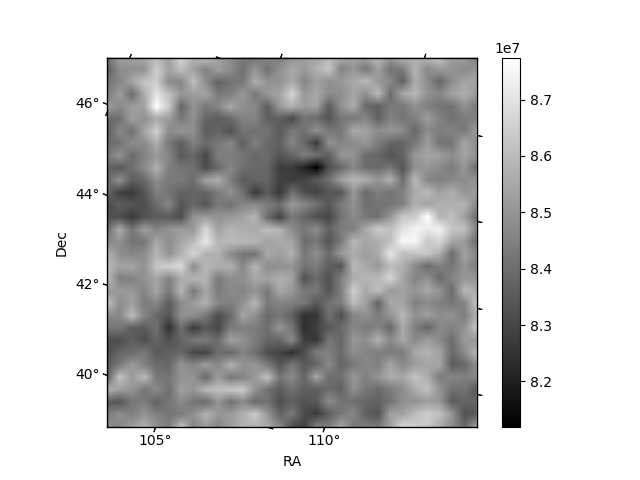
Histogram calculated using DETX and DETY for each event in the final _common_clean file
| Quadrant A |  |
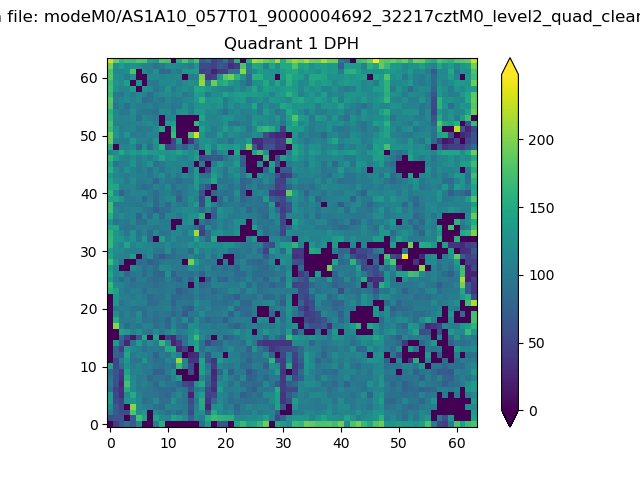 |
Quadrant B |
|---|---|---|---|
| Quadrant D |  |
 |
Quadrant C |
| Plot type | Count rate plots | Images |
|---|---|---|
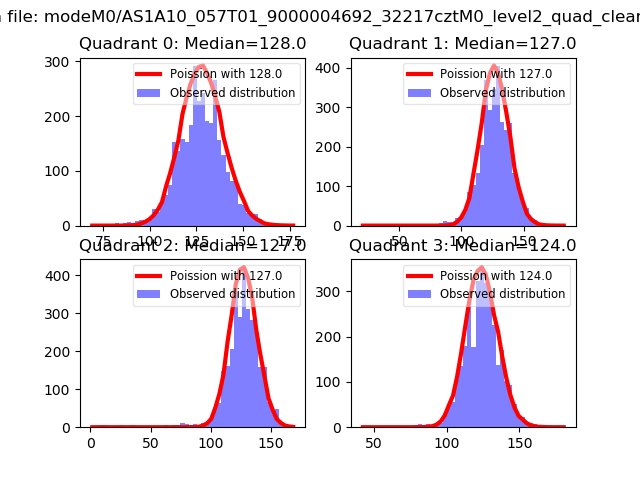
| Comparison with Poisson distribution Blue bars denote a histogram of data divided into 1 sec bins. Red curve is a Poisson curve with rate = median count rate of data. |
 |
 |
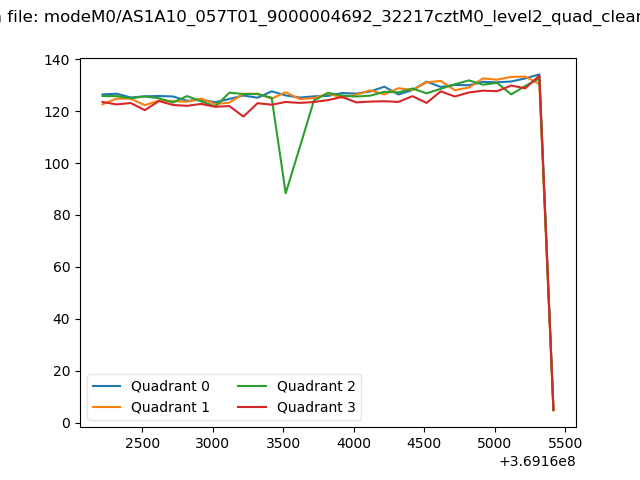
| Quadrant-wise count rates Data is divided into 100 sec bins |
 |
|
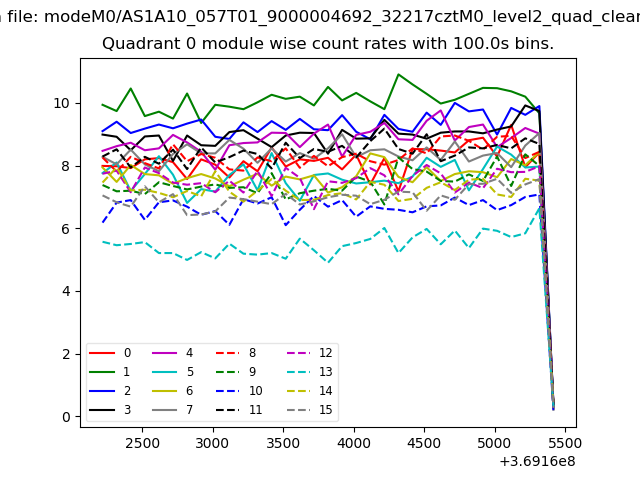
| Module-wise count rates for Quadrant A Data is divided into 100 sec bins |
 |
 |
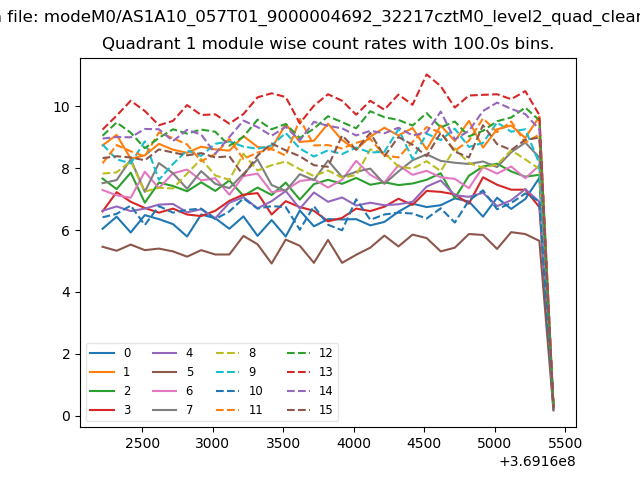
| Module-wise count rates for Quadrant B Data is divided into 100 sec bins |
 |
 |
| Module-wise count rates for Quadrant C Data is divided into 100 sec bins |
 |
 |
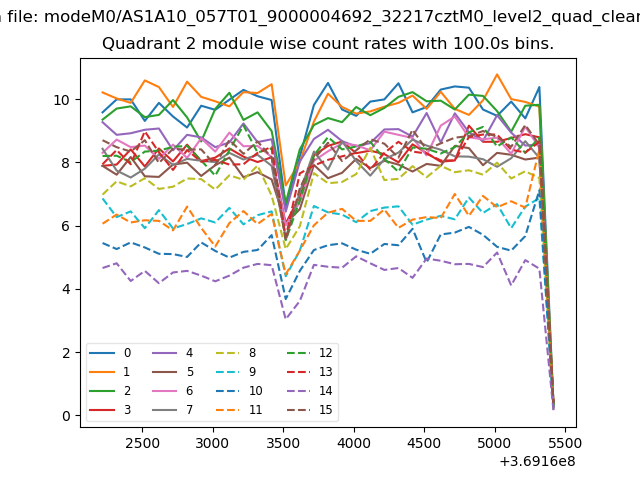
| Module-wise count rates for Quadrant D Data is divided into 100 sec bins |
 |
 |
| Parameter | Plot |
|---|---|
| CZT HV Monitor | 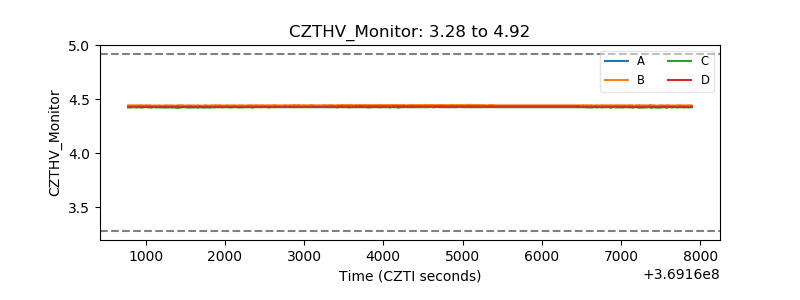 |
| D_VDD | 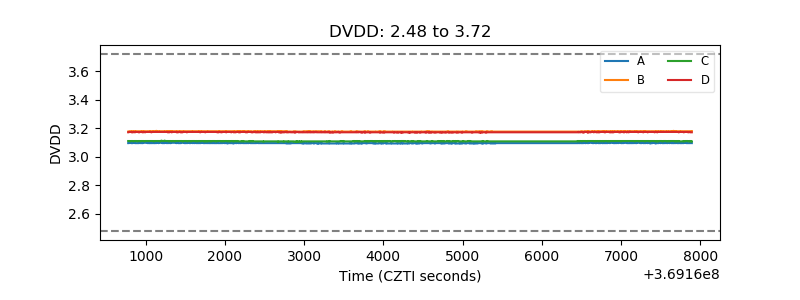 |
| Temperature 1 | 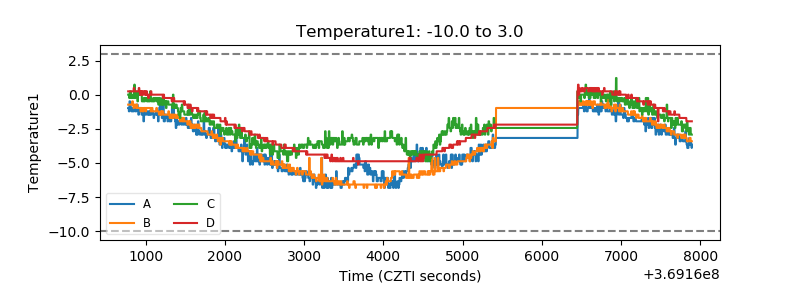 |
| Veto HV Monitor |  |
| Veto LLD | 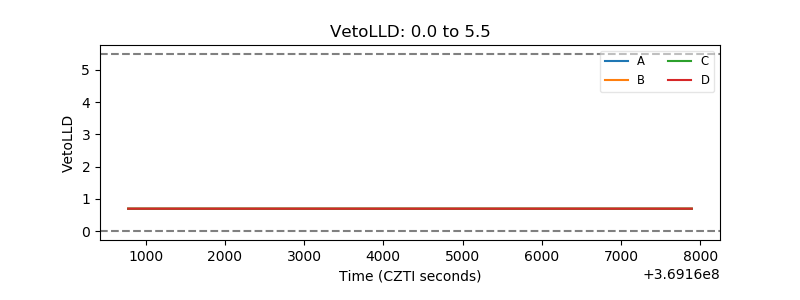 |
| Alpha Counter | 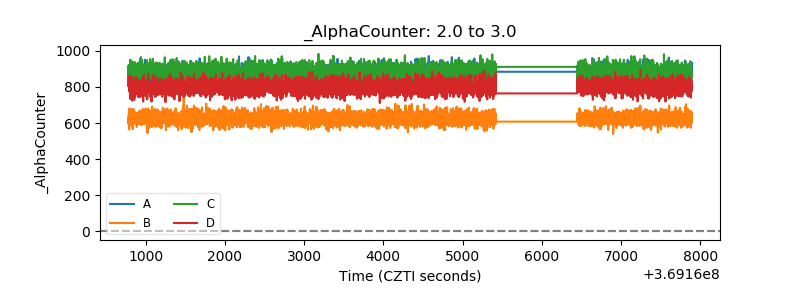 |
| _CPM_Rate | 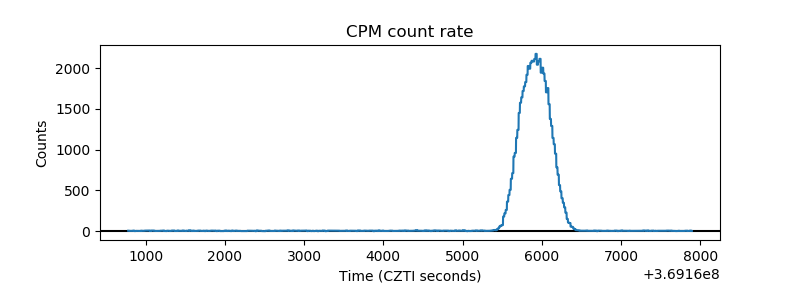 |
| CZT Counter | 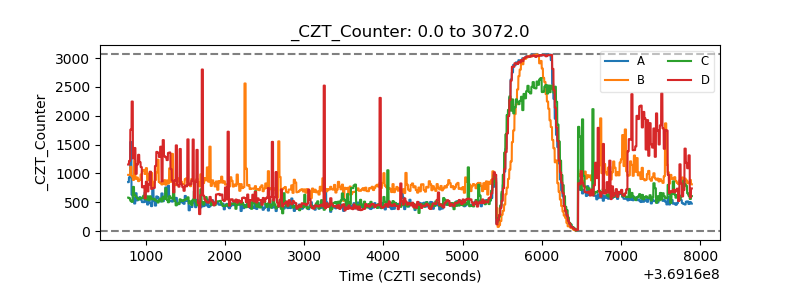 |
| +2.5 Volts monitor |  |
| +5 Volts monitor |  |
| _ROLL_ROT | 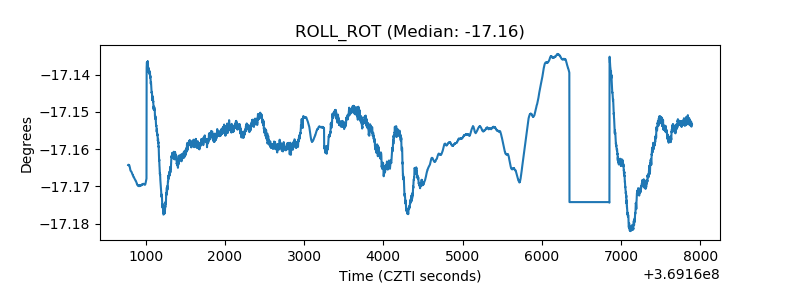 |
| _Roll_DEC | 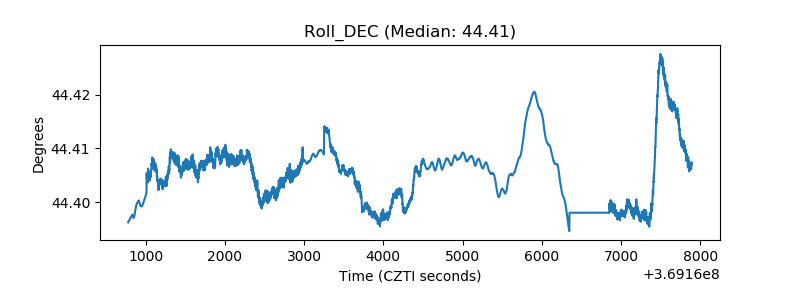 |
| _Roll_RA |  |
| Veto Counter | 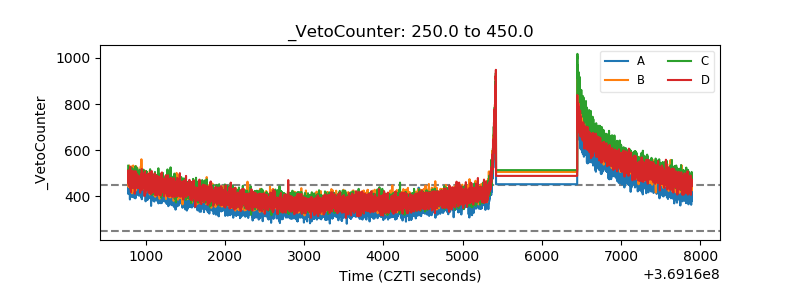 |