| Param | Original file | Final file |
|---|---|---|
| Filename | modeM0/AS1A10_057T01_9000004692_32219cztM0_level2.evt | modeM0/AS1A10_057T01_9000004692_32219cztM0_level2_quad_clean.evt |
| Size (bytes) | 606,942,720 | 76,792,320 |
| Size | 578.8 MB | 73.2 MB |
| Events in quadrant A | 3,060,962 | 488,734 |
| Events in quadrant B | 5,364,353 | 483,287 |
| Events in quadrant C | 3,687,605 | 460,796 |
| Events in quadrant D | 5,858,798 | 469,798 |
| Mode M0 | |||
|---|---|---|---|
| Quadrant | BADHDUFLAG | Total packets | Discarded packets |
| A | 0 | 13024 | 2 |
| B | 0 | 20507 | 1 |
| C | 0 | 14932 | 1 |
| D | 0 | 21672 | 1 |
| Mode SS | |||
|---|---|---|---|
| Quadrant | BADHDUFLAG | Total packets | Discarded packets |
| A | 0 | 124 | 0 |
| B | 0 | 124 | 0 |
| C | 0 | 124 | 0 |
| D | 0 | 124 | 0 |
| Mode M9 | |||
|---|---|---|---|
| Quadrant | BADHDUFLAG | Total packets | Discarded packets |
| A | 0 | 11 | 0 |
| B | 0 | 11 | 0 |
| C | 0 | 11 | 0 |
| D | 0 | 11 | 0 |
| Quadrant | Total seconds | Saturated seconds | Saturation percentage |
|---|---|---|---|
| A | 6046 | 44 | 0.727754% |
| B | 6046 | 282 | 4.664241% |
| C | 6046 | 1304 | 21.567979% |
| D | 6046 | 367 | 6.070129% |
Noise dominated data is calculated using 1-second bins in cleaned event files. If a bin has >2000 counts, and if more than 50% of those come from <1% of pixels, then it is considered to be noise-dominated and hence unusable.
| Quadrant | # 1 sec bins | Bins with >0 counts | Bins with >2000 counts | High rate bins dominated by noise | Noise dominated (total time) | Noise dominated (detector-on time) | Marked lightcurve |
|---|---|---|---|---|---|---|---|
| A | 7211 | 6047 | 0 | 0 | 0.00% | 0.00% |  |
| B | 7211 | 6047 | 90 | 90 | 1.25% | 1.49% |  |
| C | 7211 | 6047 | 3 | 3 | 0.04% | 0.05% |  |
| D | 7211 | 6047 | 159 | 159 | 2.20% | 2.63% | 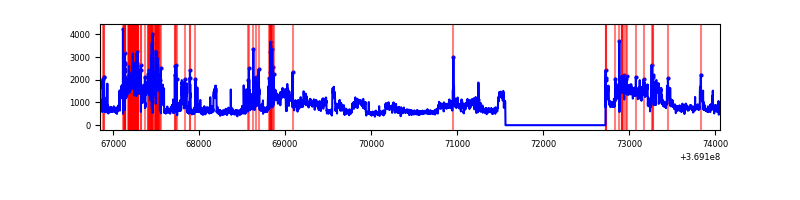 |
Top three noisy pixels from each quadrant. If the there are fewer than three noisy pixels in the level2.evt file, extra rows are filled as -1
| Pixel properties | Quadrant properties | ||||||
|---|---|---|---|---|---|---|---|
| Quadrant | DetID | PixID | Counts | Sigma | Mean | Median | Sigma |
| A | 13 | 254 | 14468 | 87.56 | 786 | 771 | 156.4 |
| A | 13 | 6 | 10413 | 61.64 | 786 | 771 | 156.4 |
| A | 15 | 174 | 7932 | 45.78 | 786 | 771 | 156.4 |
| B | 6 | 159 | 1821648 | 12407.4 | 773 | 755 | 146.8 |
| B | 5 | 172 | 306378 | 2082.49 | 773 | 755 | 146.8 |
| B | 0 | 190 | 92878 | 627.72 | 773 | 755 | 146.8 |
| C | 14 | 254 | 461563 | 2847.08 | 691 | 696 | 161.9 |
| C | 14 | 238 | 441861 | 2725.37 | 691 | 696 | 161.9 |
| C | 0 | 10 | 28919 | 174.35 | 691 | 696 | 161.9 |
| D | 8 | 195 | 2449365 | 13580.35 | 760 | 741 | 180.3 |
| D | 7 | 38 | 192275 | 1062.27 | 760 | 741 | 180.3 |
| D | 12 | 218 | 117555 | 647.86 | 760 | 741 | 180.3 |
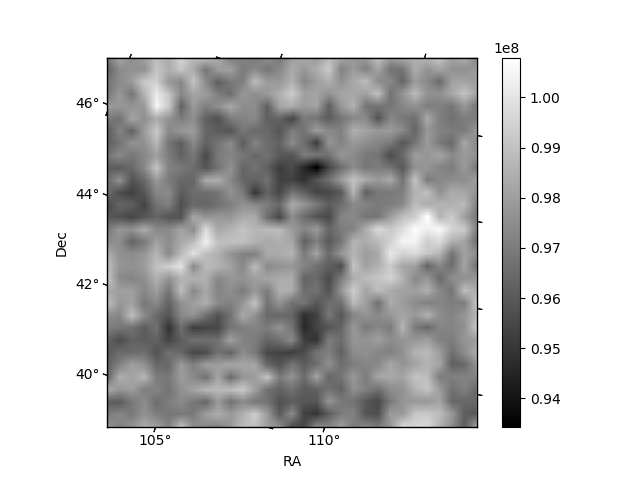
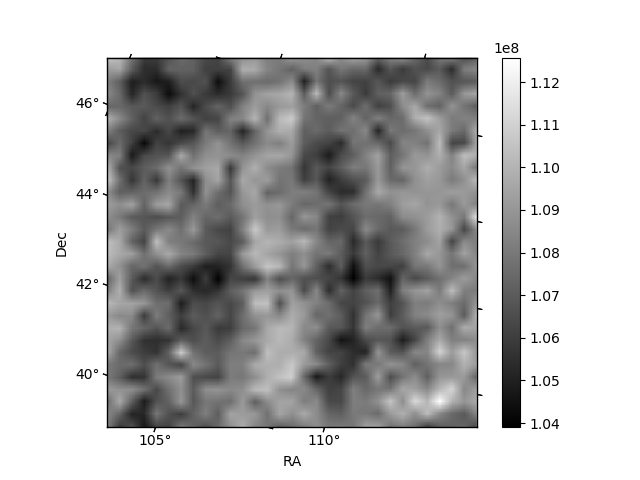
Histogram calculated using DETX and DETY for each event in the final _common_clean file
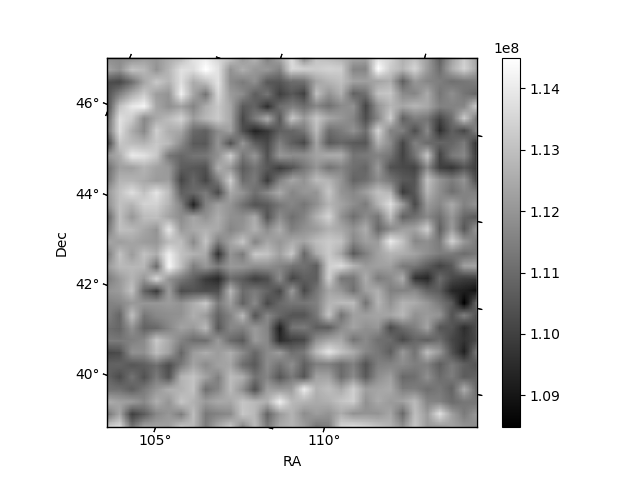
| Quadrant A | 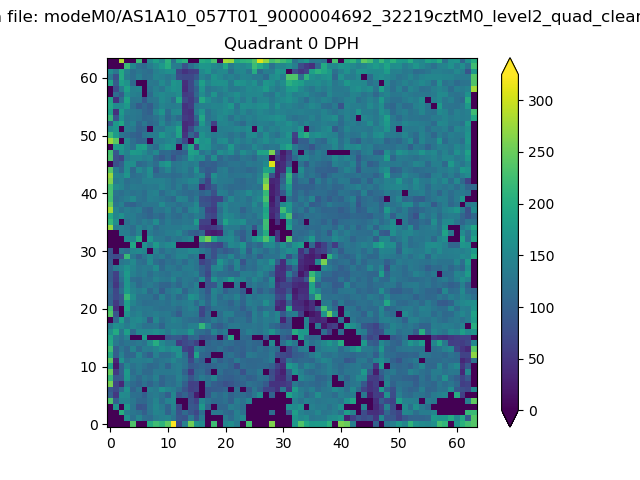 |
 |
Quadrant B |
|---|---|---|---|
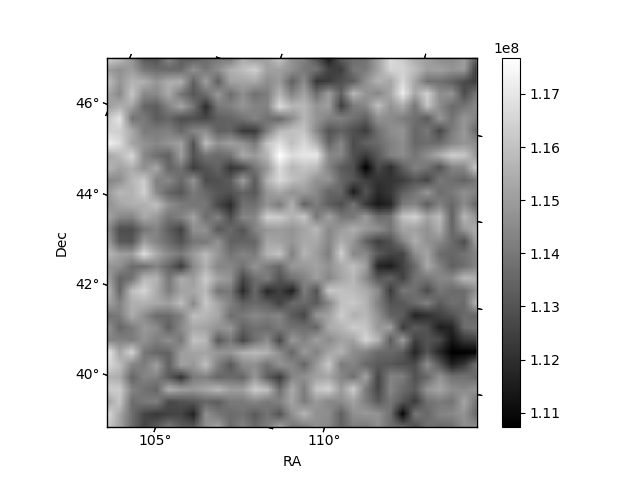
| Quadrant D | 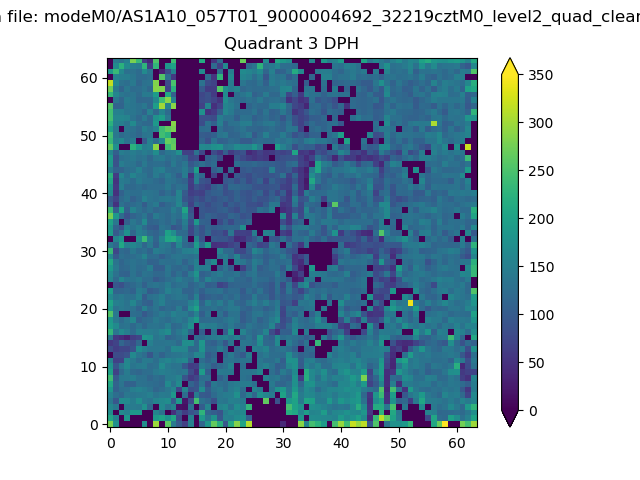 |
 |
Quadrant C |
| Plot type | Count rate plots | Images |
|---|---|---|
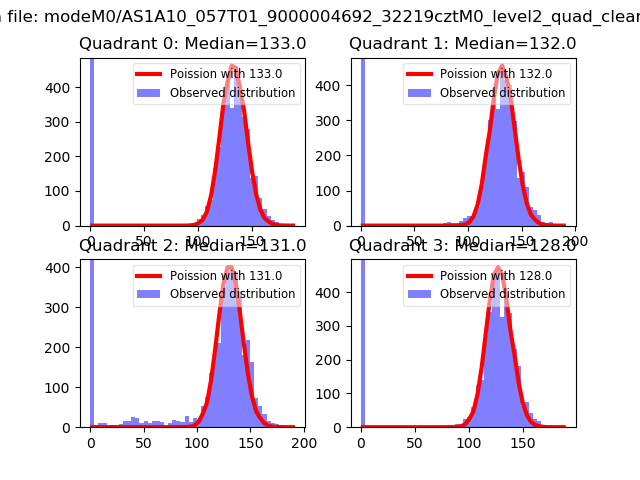
| Comparison with Poisson distribution Blue bars denote a histogram of data divided into 1 sec bins. Red curve is a Poisson curve with rate = median count rate of data. |
 |
 |
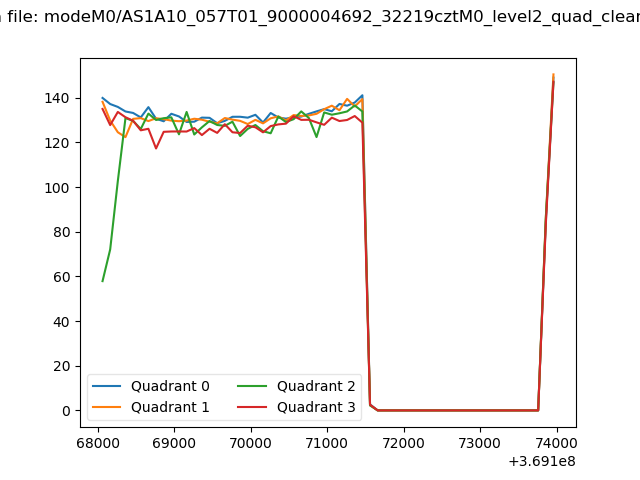
| Quadrant-wise count rates Data is divided into 100 sec bins |
 |
|
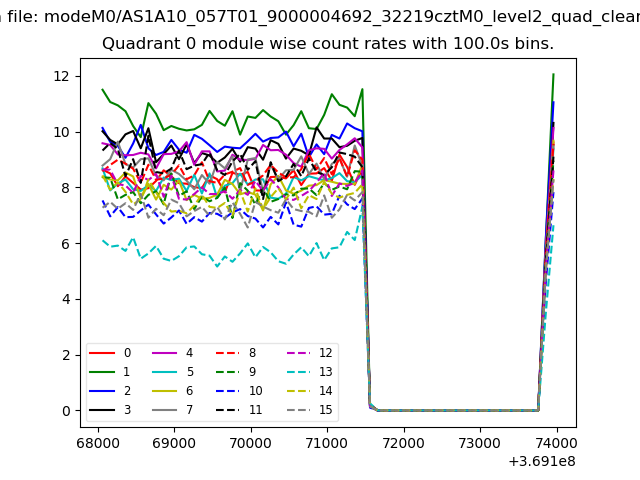
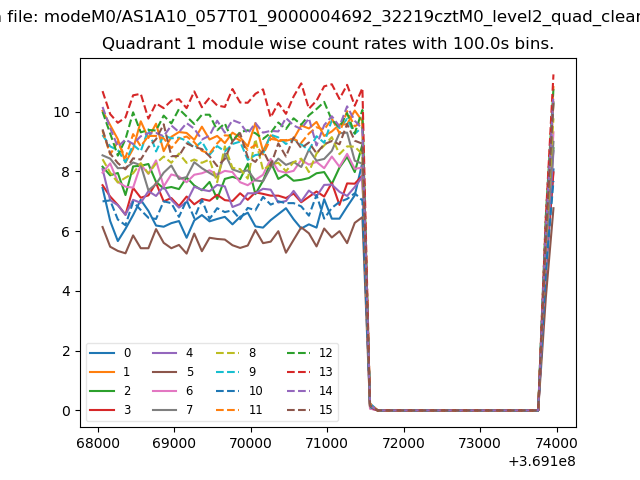
| Module-wise count rates for Quadrant A Data is divided into 100 sec bins |
 |
 |
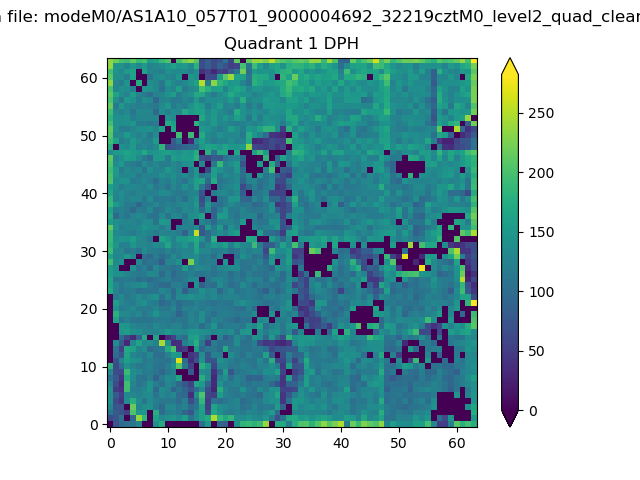
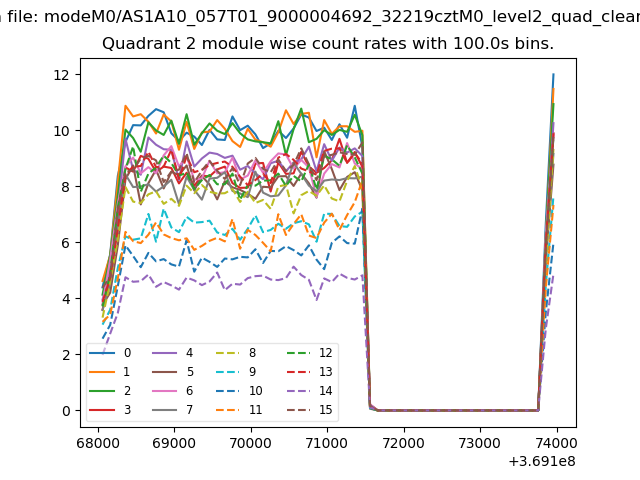
| Module-wise count rates for Quadrant B Data is divided into 100 sec bins |
 |
 |
| Module-wise count rates for Quadrant C Data is divided into 100 sec bins |
 |
 |
| Module-wise count rates for Quadrant D Data is divided into 100 sec bins |
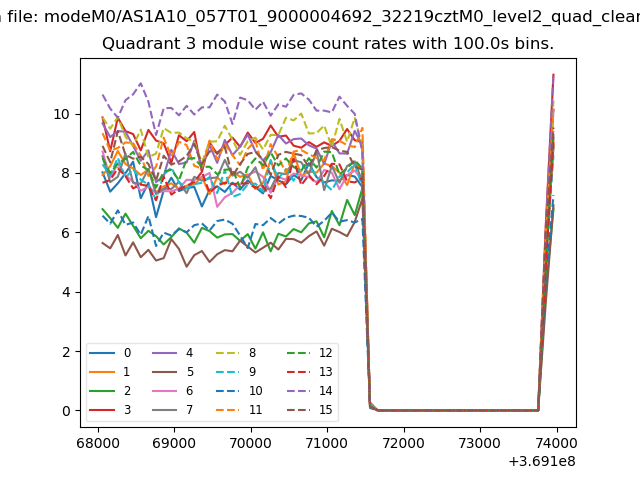 |
 |
| Parameter | Plot |
|---|---|
| CZT HV Monitor | 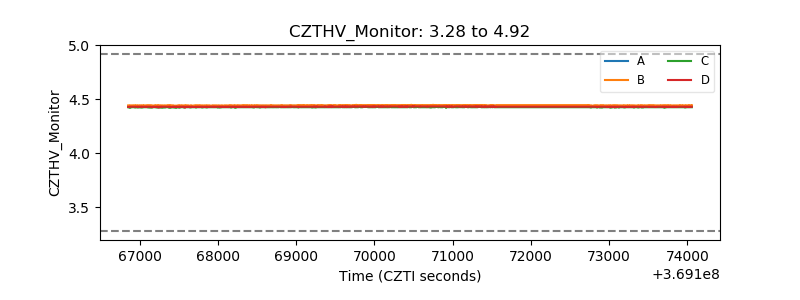 |
| D_VDD | 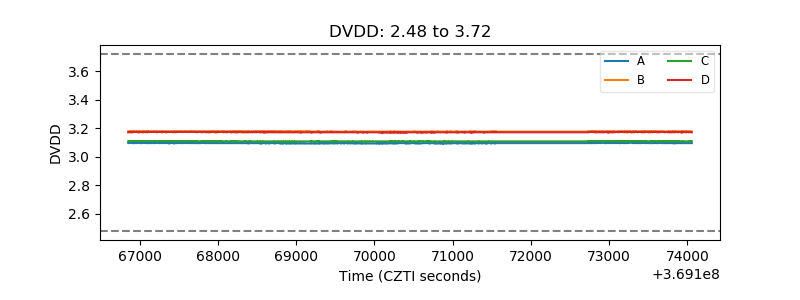 |
| Temperature 1 | 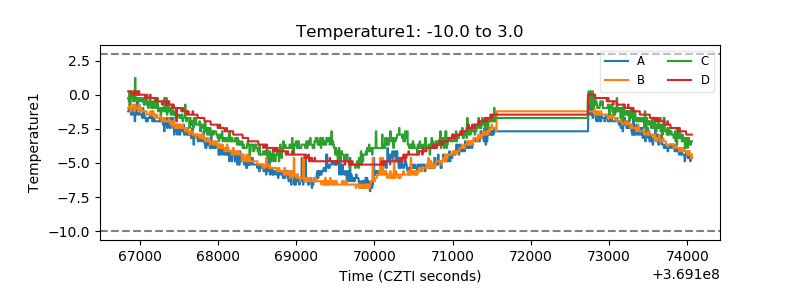 |
| Veto HV Monitor | 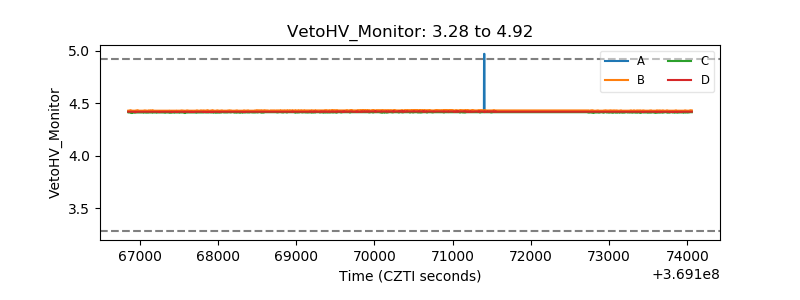 |
| Veto LLD | 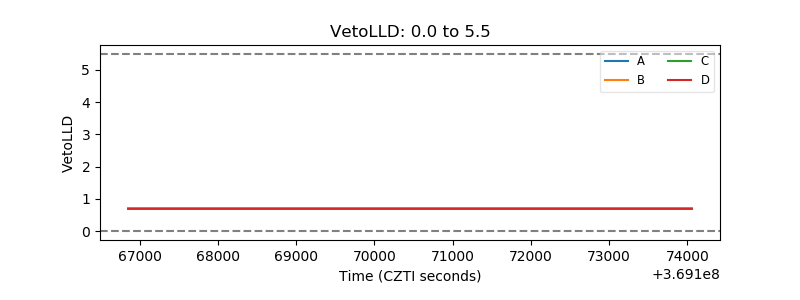 |
| Alpha Counter | 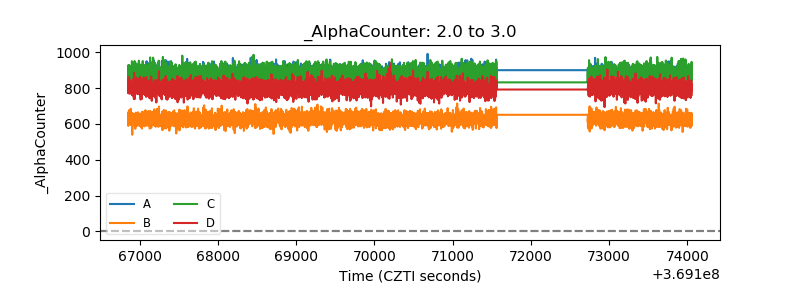 |
| _CPM_Rate | 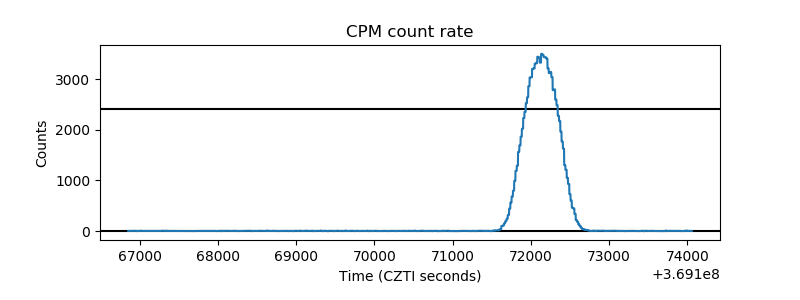 |
| CZT Counter | 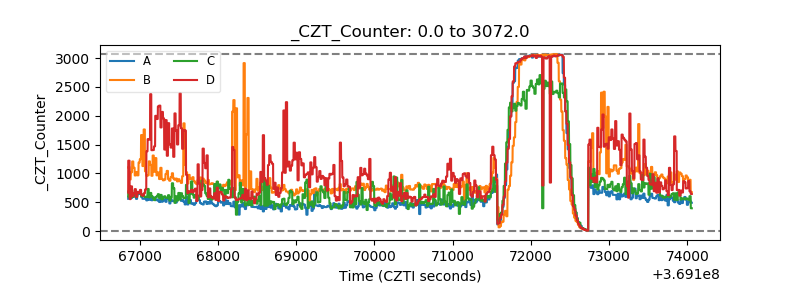 |
| +2.5 Volts monitor |  |
| +5 Volts monitor |  |
| _ROLL_ROT | 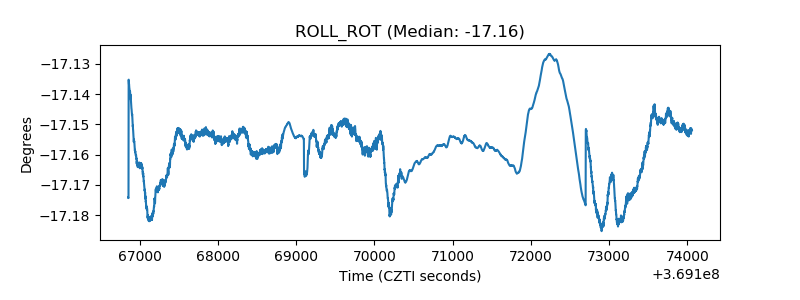 |
| _Roll_DEC | 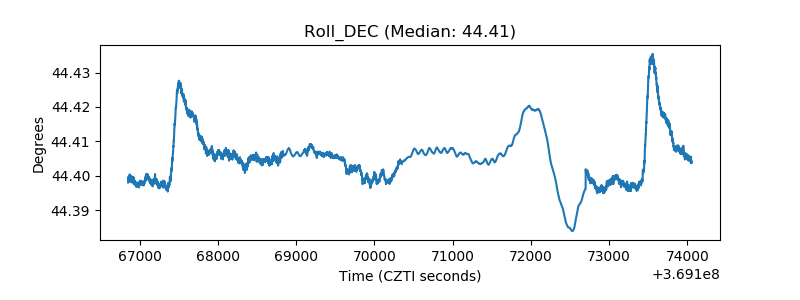 |
| _Roll_RA | 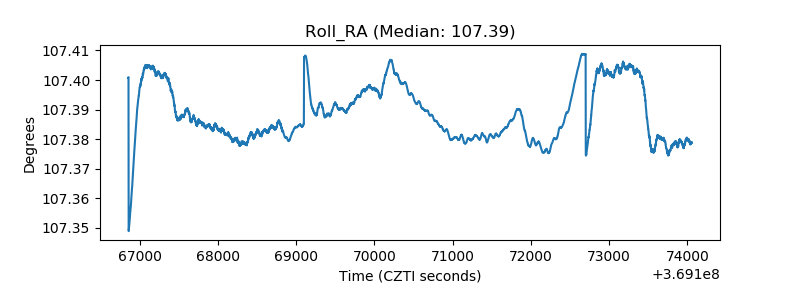 |
| Veto Counter | 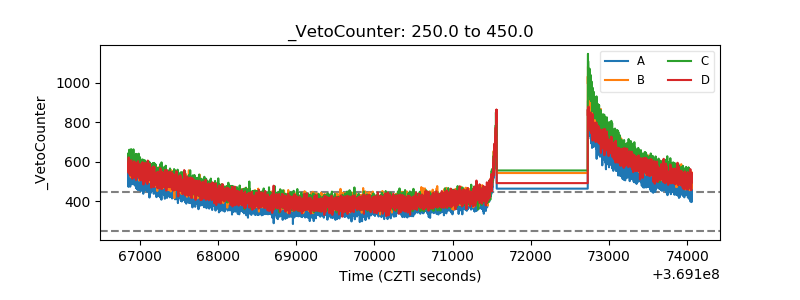 |