| Param | Original file | Final file |
|---|---|---|
| Filename | modeM0/AS1A10_057T01_9000004692_32220cztM0_level2.evt | modeM0/AS1A10_057T01_9000004692_32220cztM0_level2_quad_clean.evt |
| Size (bytes) | 623,358,720 | 93,712,320 |
| Size | 594.5 MB | 89.4 MB |
| Events in quadrant A | 3,273,653 | 612,079 |
| Events in quadrant B | 5,573,550 | 614,807 |
| Events in quadrant C | 3,963,666 | 590,341 |
| Events in quadrant D | 5,646,602 | 586,059 |
| Mode M0 | |||
|---|---|---|---|
| Quadrant | BADHDUFLAG | Total packets | Discarded packets |
| A | 0 | 13819 | 2 |
| B | 0 | 21119 | 1 |
| C | 0 | 15830 | 1 |
| D | 0 | 21047 | 1 |
| Mode SS | |||
|---|---|---|---|
| Quadrant | BADHDUFLAG | Total packets | Discarded packets |
| A | 0 | 126 | 0 |
| B | 0 | 126 | 0 |
| C | 0 | 126 | 0 |
| D | 0 | 126 | 0 |
| Mode M9 | |||
|---|---|---|---|
| Quadrant | BADHDUFLAG | Total packets | Discarded packets |
| A | 0 | 13 | 0 |
| B | 0 | 13 | 0 |
| C | 0 | 13 | 0 |
| D | 0 | 13 | 0 |
| Quadrant | Total seconds | Saturated seconds | Saturation percentage |
|---|---|---|---|
| A | 6228 | 57 | 0.915222% |
| B | 6228 | 247 | 3.965960% |
| C | 6228 | 1062 | 17.052023% |
| D | 6228 | 249 | 3.998073% |
Noise dominated data is calculated using 1-second bins in cleaned event files. If a bin has >2000 counts, and if more than 50% of those come from <1% of pixels, then it is considered to be noise-dominated and hence unusable.
| Quadrant | # 1 sec bins | Bins with >0 counts | Bins with >2000 counts | High rate bins dominated by noise | Noise dominated (total time) | Noise dominated (detector-on time) | Marked lightcurve |
|---|---|---|---|---|---|---|---|
| A | 7483 | 6229 | 0 | 0 | 0.00% | 0.00% |  |
| B | 7483 | 6229 | 58 | 58 | 0.78% | 0.93% |  |
| C | 7483 | 6229 | 10 | 10 | 0.13% | 0.16% | 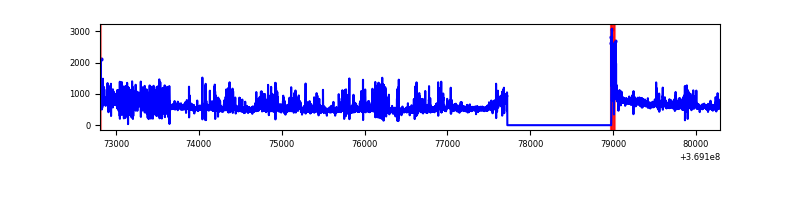 |
| D | 7483 | 6229 | 61 | 61 | 0.82% | 0.98% | 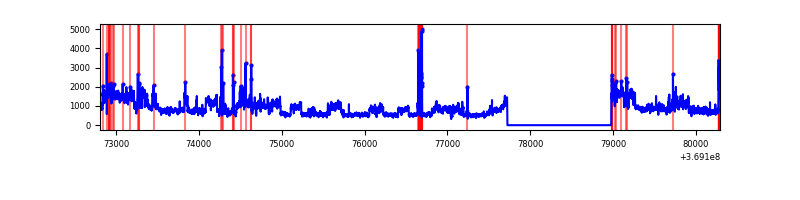 |
Top three noisy pixels from each quadrant. If the there are fewer than three noisy pixels in the level2.evt file, extra rows are filled as -1
| Pixel properties | Quadrant properties | ||||||
|---|---|---|---|---|---|---|---|
| Quadrant | DetID | PixID | Counts | Sigma | Mean | Median | Sigma |
| A | 13 | 254 | 12423 | 69.61 | 843 | 829 | 166.5 |
| A | 12 | 189 | 11860 | 66.23 | 843 | 829 | 166.5 |
| A | 13 | 6 | 7958 | 42.8 | 843 | 829 | 166.5 |
| B | 6 | 159 | 1852732 | 11856.24 | 836 | 817 | 156.2 |
| B | 5 | 172 | 235144 | 1500.2 | 836 | 817 | 156.2 |
| B | 0 | 229 | 93238 | 591.69 | 836 | 817 | 156.2 |
| C | 14 | 238 | 408695 | 2272.8 | 776 | 782 | 179.5 |
| C | 14 | 254 | 390214 | 2169.83 | 776 | 782 | 179.5 |
| C | 0 | 10 | 49661 | 272.34 | 776 | 782 | 179.5 |
| D | 8 | 195 | 2251165 | 11535.93 | 823 | 803 | 195.1 |
| D | 12 | 218 | 114717 | 583.95 | 823 | 803 | 195.1 |
| D | 13 | 249 | 61221 | 309.72 | 823 | 803 | 195.1 |
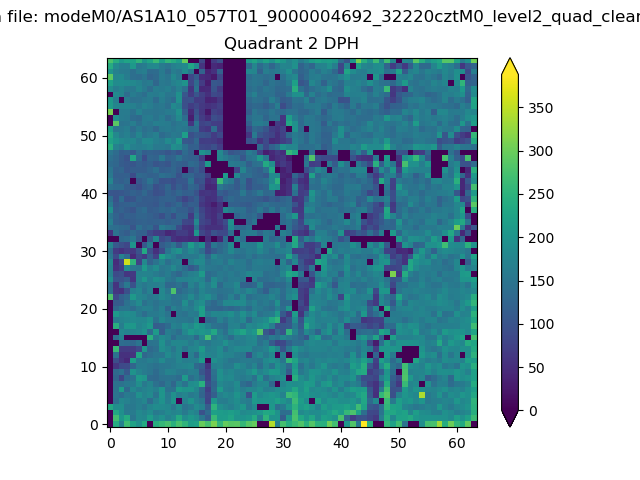
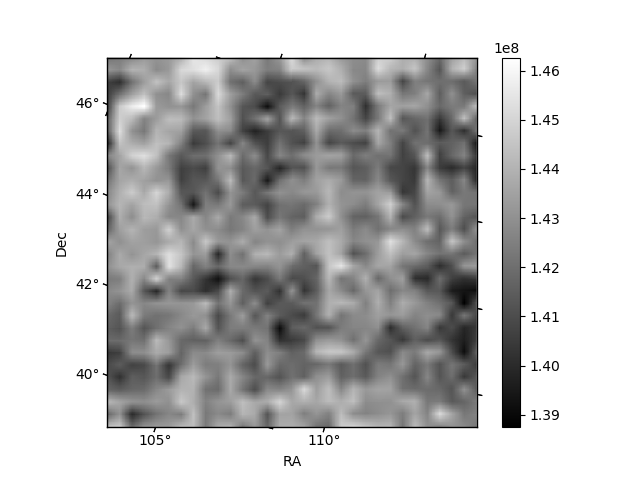
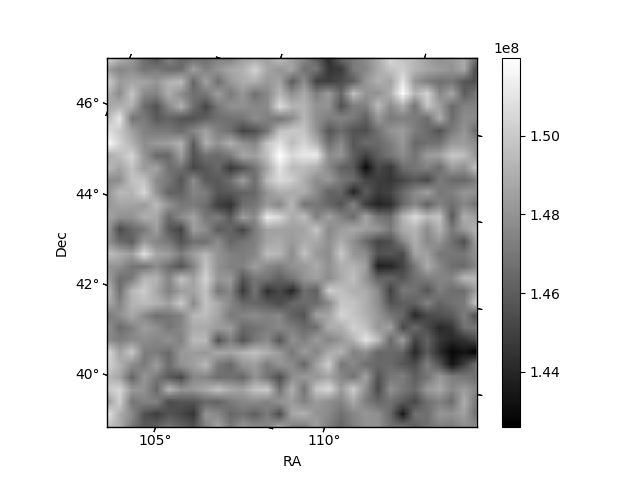
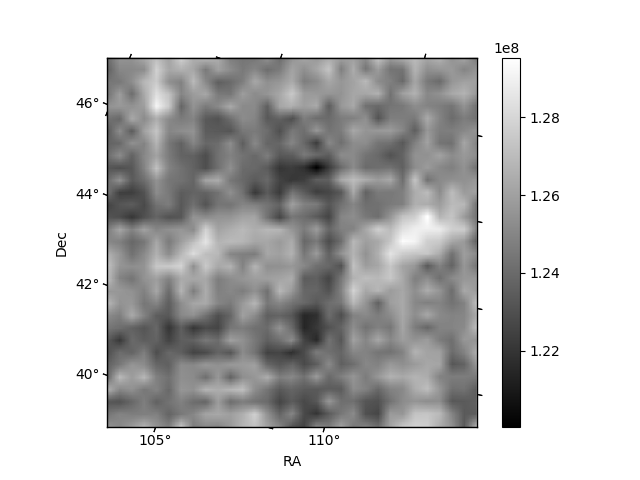
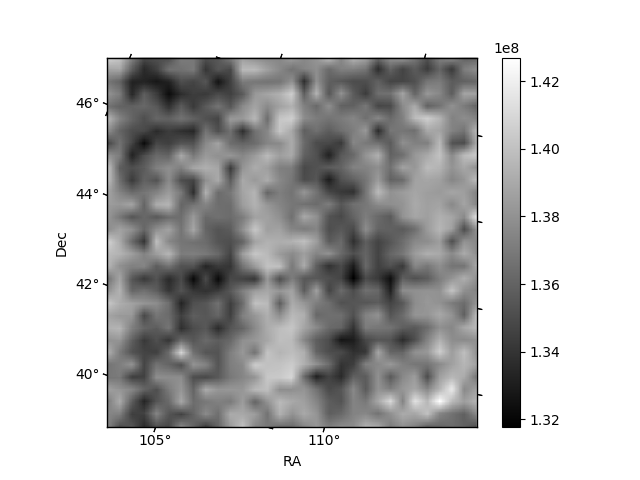
Histogram calculated using DETX and DETY for each event in the final _common_clean file
| Quadrant A | 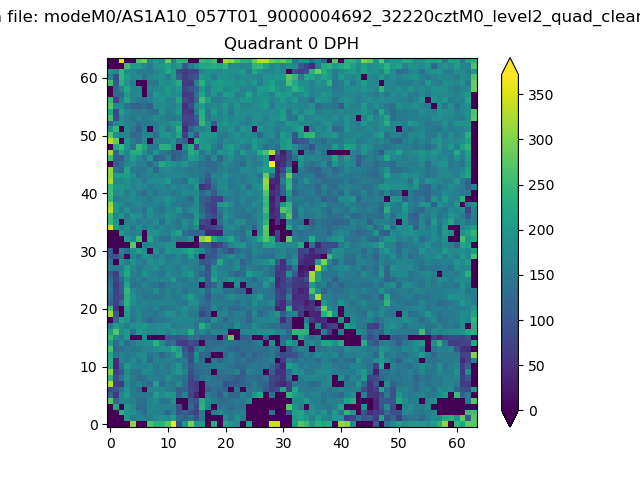 |
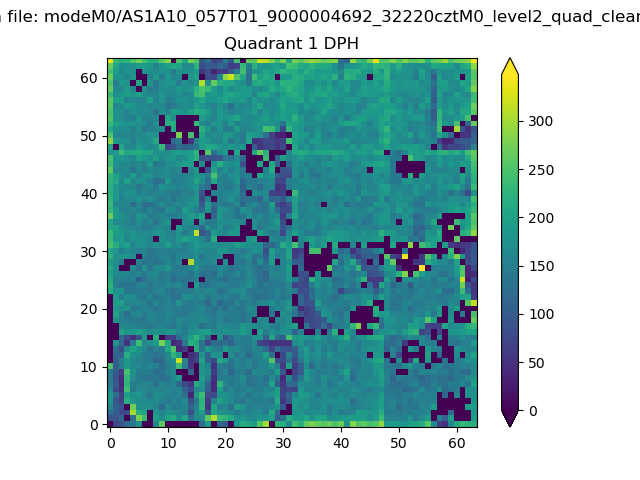 |
Quadrant B |
|---|---|---|---|
| Quadrant D |  |
 |
Quadrant C |
| Plot type | Count rate plots | Images |
|---|---|---|
| Comparison with Poisson distribution Blue bars denote a histogram of data divided into 1 sec bins. Red curve is a Poisson curve with rate = median count rate of data. |
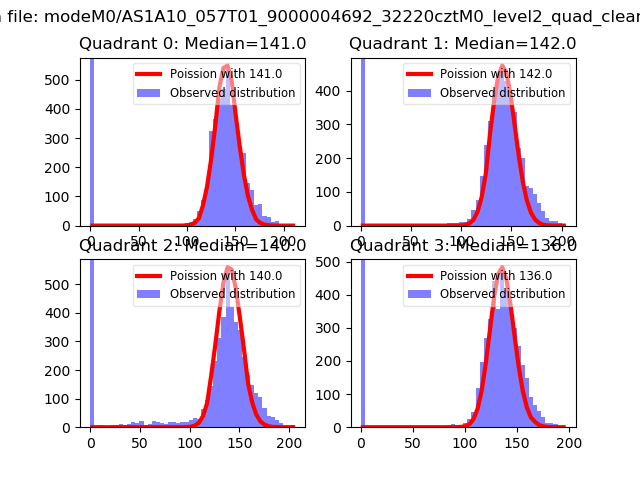 |
 |
| Quadrant-wise count rates Data is divided into 100 sec bins |
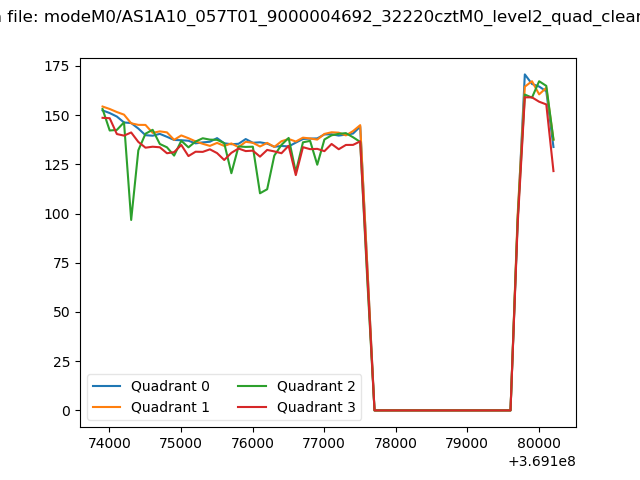 |
|
| Module-wise count rates for Quadrant A Data is divided into 100 sec bins |
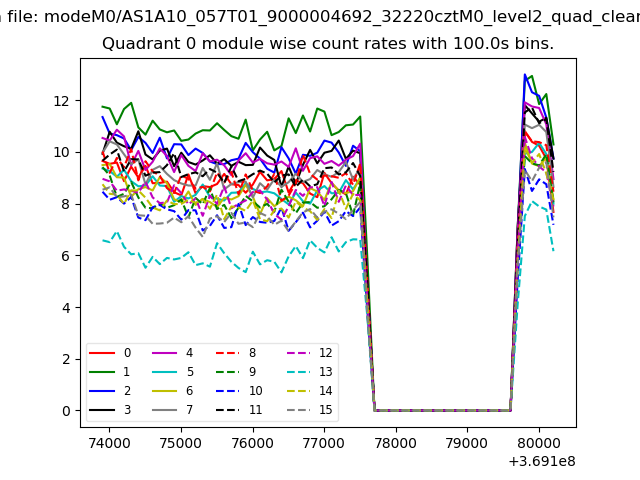 |
 |
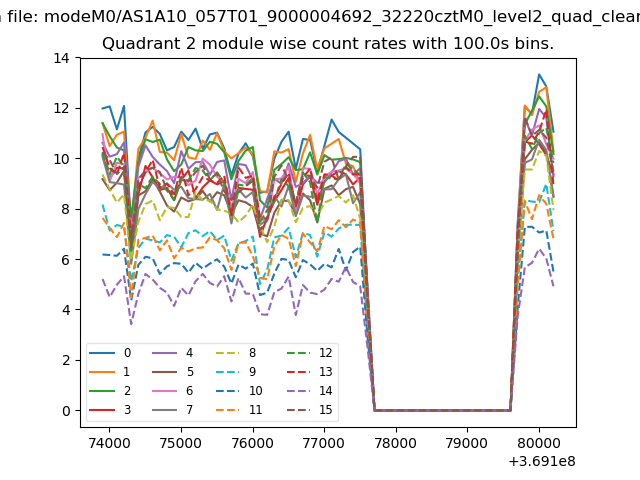
| Module-wise count rates for Quadrant B Data is divided into 100 sec bins |
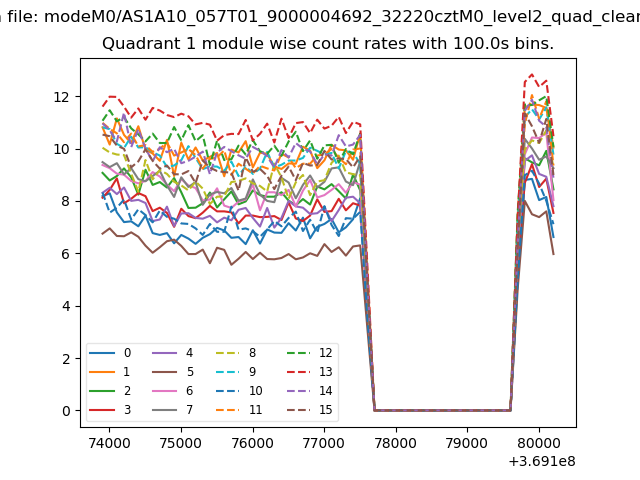 |
 |
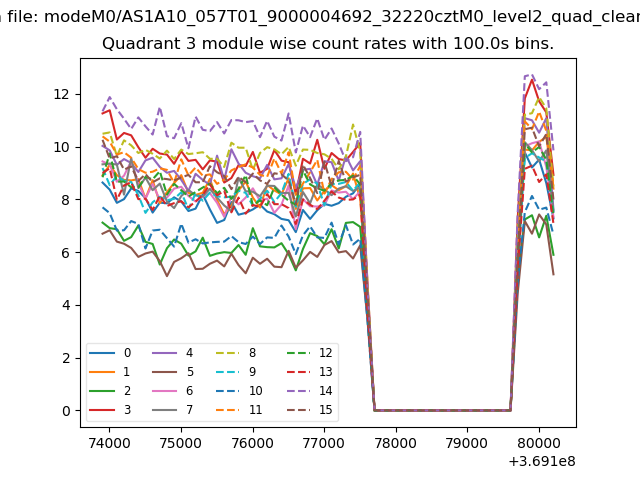
| Module-wise count rates for Quadrant C Data is divided into 100 sec bins |
 |
 |
| Module-wise count rates for Quadrant D Data is divided into 100 sec bins |
 |
 |
| Parameter | Plot |
|---|---|
| CZT HV Monitor | 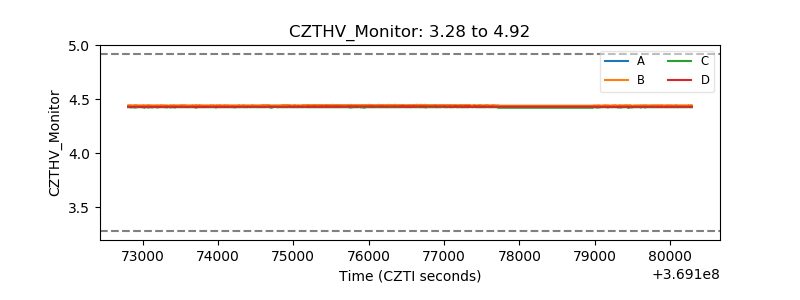 |
| D_VDD | 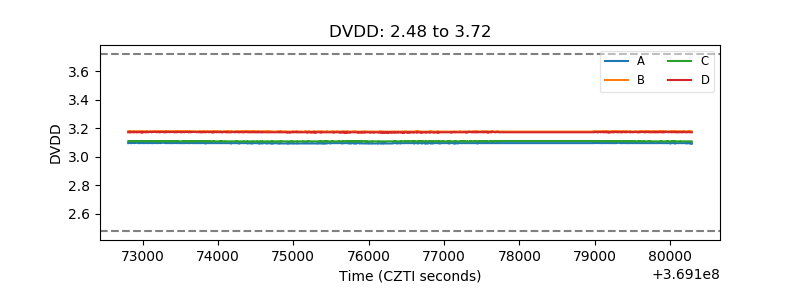 |
| Temperature 1 | 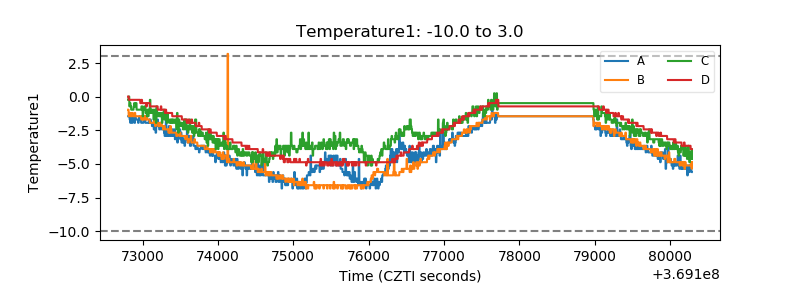 |
| Veto HV Monitor | 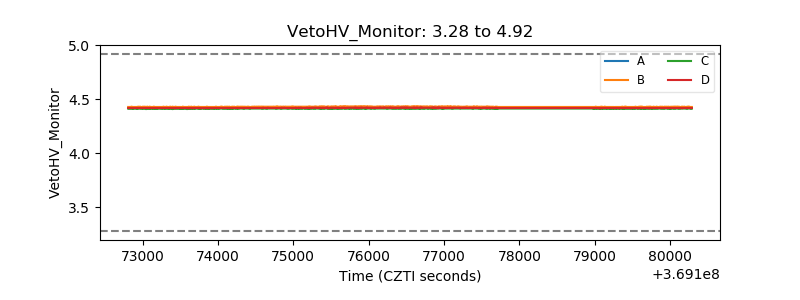 |
| Veto LLD |  |
| Alpha Counter | 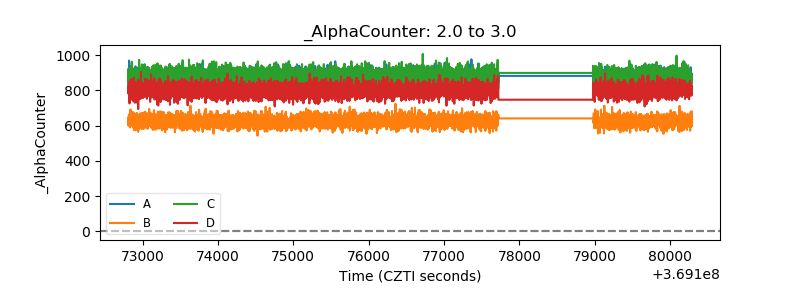 |
| _CPM_Rate | 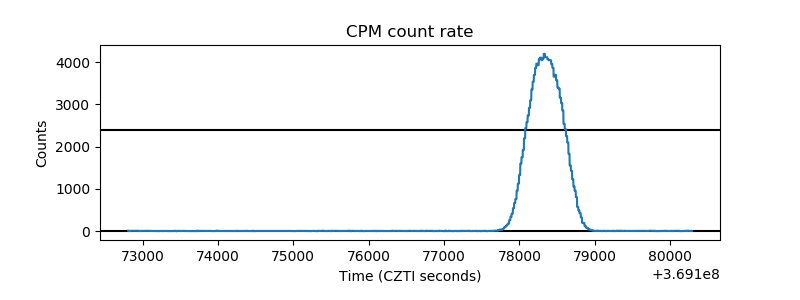 |
| CZT Counter | 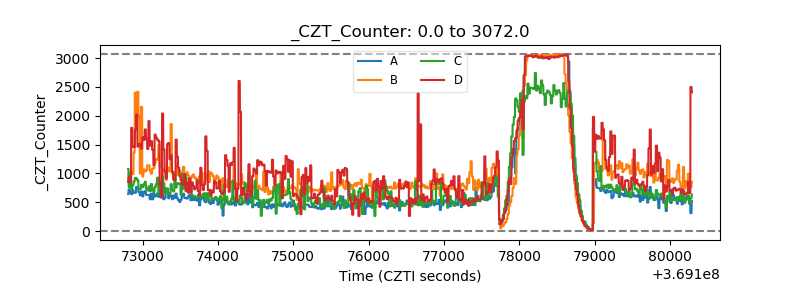 |
| +2.5 Volts monitor |  |
| +5 Volts monitor |  |
| _ROLL_ROT | 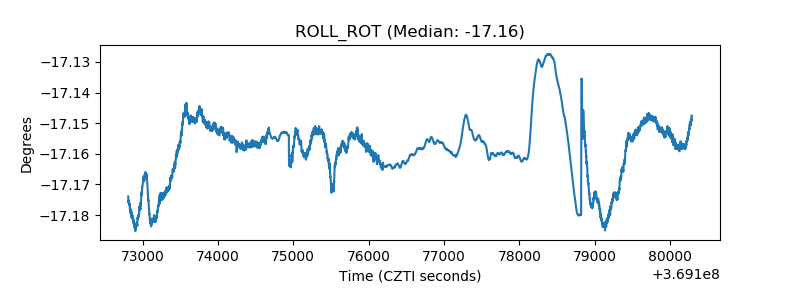 |
| _Roll_DEC | 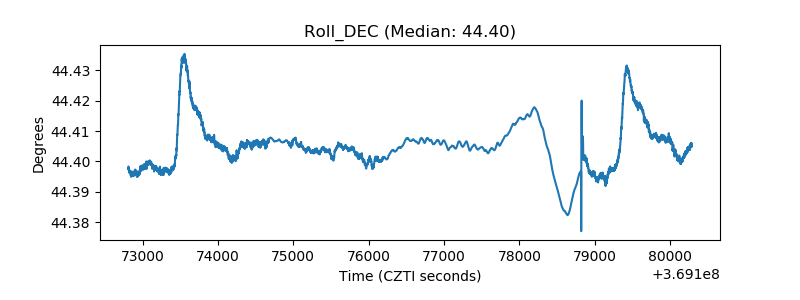 |
| _Roll_RA | 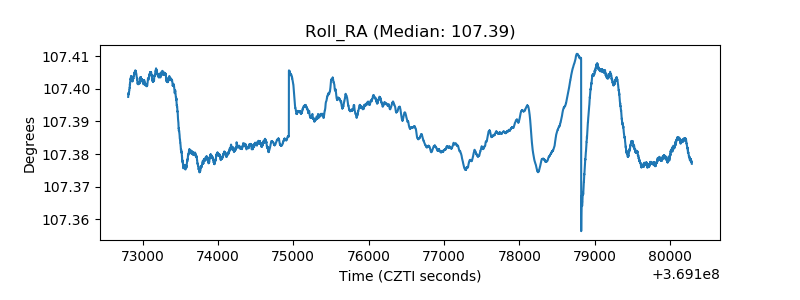 |
| Veto Counter | 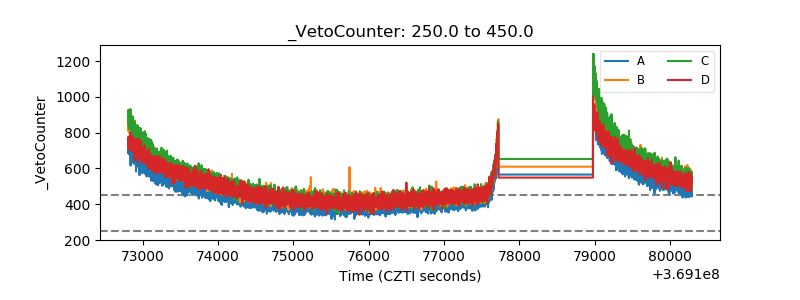 |