| Param | Original file | Final file |
|---|---|---|
| Filename | modeM0/AS1A10_057T01_9000004692_32221cztM0_level2.evt | modeM0/AS1A10_057T01_9000004692_32221cztM0_level2_quad_clean.evt |
| Size (bytes) | 606,928,320 | 103,783,680 |
| Size | 578.8 MB | 99.0 MB |
| Events in quadrant A | 3,250,144 | 693,783 |
| Events in quadrant B | 5,579,595 | 699,030 |
| Events in quadrant C | 3,891,638 | 682,694 |
| Events in quadrant D | 5,244,770 | 639,119 |
| Mode M0 | |||
|---|---|---|---|
| Quadrant | BADHDUFLAG | Total packets | Discarded packets |
| A | 0 | 13609 | 3 |
| B | 0 | 20941 | 2 |
| C | 0 | 15620 | 2 |
| D | 0 | 19771 | 2 |
| Mode SS | |||
|---|---|---|---|
| Quadrant | BADHDUFLAG | Total packets | Discarded packets |
| A | 0 | 124 | 0 |
| B | 0 | 124 | 0 |
| C | 0 | 124 | 0 |
| D | 0 | 124 | 0 |
| Mode M9 | |||
|---|---|---|---|
| Quadrant | BADHDUFLAG | Total packets | Discarded packets |
| A | 0 | 16 | 0 |
| B | 0 | 16 | 0 |
| C | 0 | 16 | 0 |
| D | 0 | 17 | 0 |
| Quadrant | Total seconds | Saturated seconds | Saturation percentage |
|---|---|---|---|
| A | 6135 | 37 | 0.603097% |
| B | 6135 | 307 | 5.004075% |
| C | 6135 | 598 | 9.747351% |
| D | 6135 | 474 | 7.726161% |
Noise dominated data is calculated using 1-second bins in cleaned event files. If a bin has >2000 counts, and if more than 50% of those come from <1% of pixels, then it is considered to be noise-dominated and hence unusable.
| Quadrant | # 1 sec bins | Bins with >0 counts | Bins with >2000 counts | High rate bins dominated by noise | Noise dominated (total time) | Noise dominated (detector-on time) | Marked lightcurve |
|---|---|---|---|---|---|---|---|
| A | 7505 | 6136 | 0 | 0 | 0.00% | 0.00% | 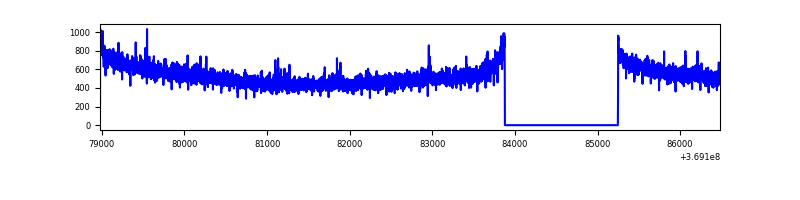 |
| B | 7505 | 6135 | 110 | 110 | 1.47% | 1.79% | 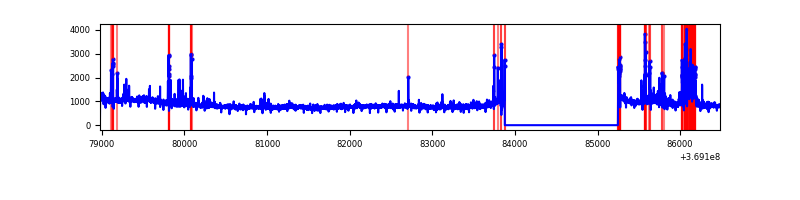 |
| C | 7505 | 6136 | 38 | 38 | 0.51% | 0.62% |  |
| D | 7504 | 6135 | 236 | 236 | 3.14% | 3.85% | 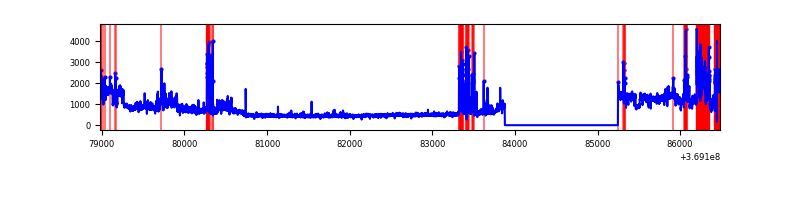 |
Top three noisy pixels from each quadrant. If the there are fewer than three noisy pixels in the level2.evt file, extra rows are filled as -1
| Pixel properties | Quadrant properties | ||||||
|---|---|---|---|---|---|---|---|
| Quadrant | DetID | PixID | Counts | Sigma | Mean | Median | Sigma |
| A | 13 | 254 | 12617 | 71.83 | 835 | 818 | 164.3 |
| A | 2 | 79 | 11180 | 63.08 | 835 | 818 | 164.3 |
| A | 13 | 6 | 11141 | 62.84 | 835 | 818 | 164.3 |
| B | 6 | 159 | 1775305 | 11570.28 | 828 | 810 | 153.4 |
| B | 4 | 80 | 226364 | 1470.69 | 828 | 810 | 153.4 |
| B | 5 | 172 | 178077 | 1155.84 | 828 | 810 | 153.4 |
| C | 14 | 238 | 284037 | 1536.36 | 799 | 808 | 184.4 |
| C | 14 | 254 | 211665 | 1143.79 | 799 | 808 | 184.4 |
| C | 0 | 10 | 171358 | 925.14 | 799 | 808 | 184.4 |
| D | 8 | 195 | 1417966 | 7519.28 | 792 | 773 | 188.5 |
| D | 13 | 249 | 315745 | 1671.16 | 792 | 773 | 188.5 |
| D | 7 | 238 | 224156 | 1185.22 | 792 | 773 | 188.5 |
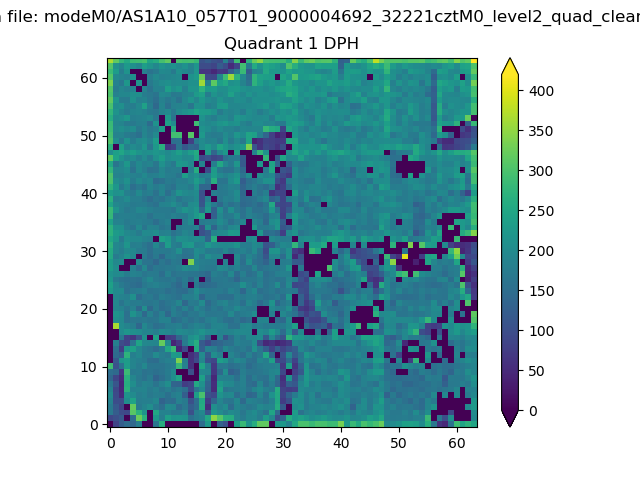
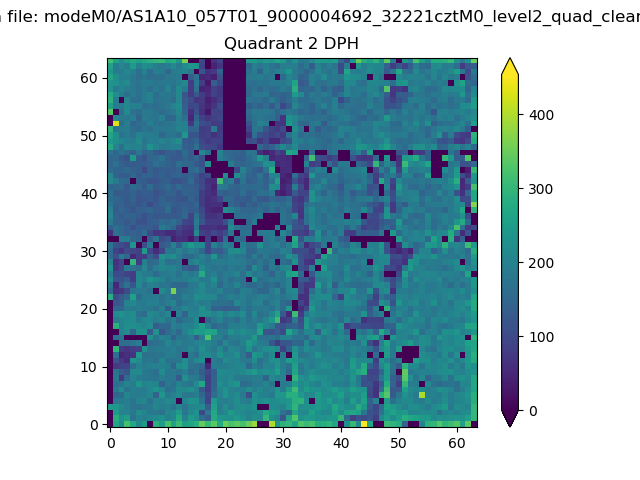
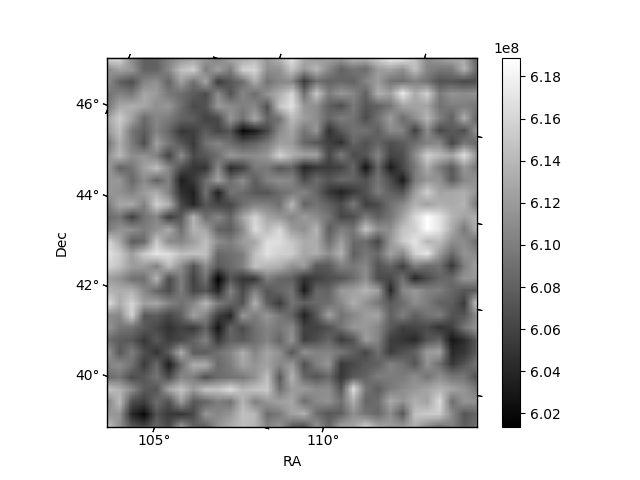
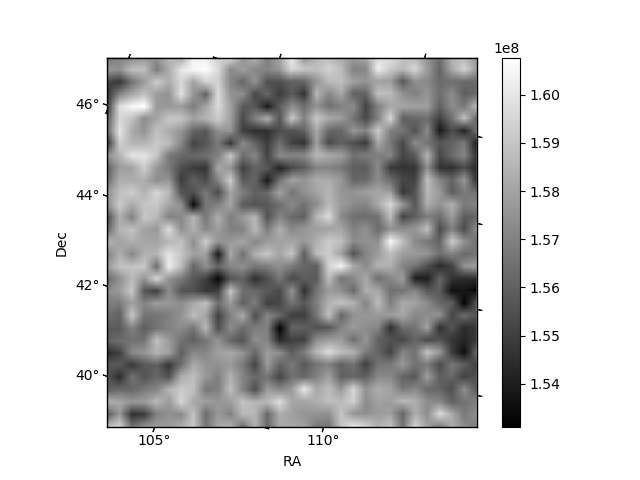
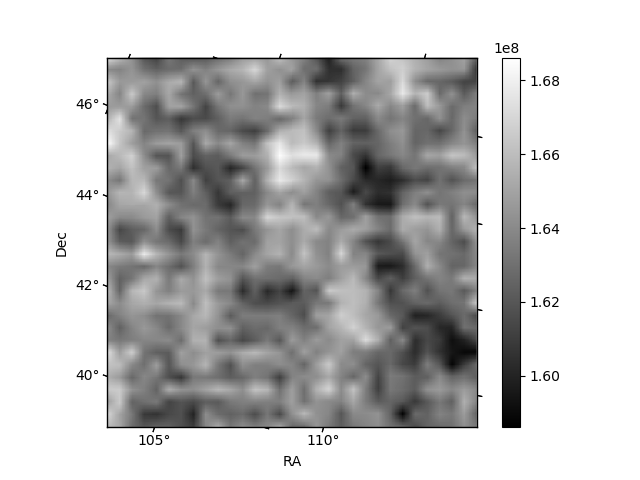
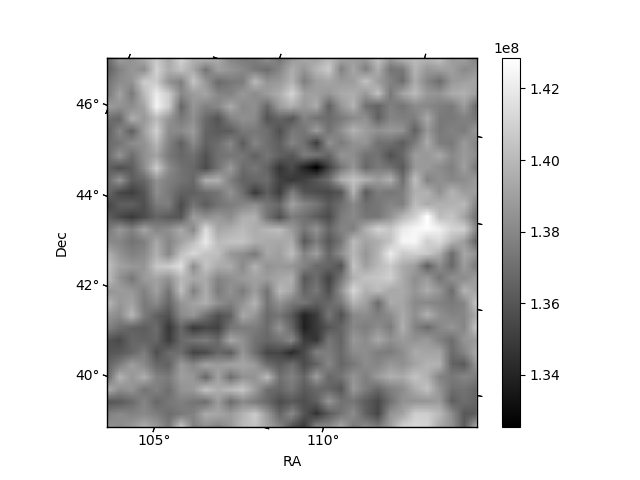
Histogram calculated using DETX and DETY for each event in the final _common_clean file
| Quadrant A | 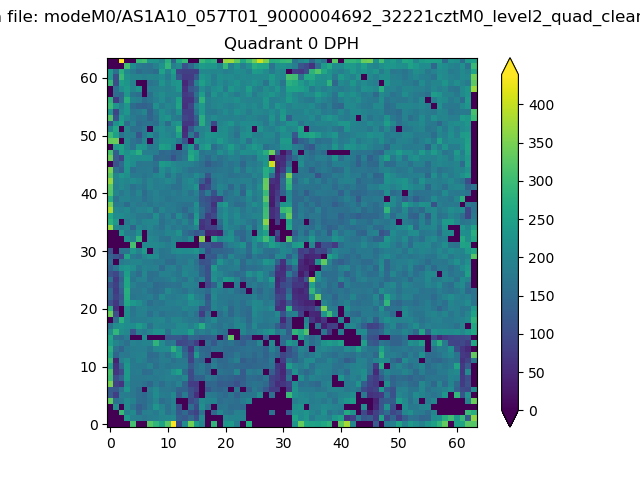 |
 |
Quadrant B |
|---|---|---|---|
| Quadrant D | 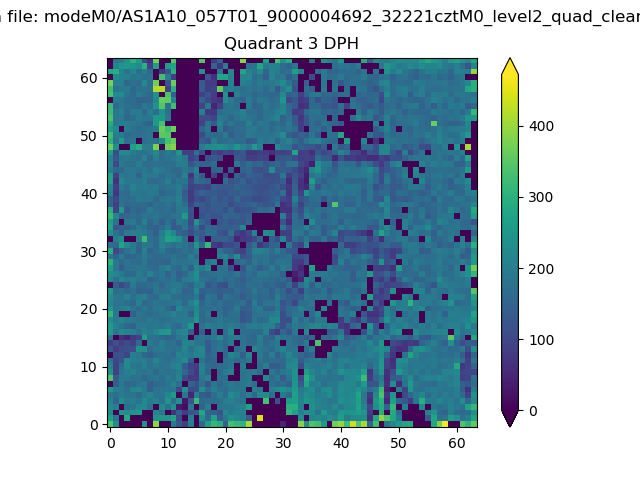 |
 |
Quadrant C |
| Plot type | Count rate plots | Images |
|---|---|---|
| Comparison with Poisson distribution Blue bars denote a histogram of data divided into 1 sec bins. Red curve is a Poisson curve with rate = median count rate of data. |
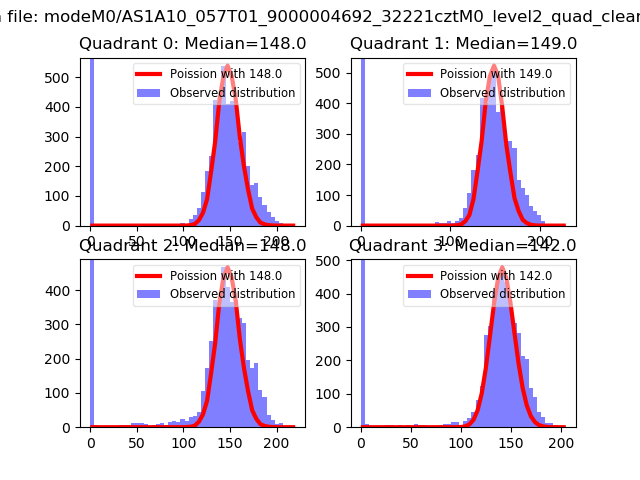 |
 |
| Quadrant-wise count rates Data is divided into 100 sec bins |
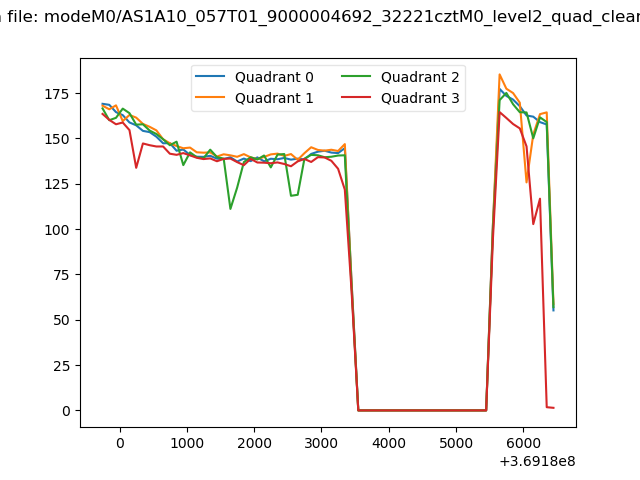 |
|
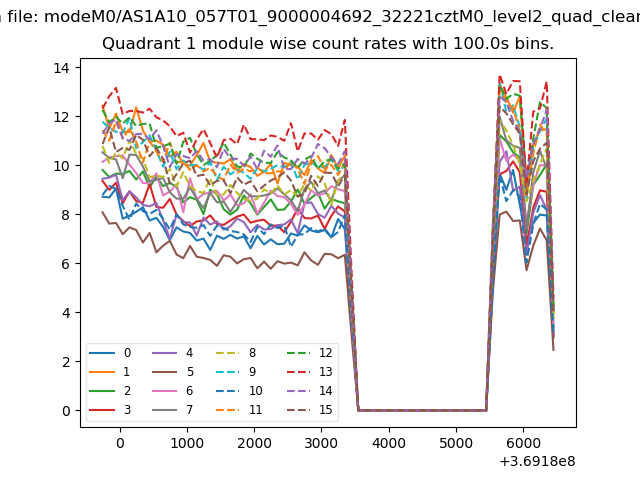
| Module-wise count rates for Quadrant A Data is divided into 100 sec bins |
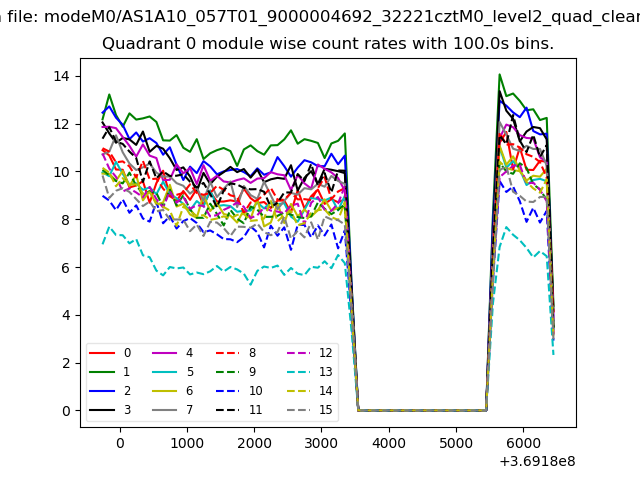 |
 |
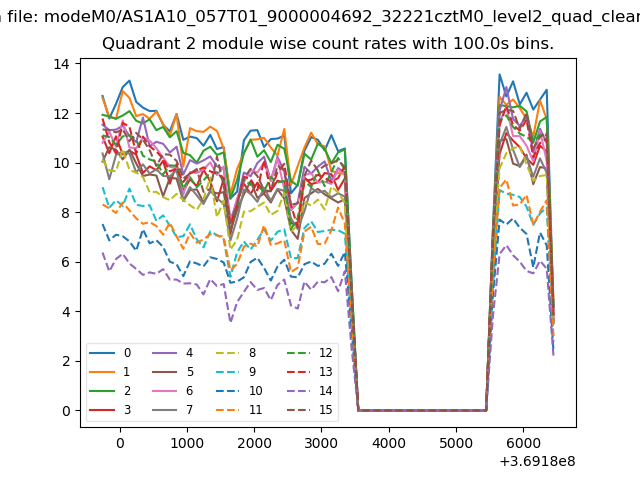
| Module-wise count rates for Quadrant B Data is divided into 100 sec bins |
 |
 |
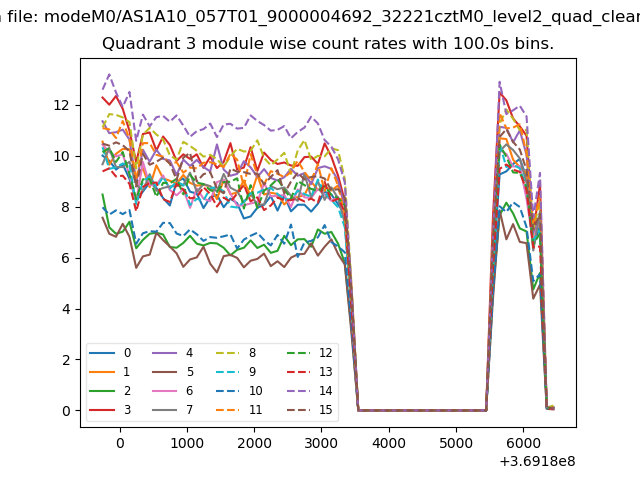
| Module-wise count rates for Quadrant C Data is divided into 100 sec bins |
 |
 |
| Module-wise count rates for Quadrant D Data is divided into 100 sec bins |
 |
 |
| Parameter | Plot |
|---|---|
| CZT HV Monitor | 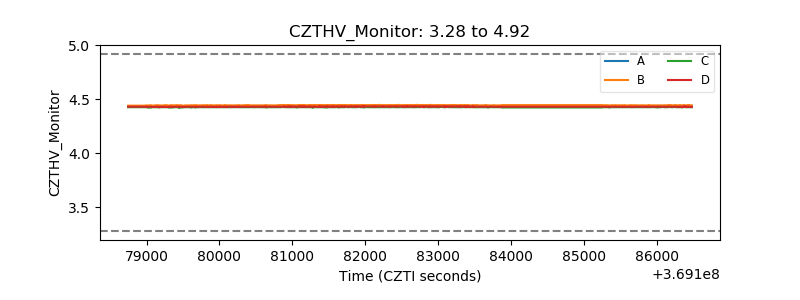 |
| D_VDD | 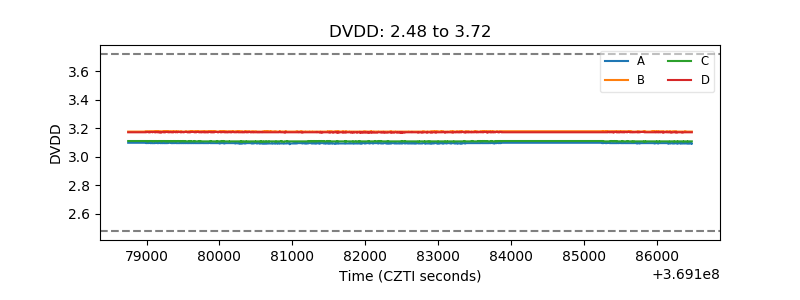 |
| Temperature 1 | 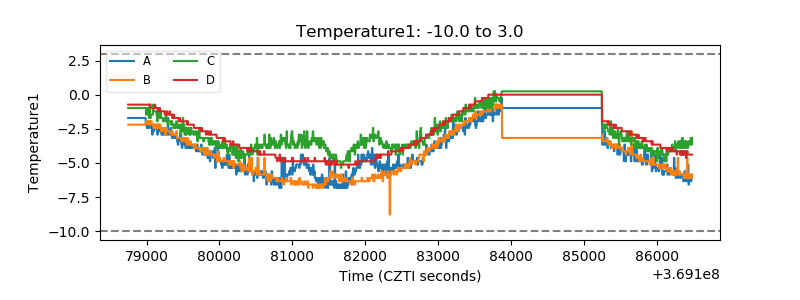 |
| Veto HV Monitor | 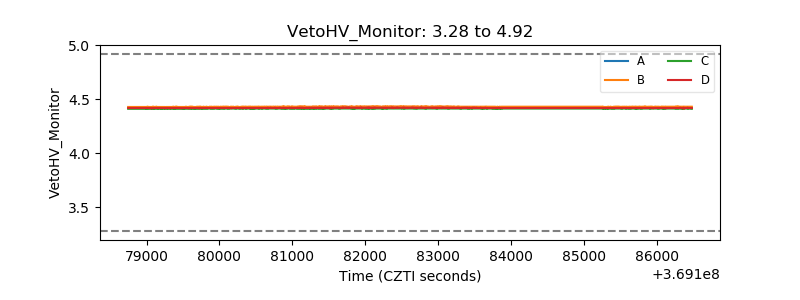 |
| Veto LLD | 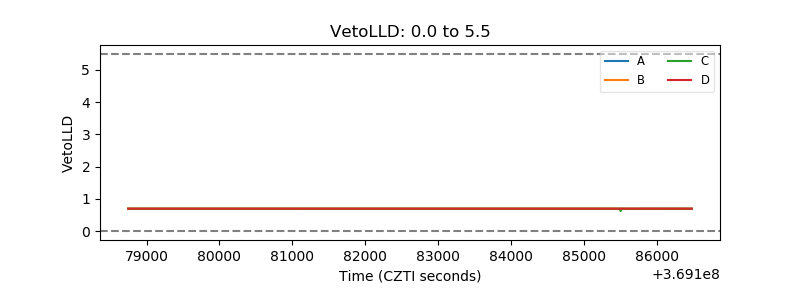 |
| Alpha Counter | 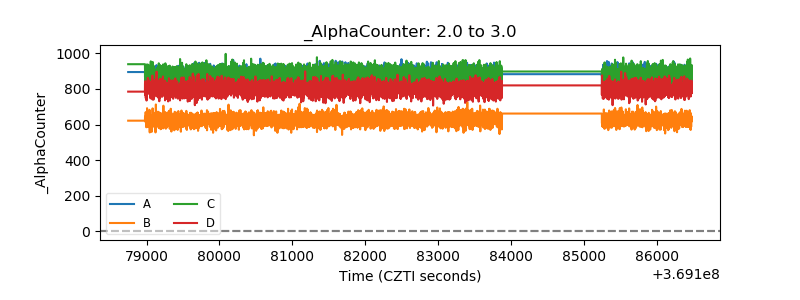 |
| _CPM_Rate | 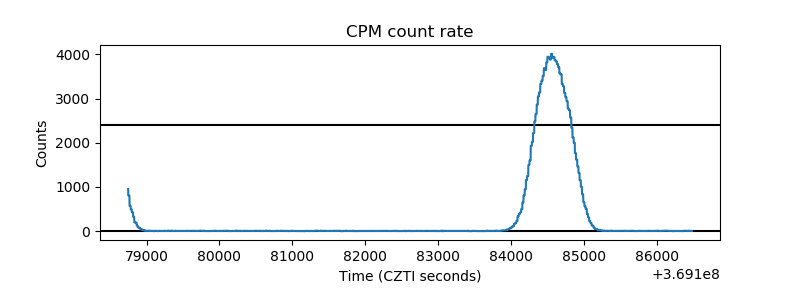 |
| CZT Counter | 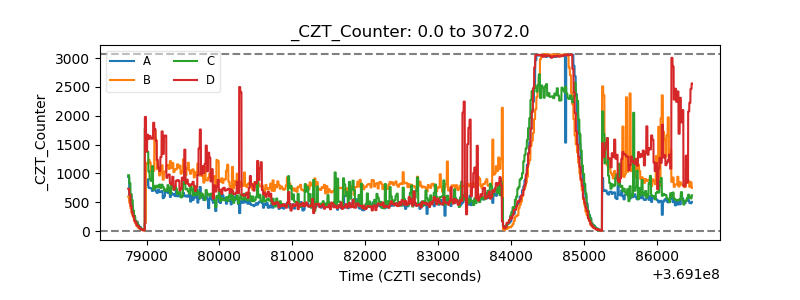 |
| +2.5 Volts monitor |  |
| +5 Volts monitor |  |
| _ROLL_ROT | 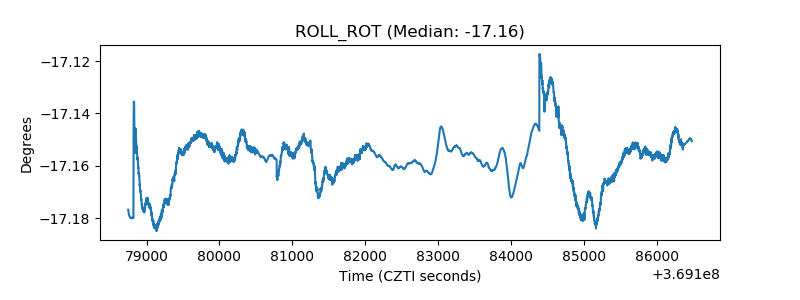 |
| _Roll_DEC | 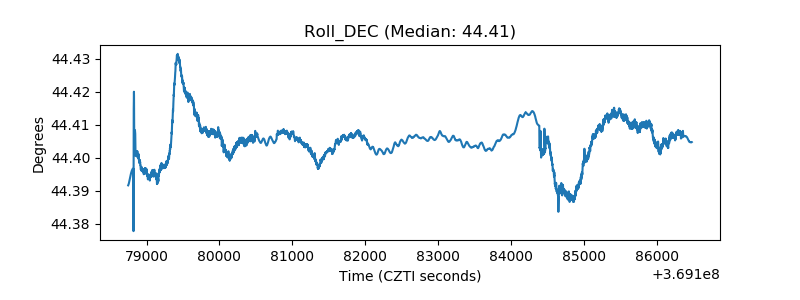 |
| _Roll_RA |  |
| Veto Counter | 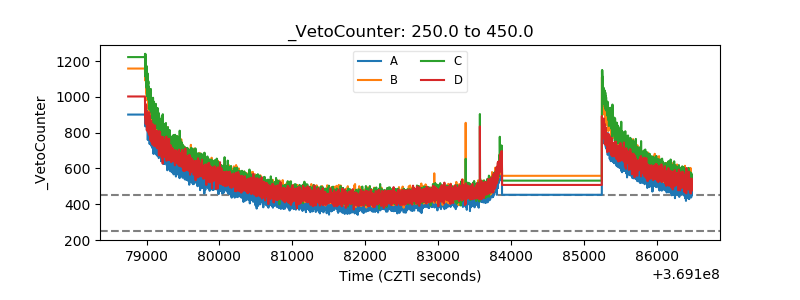 |