| Param | Original file | Final file |
|---|---|---|
| Filename | modeM0/AS1A10_057T01_9000004692_32223cztM0_level2.evt | modeM0/AS1A10_057T01_9000004692_32223cztM0_level2_quad_clean.evt |
| Size (bytes) | 586,192,320 | 111,663,360 |
| Size | 559.0 MB | 106.5 MB |
| Events in quadrant A | 3,269,023 | 765,546 |
| Events in quadrant B | 5,547,569 | 779,045 |
| Events in quadrant C | 3,938,730 | 652,573 |
| Events in quadrant D | 4,551,199 | 725,711 |
| Mode M0 | |||
|---|---|---|---|
| Quadrant | BADHDUFLAG | Total packets | Discarded packets |
| A | 0 | 13922 | 3 |
| B | 0 | 21075 | 2 |
| C | 0 | 16051 | 2 |
| D | 0 | 17919 | 2 |
| Mode SS | |||
|---|---|---|---|
| Quadrant | BADHDUFLAG | Total packets | Discarded packets |
| A | 0 | 134 | 0 |
| B | 0 | 134 | 0 |
| C | 0 | 134 | 0 |
| D | 0 | 134 | 0 |
| Mode M9 | |||
|---|---|---|---|
| Quadrant | BADHDUFLAG | Total packets | Discarded packets |
| A | 0 | 13 | 0 |
| B | 0 | 13 | 0 |
| C | 0 | 13 | 0 |
| D | 0 | 14 | 0 |
| Quadrant | Total seconds | Saturated seconds | Saturation percentage |
|---|---|---|---|
| A | 6573 | 25 | 0.380344% |
| B | 6573 | 211 | 3.210102% |
| C | 6573 | 1912 | 29.088696% |
| D | 6573 | 168 | 2.555911% |
Noise dominated data is calculated using 1-second bins in cleaned event files. If a bin has >2000 counts, and if more than 50% of those come from <1% of pixels, then it is considered to be noise-dominated and hence unusable.
| Quadrant | # 1 sec bins | Bins with >0 counts | Bins with >2000 counts | High rate bins dominated by noise | Noise dominated (total time) | Noise dominated (detector-on time) | Marked lightcurve |
|---|---|---|---|---|---|---|---|
| A | 7848 | 6574 | 0 | 0 | 0.00% | 0.00% | 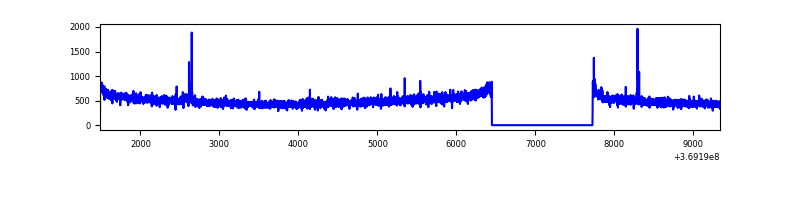 |
| B | 7848 | 6574 | 44 | 44 | 0.56% | 0.67% | 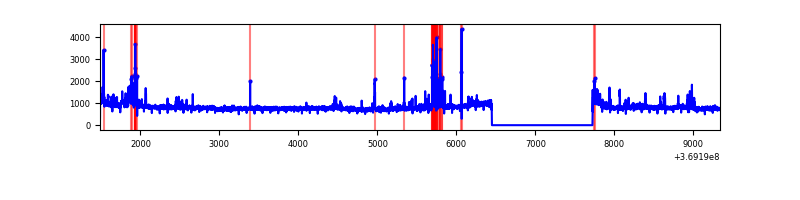 |
| C | 7848 | 6573 | 8 | 8 | 0.10% | 0.12% | 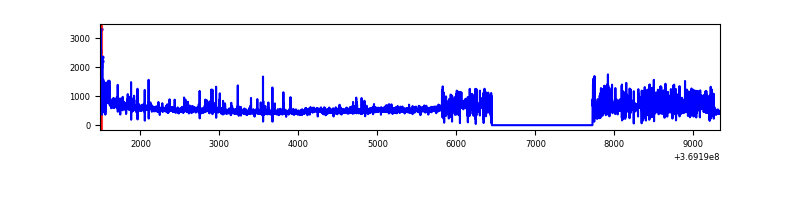 |
| D | 7848 | 6574 | 97 | 97 | 1.24% | 1.48% | 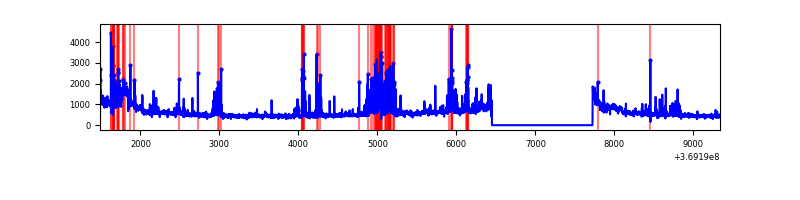 |
Top three noisy pixels from each quadrant. If the there are fewer than three noisy pixels in the level2.evt file, extra rows are filled as -1
| Pixel properties | Quadrant properties | ||||||
|---|---|---|---|---|---|---|---|
| Quadrant | DetID | PixID | Counts | Sigma | Mean | Median | Sigma |
| A | 15 | 174 | 30290 | 178.68 | 833 | 818 | 164.9 |
| A | 13 | 6 | 17177 | 99.18 | 833 | 818 | 164.9 |
| A | 13 | 254 | 13436 | 76.5 | 833 | 818 | 164.9 |
| B | 6 | 159 | 1862301 | 12074.68 | 831 | 812 | 154.2 |
| B | 5 | 172 | 158319 | 1021.68 | 831 | 812 | 154.2 |
| B | 4 | 80 | 119985 | 773.02 | 831 | 812 | 154.2 |
| C | 14 | 254 | 652740 | 4364.14 | 645 | 653 | 149.4 |
| C | 14 | 238 | 571066 | 3817.53 | 645 | 653 | 149.4 |
| C | 0 | 10 | 96375 | 640.63 | 645 | 653 | 149.4 |
| D | 8 | 195 | 713354 | 3709.27 | 802 | 779 | 192.1 |
| D | 2 | 250 | 446757 | 2321.52 | 802 | 779 | 192.1 |
| D | 13 | 249 | 124171 | 642.31 | 802 | 779 | 192.1 |
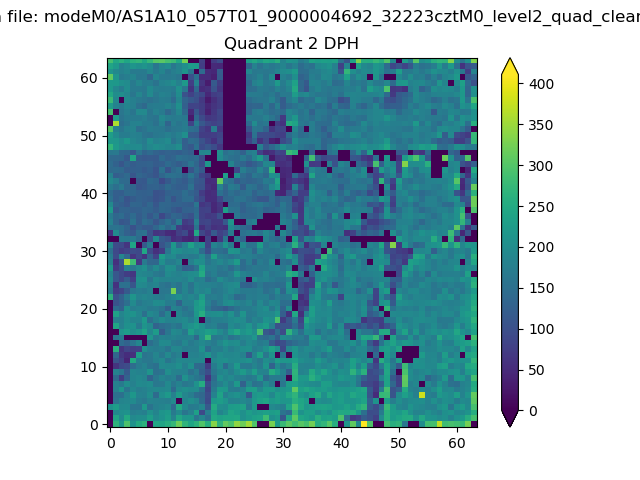
Histogram calculated using DETX and DETY for each event in the final _common_clean file
| Quadrant A | 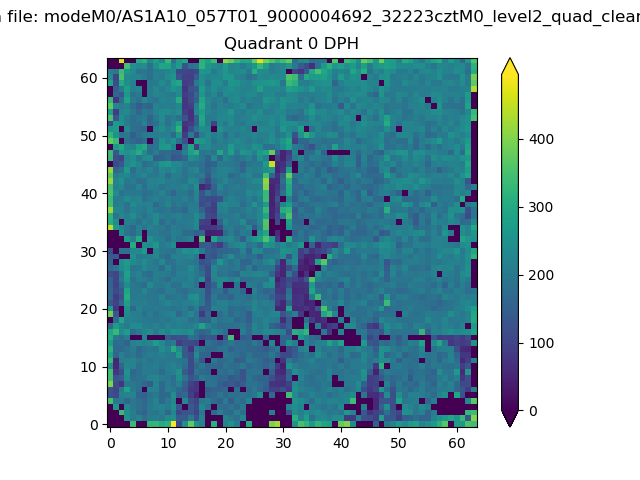 |
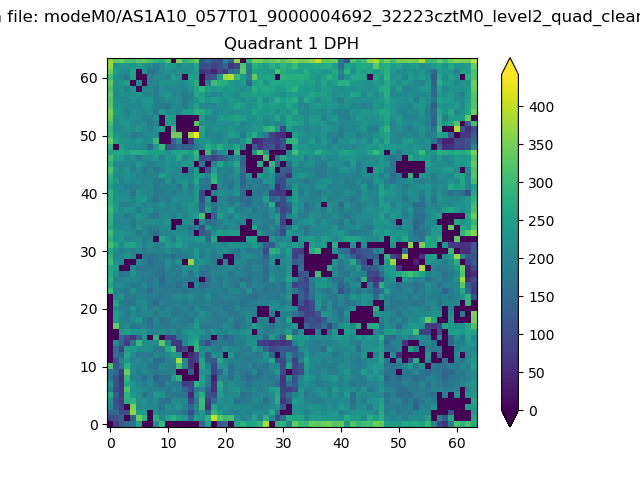 |
Quadrant B |
|---|---|---|---|
| Quadrant D | 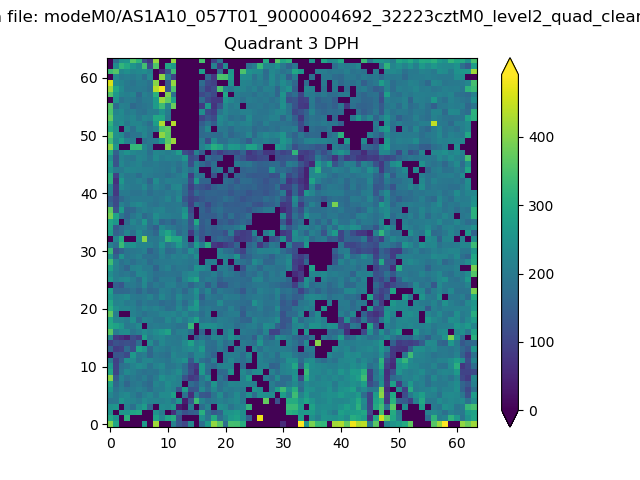 |
 |
Quadrant C |
| Plot type | Count rate plots | Images |
|---|---|---|
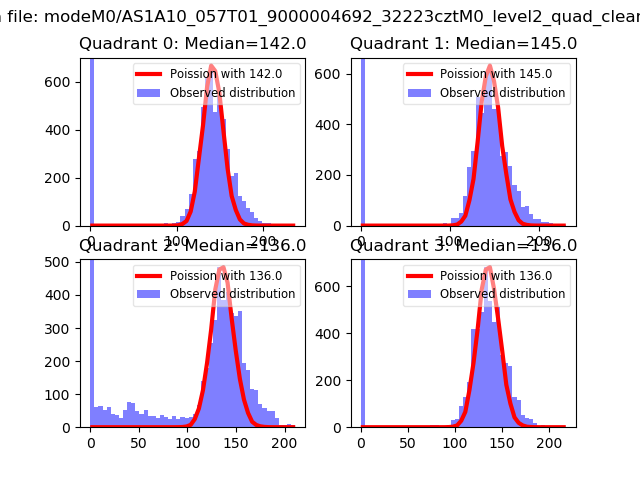
| Comparison with Poisson distribution Blue bars denote a histogram of data divided into 1 sec bins. Red curve is a Poisson curve with rate = median count rate of data. |
 |
 |
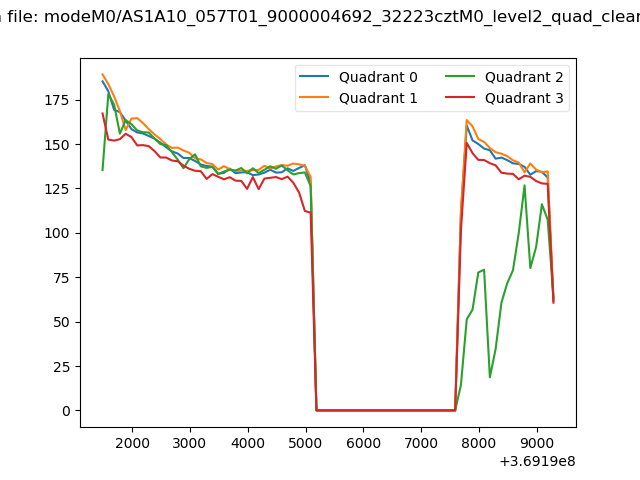
| Quadrant-wise count rates Data is divided into 100 sec bins |
 |
|
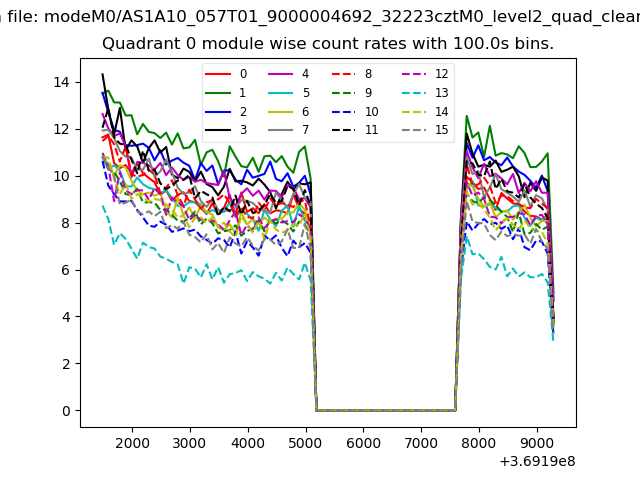
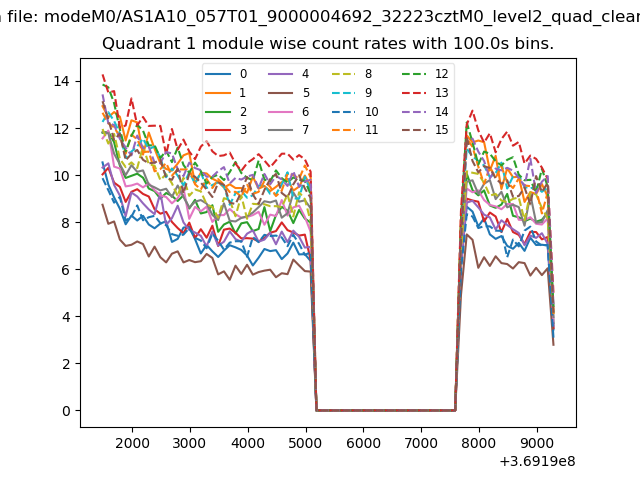
| Module-wise count rates for Quadrant A Data is divided into 100 sec bins |
 |
 |
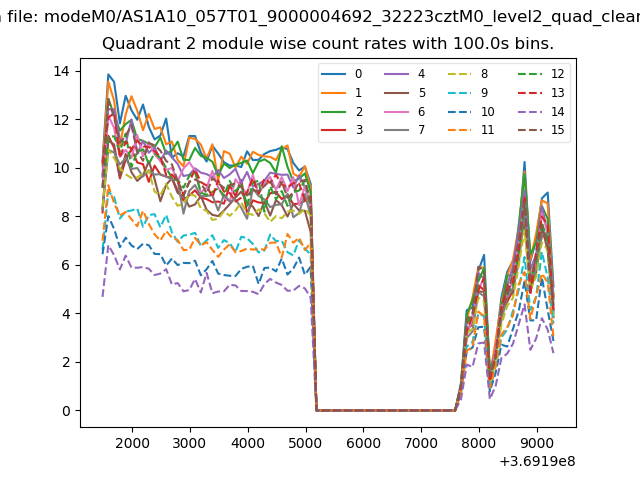
| Module-wise count rates for Quadrant B Data is divided into 100 sec bins |
 |
 |
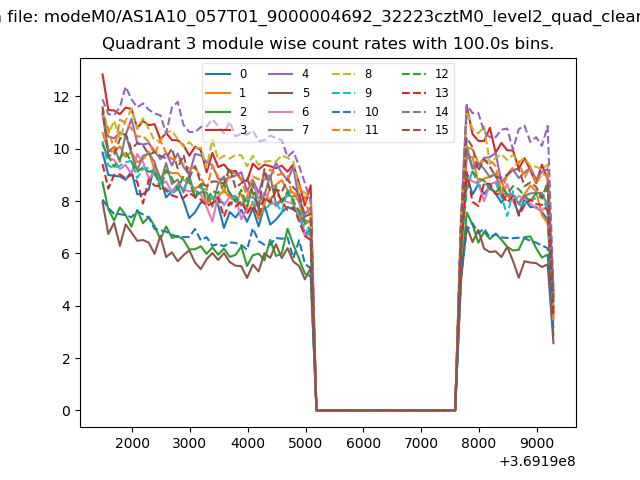
| Module-wise count rates for Quadrant C Data is divided into 100 sec bins |
 |
 |
| Module-wise count rates for Quadrant D Data is divided into 100 sec bins |
 |
 |
| Parameter | Plot |
|---|---|
| CZT HV Monitor | 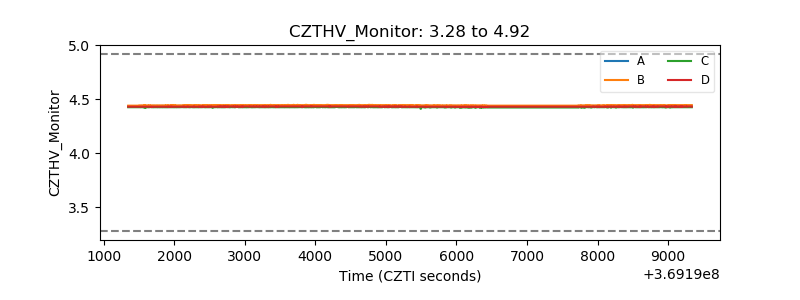 |
| D_VDD | 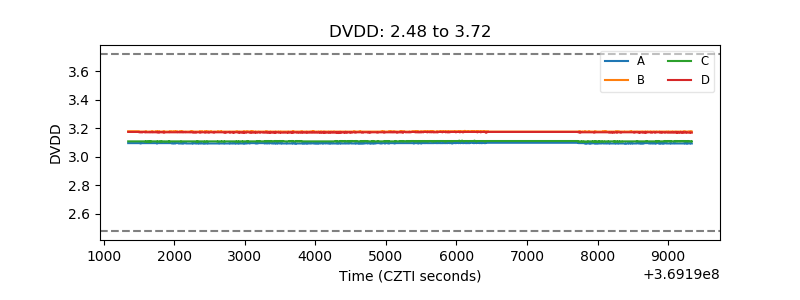 |
| Temperature 1 | 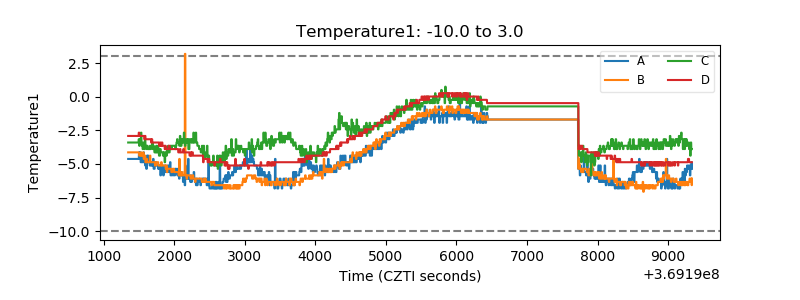 |
| Veto HV Monitor | 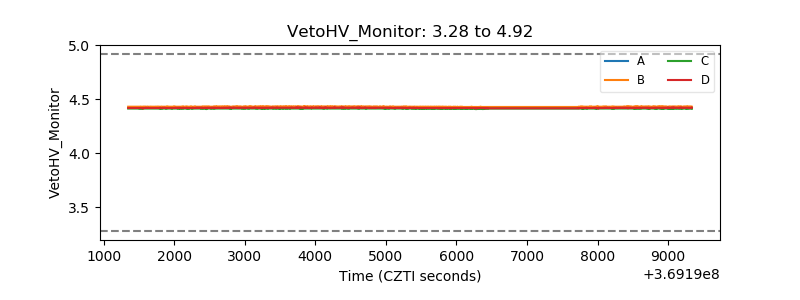 |
| Veto LLD | 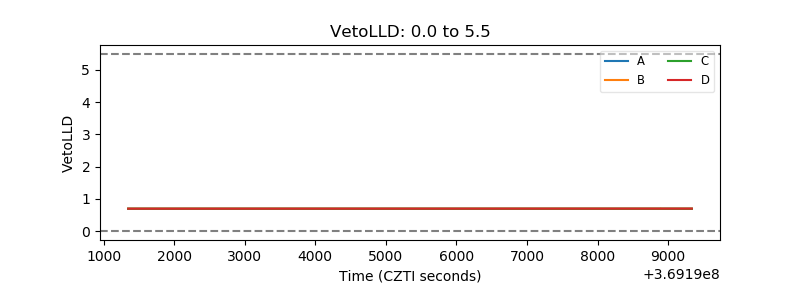 |
| Alpha Counter | 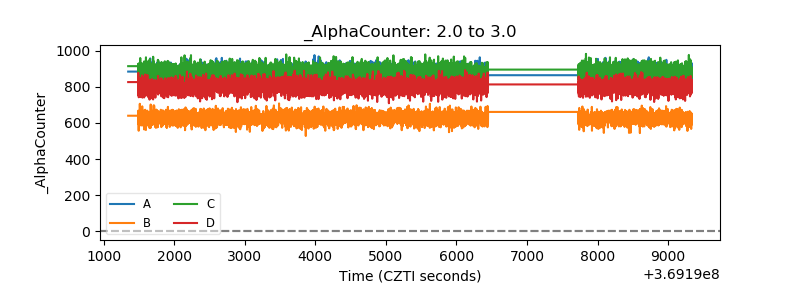 |
| _CPM_Rate | 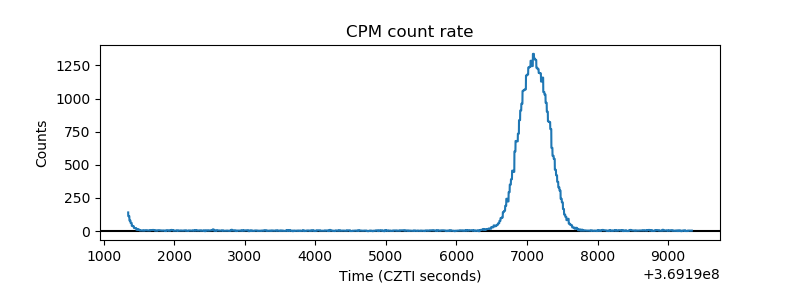 |
| CZT Counter | 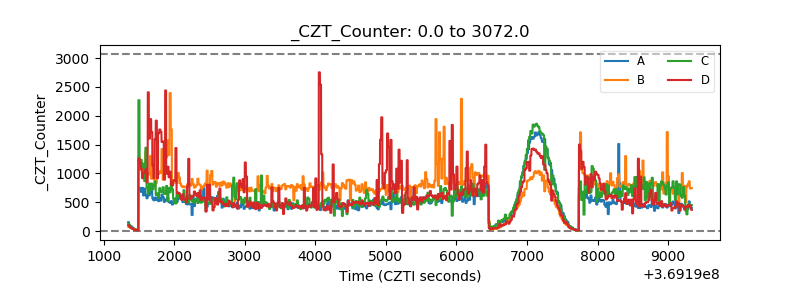 |
| +2.5 Volts monitor |  |
| +5 Volts monitor |  |
| _ROLL_ROT | 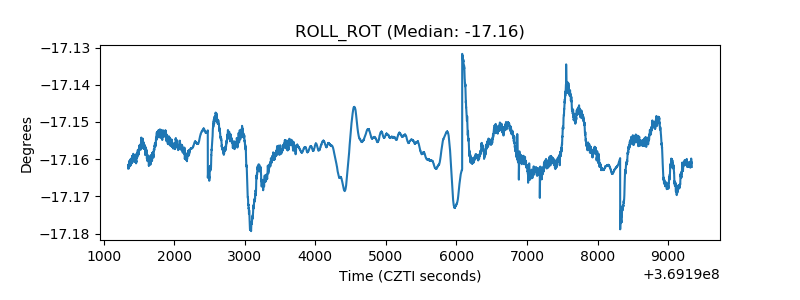 |
| _Roll_DEC | 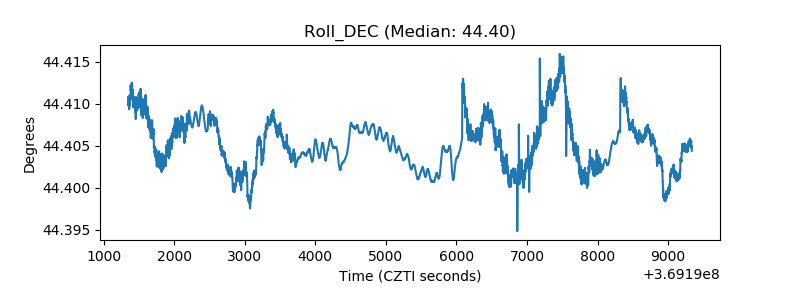 |
| _Roll_RA | 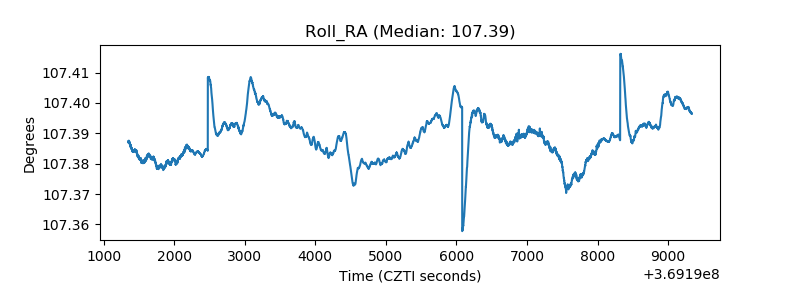 |
| Veto Counter | 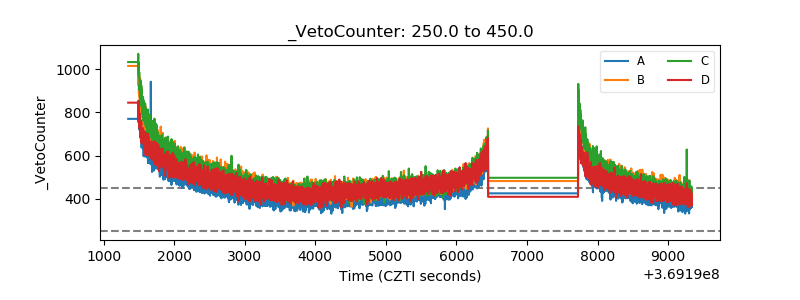 |