| Param | Original file | Final file |
|---|---|---|
| Filename | modeM0/AS1A10_057T01_9000004692_32226cztM0_level2.evt | modeM0/AS1A10_057T01_9000004692_32226cztM0_level2_quad_clean.evt |
| Size (bytes) | 572,820,480 | 92,612,160 |
| Size | 546.3 MB | 88.3 MB |
| Events in quadrant A | 3,265,372 | 609,752 |
| Events in quadrant B | 5,301,687 | 612,184 |
| Events in quadrant C | 4,054,850 | 514,380 |
| Events in quadrant D | 4,258,515 | 588,028 |
| Mode M0 | |||
|---|---|---|---|
| Quadrant | BADHDUFLAG | Total packets | Discarded packets |
| A | 0 | 14246 | 2 |
| B | 0 | 21073 | 1 |
| C | 0 | 16534 | 1 |
| D | 0 | 17059 | 1 |
| Mode SS | |||
|---|---|---|---|
| Quadrant | BADHDUFLAG | Total packets | Discarded packets |
| A | 0 | 140 | 0 |
| B | 0 | 140 | 0 |
| C | 0 | 140 | 0 |
| D | 0 | 140 | 0 |
| Mode M9 | |||
|---|---|---|---|
| Quadrant | BADHDUFLAG | Total packets | Discarded packets |
| A | 0 | 1 | 0 |
| B | 0 | 1 | 0 |
| C | 0 | 1 | 0 |
| D | 0 | 1 | 0 |
| Quadrant | Total seconds | Saturated seconds | Saturation percentage |
|---|---|---|---|
| A | 6883 | 127 | 1.845126% |
| B | 6883 | 225 | 3.268923% |
| C | 6883 | 1413 | 20.528839% |
| D | 6883 | 188 | 2.731367% |
Noise dominated data is calculated using 1-second bins in cleaned event files. If a bin has >2000 counts, and if more than 50% of those come from <1% of pixels, then it is considered to be noise-dominated and hence unusable.
| Quadrant | # 1 sec bins | Bins with >0 counts | Bins with >2000 counts | High rate bins dominated by noise | Noise dominated (total time) | Noise dominated (detector-on time) | Marked lightcurve |
|---|---|---|---|---|---|---|---|
| A | 6968 | 6884 | 0 | 0 | 0.00% | 0.00% |  |
| B | 6968 | 6884 | 2 | 2 | 0.03% | 0.03% |  |
| C | 6968 | 6883 | 1 | 1 | 0.01% | 0.01% |  |
| D | 6968 | 6884 | 99 | 99 | 1.42% | 1.44% |  |
Top three noisy pixels from each quadrant. If the there are fewer than three noisy pixels in the level2.evt file, extra rows are filled as -1
| Pixel properties | Quadrant properties | ||||||
|---|---|---|---|---|---|---|---|
| Quadrant | DetID | PixID | Counts | Sigma | Mean | Median | Sigma |
| A | 13 | 6 | 14858 | 82.46 | 839 | 820 | 170.2 |
| A | 13 | 254 | 12432 | 68.21 | 839 | 820 | 170.2 |
| A | 3 | 137 | 8735 | 46.49 | 839 | 820 | 170.2 |
| B | 6 | 159 | 1897029 | 11842.7 | 827 | 805 | 160.1 |
| B | 0 | 245 | 48096 | 295.35 | 827 | 805 | 160.1 |
| B | 0 | 229 | 38495 | 235.39 | 827 | 805 | 160.1 |
| C | 14 | 254 | 488088 | 2874.89 | 722 | 727 | 169.5 |
| C | 14 | 238 | 480481 | 2830.02 | 722 | 727 | 169.5 |
| C | 3 | 233 | 227821 | 1339.6 | 722 | 727 | 169.5 |
| D | 8 | 195 | 447690 | 2299.46 | 807 | 783 | 194.4 |
| D | 14 | 52 | 379588 | 1949.05 | 807 | 783 | 194.4 |
| D | 2 | 250 | 167710 | 858.88 | 807 | 783 | 194.4 |
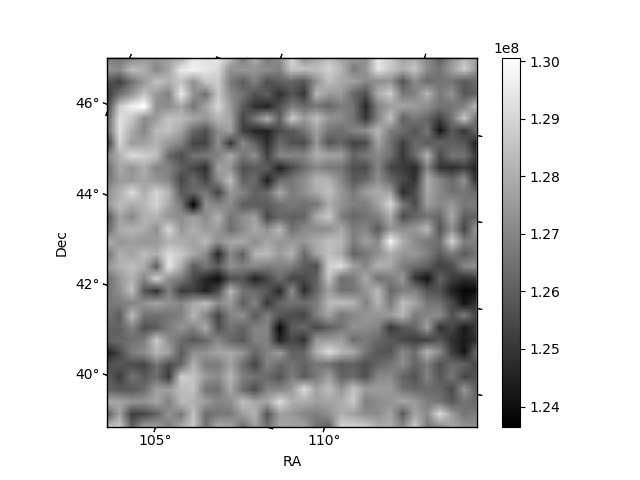
Histogram calculated using DETX and DETY for each event in the final _common_clean file
| Quadrant A | 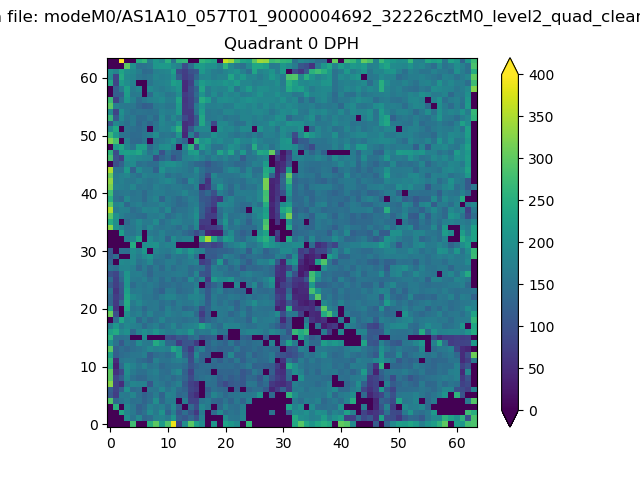 |
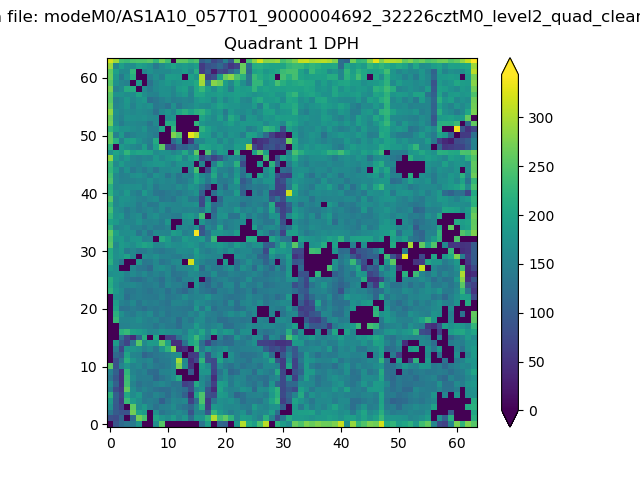 |
Quadrant B |
|---|---|---|---|
| Quadrant D |  |
 |
Quadrant C |
| Plot type | Count rate plots | Images |
|---|---|---|
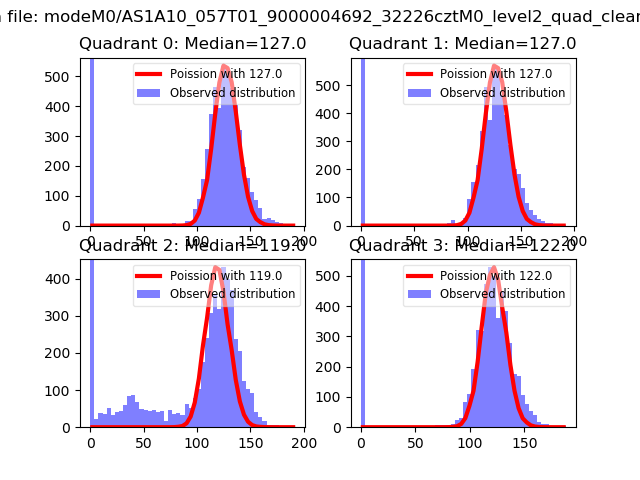
| Comparison with Poisson distribution Blue bars denote a histogram of data divided into 1 sec bins. Red curve is a Poisson curve with rate = median count rate of data. |
 |
 |
| Quadrant-wise count rates Data is divided into 100 sec bins |
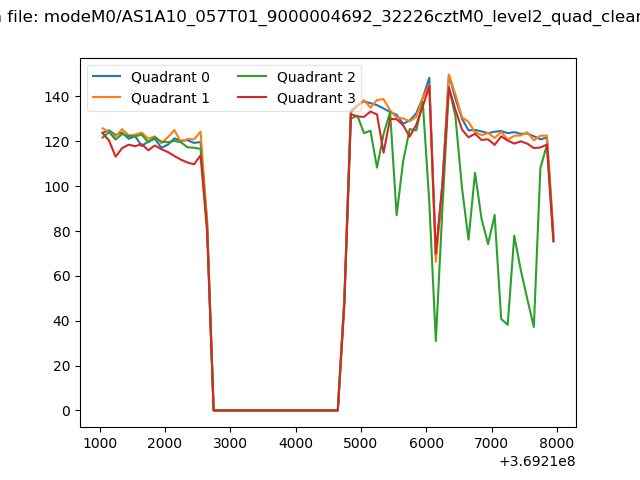 |
|
| Module-wise count rates for Quadrant A Data is divided into 100 sec bins |
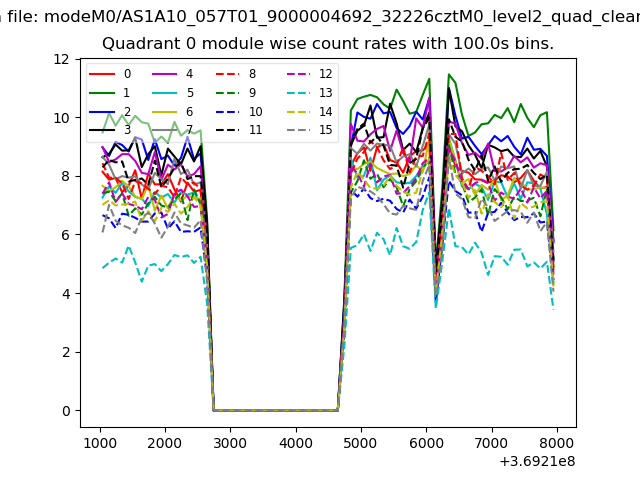 |
 |
| Module-wise count rates for Quadrant B Data is divided into 100 sec bins |
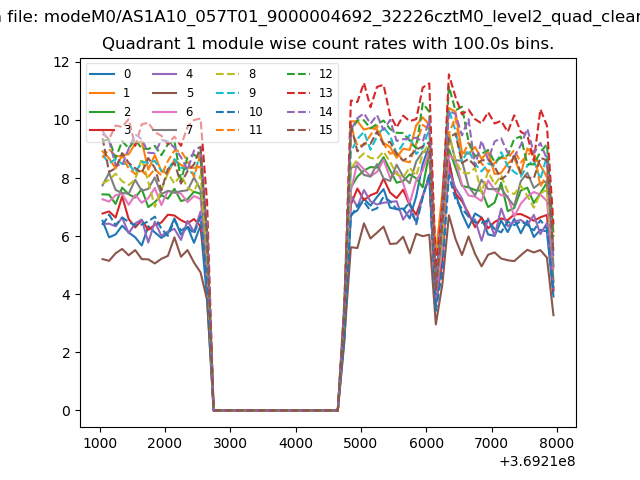 |
 |
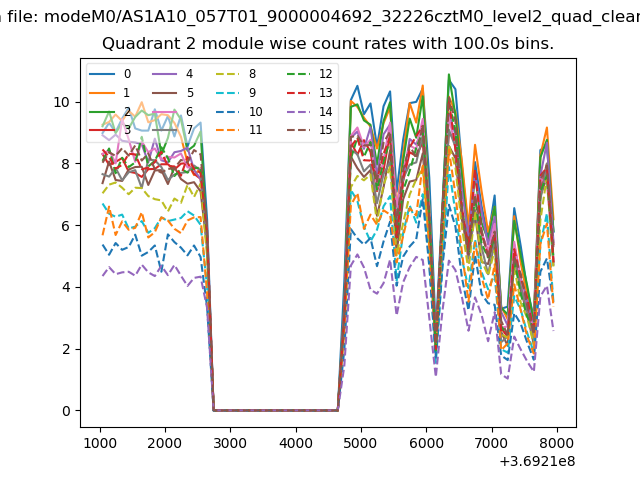
| Module-wise count rates for Quadrant C Data is divided into 100 sec bins |
 |
 |
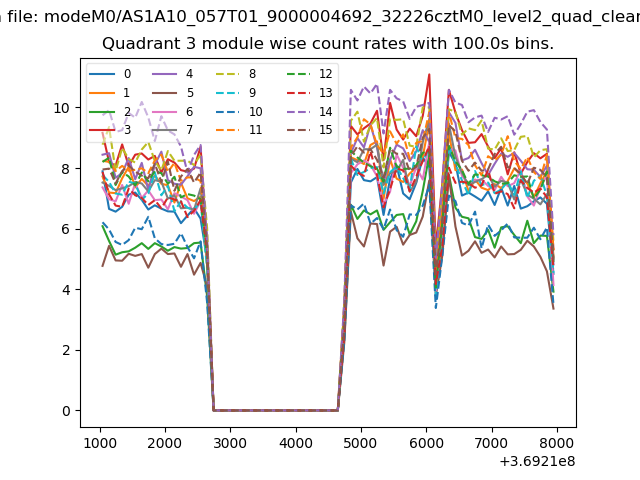
| Module-wise count rates for Quadrant D Data is divided into 100 sec bins |
 |
 |
| Parameter | Plot |
|---|---|
| CZT HV Monitor | 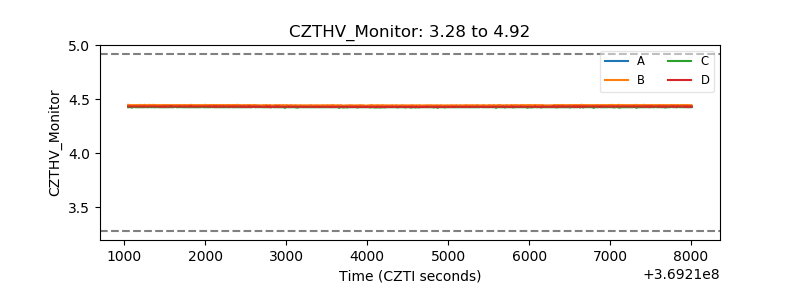 |
| D_VDD | 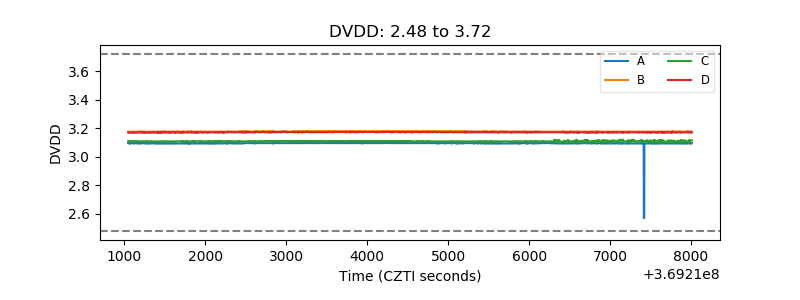 |
| Temperature 1 | 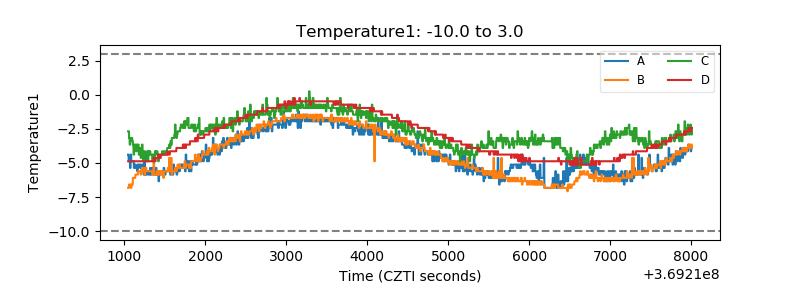 |
| Veto HV Monitor | 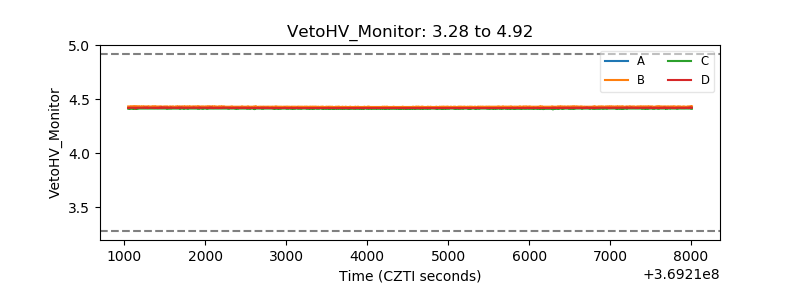 |
| Veto LLD | 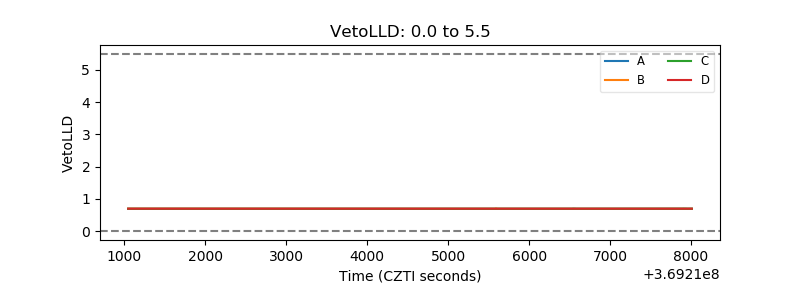 |
| Alpha Counter | 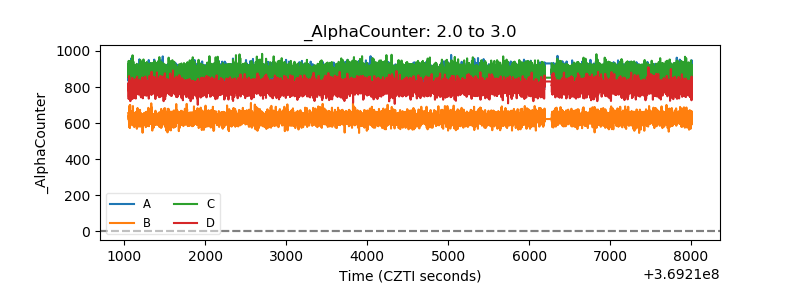 |
| _CPM_Rate | 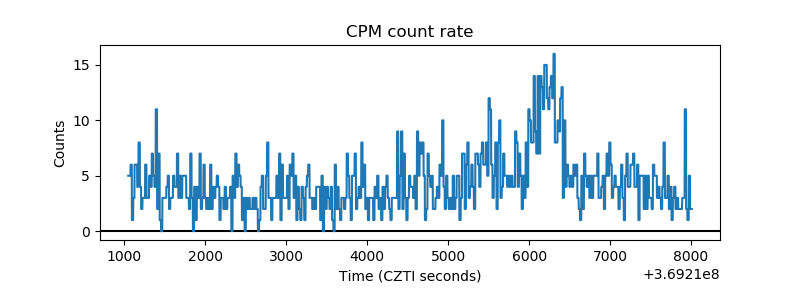 |
| CZT Counter | 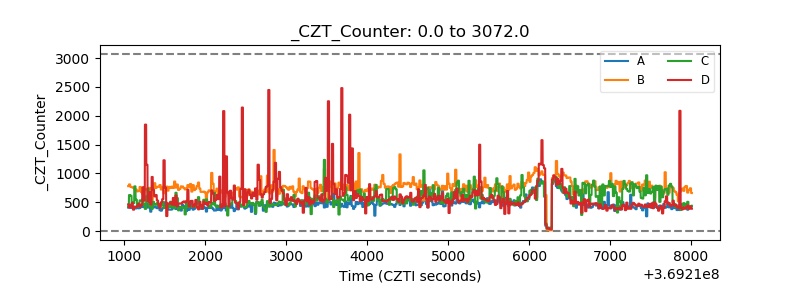 |
| +2.5 Volts monitor |  |
| +5 Volts monitor | 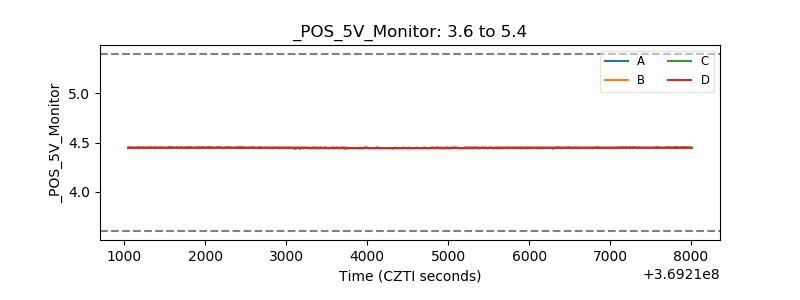 |
| _ROLL_ROT | 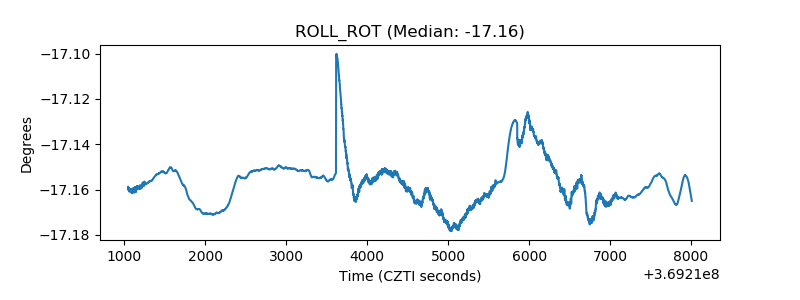 |
| _Roll_DEC | 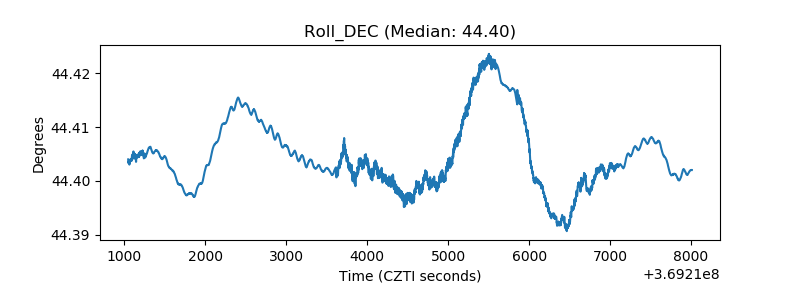 |
| _Roll_RA |  |
| Veto Counter | 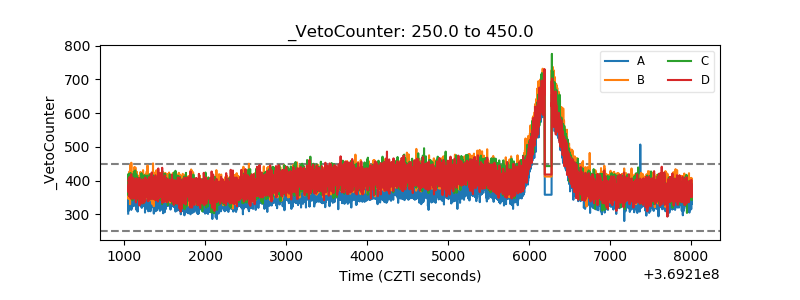 |