| Param | Original file | Final file |
|---|---|---|
| Filename | modeM0/AS1A10_057T01_9000004692_32227cztM0_level2.evt | modeM0/AS1A10_057T01_9000004692_32227cztM0_level2_quad_clean.evt |
| Size (bytes) | 627,523,200 | 98,182,080 |
| Size | 598.5 MB | 93.6 MB |
| Events in quadrant A | 3,434,502 | 664,034 |
| Events in quadrant B | 5,806,890 | 665,314 |
| Events in quadrant C | 4,939,312 | 490,080 |
| Events in quadrant D | 4,323,034 | 640,851 |
| Mode M0 | |||
|---|---|---|---|
| Quadrant | BADHDUFLAG | Total packets | Discarded packets |
| A | 0 | 15074 | 2 |
| B | 0 | 22914 | 1 |
| C | 0 | 19795 | 1 |
| D | 0 | 17726 | 1 |
| Mode SS | |||
|---|---|---|---|
| Quadrant | BADHDUFLAG | Total packets | Discarded packets |
| A | 0 | 150 | 0 |
| B | 0 | 150 | 0 |
| C | 0 | 150 | 0 |
| D | 0 | 150 | 0 |
| Mode M9 | |||
|---|---|---|---|
| Quadrant | BADHDUFLAG | Total packets | Discarded packets |
| A | 0 | 2 | 0 |
| B | 0 | 2 | 0 |
| C | 0 | 2 | 0 |
| D | 0 | 2 | 0 |
| Quadrant | Total seconds | Saturated seconds | Saturation percentage |
|---|---|---|---|
| A | 7354 | 177 | 2.406853% |
| B | 7354 | 326 | 4.432962% |
| C | 7354 | 3828 | 52.053304% |
| D | 7354 | 188 | 2.556432% |
Noise dominated data is calculated using 1-second bins in cleaned event files. If a bin has >2000 counts, and if more than 50% of those come from <1% of pixels, then it is considered to be noise-dominated and hence unusable.
| Quadrant | # 1 sec bins | Bins with >0 counts | Bins with >2000 counts | High rate bins dominated by noise | Noise dominated (total time) | Noise dominated (detector-on time) | Marked lightcurve |
|---|---|---|---|---|---|---|---|
| A | 7474 | 7357 | 0 | 0 | 0.00% | 0.00% | 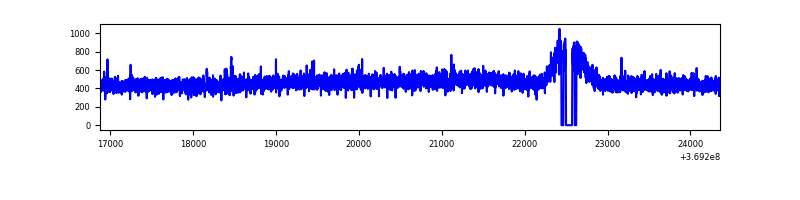 |
| B | 7474 | 7357 | 58 | 58 | 0.78% | 0.79% |  |
| C | 7474 | 7356 | 1 | 1 | 0.01% | 0.01% |  |
| D | 7474 | 7357 | 52 | 52 | 0.70% | 0.71% | 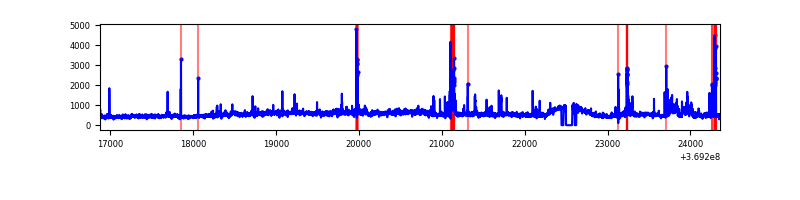 |
Top three noisy pixels from each quadrant. If the there are fewer than three noisy pixels in the level2.evt file, extra rows are filled as -1
| Pixel properties | Quadrant properties | ||||||
|---|---|---|---|---|---|---|---|
| Quadrant | DetID | PixID | Counts | Sigma | Mean | Median | Sigma |
| A | 13 | 254 | 13759 | 72.02 | 883 | 866 | 179.0 |
| A | 15 | 174 | 11081 | 57.06 | 883 | 866 | 179.0 |
| A | 13 | 6 | 10811 | 55.56 | 883 | 866 | 179.0 |
| B | 6 | 159 | 2004976 | 12007.03 | 867 | 844 | 166.9 |
| B | 5 | 172 | 213221 | 1272.38 | 867 | 844 | 166.9 |
| B | 0 | 190 | 62825 | 371.34 | 867 | 844 | 166.9 |
| C | 14 | 254 | 1328420 | 9626.96 | 579 | 581 | 137.9 |
| C | 14 | 238 | 1079625 | 7823.17 | 579 | 581 | 137.9 |
| C | 3 | 233 | 236168 | 1708.02 | 579 | 581 | 137.9 |
| D | 8 | 195 | 671082 | 3269.67 | 852 | 825 | 205.0 |
| D | 12 | 218 | 121762 | 589.96 | 852 | 825 | 205.0 |
| D | 13 | 249 | 114399 | 554.04 | 852 | 825 | 205.0 |
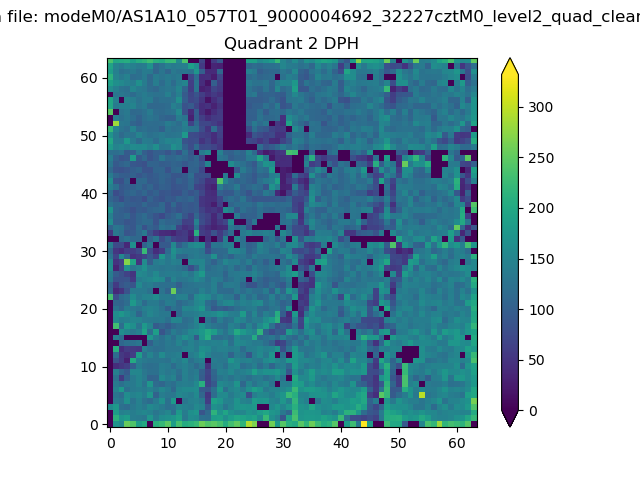
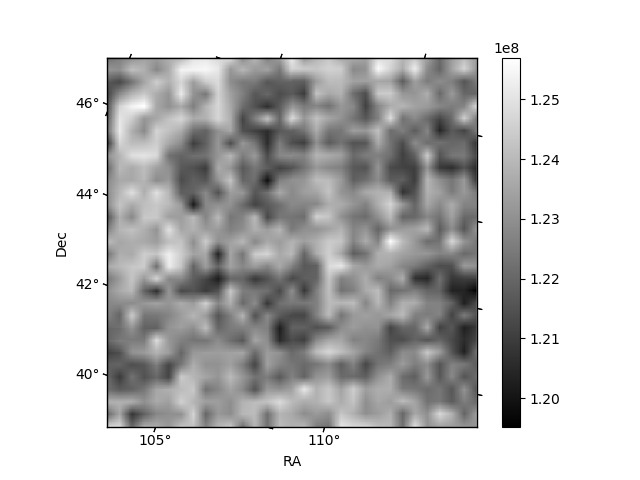
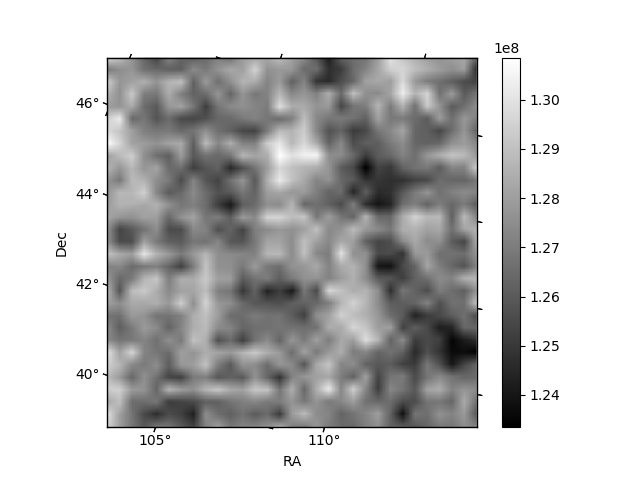
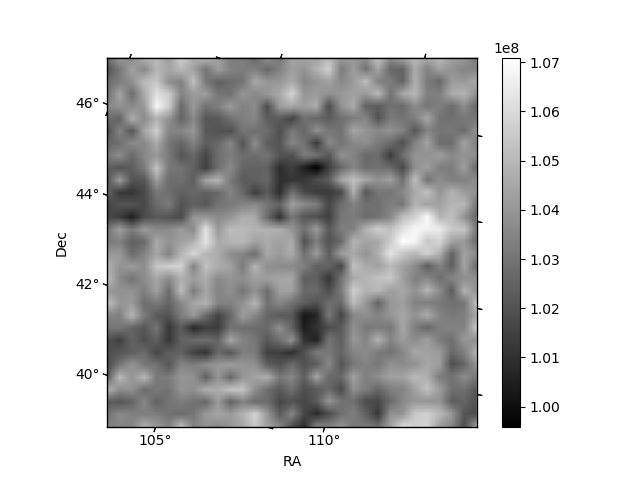
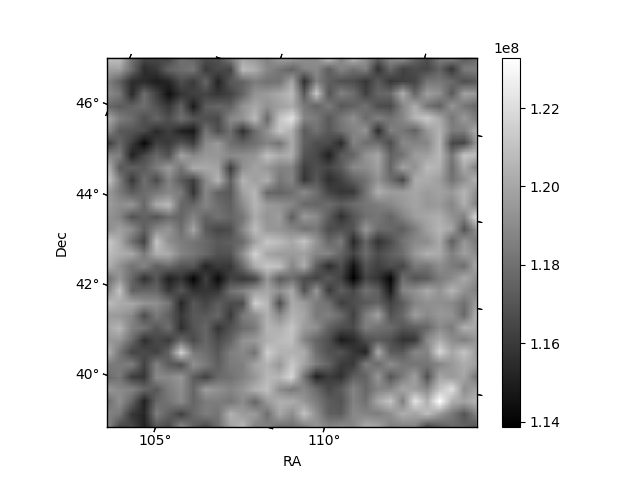
Histogram calculated using DETX and DETY for each event in the final _common_clean file
| Quadrant A | 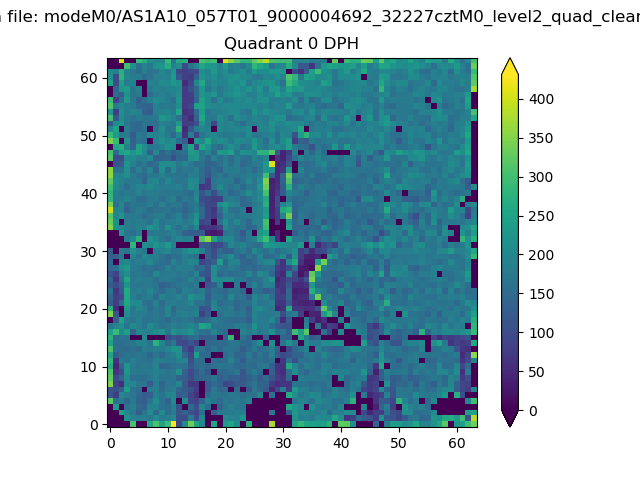 |
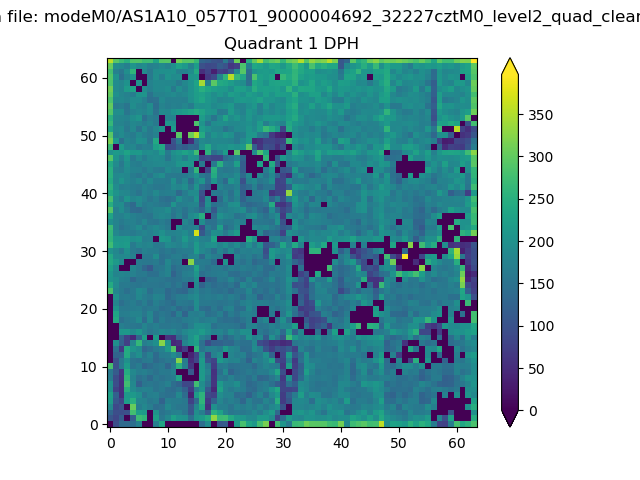 |
Quadrant B |
|---|---|---|---|
| Quadrant D | 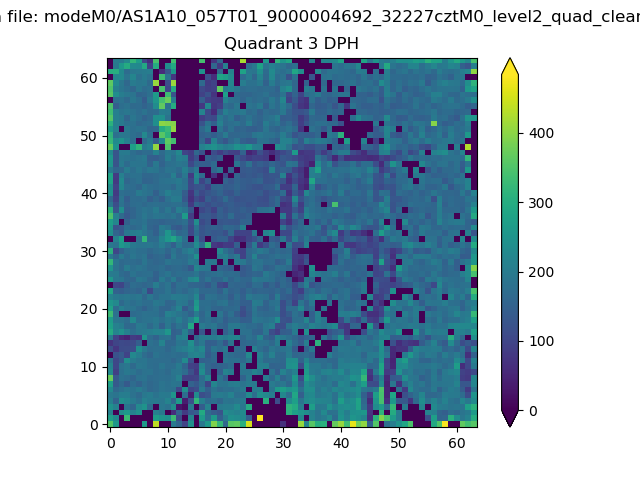 |
 |
Quadrant C |
| Plot type | Count rate plots | Images |
|---|---|---|
| Comparison with Poisson distribution Blue bars denote a histogram of data divided into 1 sec bins. Red curve is a Poisson curve with rate = median count rate of data. |
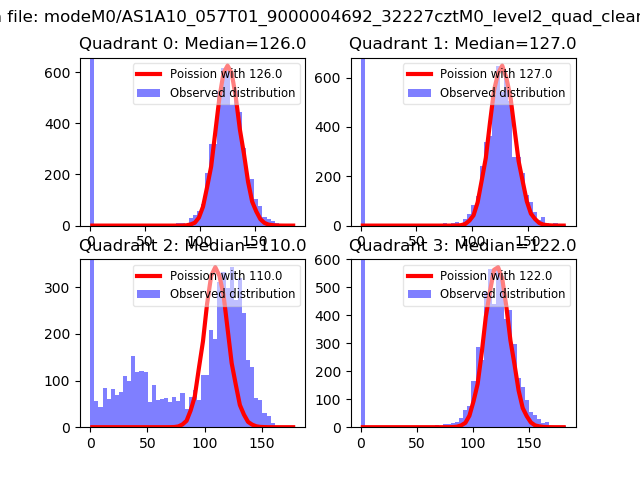 |
 |
| Quadrant-wise count rates Data is divided into 100 sec bins |
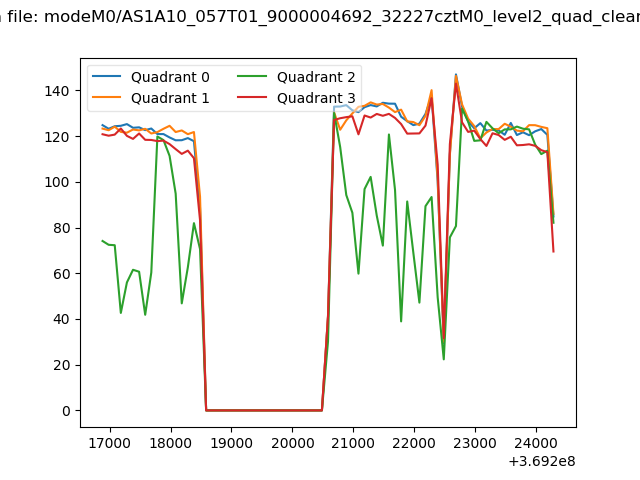 |
|
| Module-wise count rates for Quadrant A Data is divided into 100 sec bins |
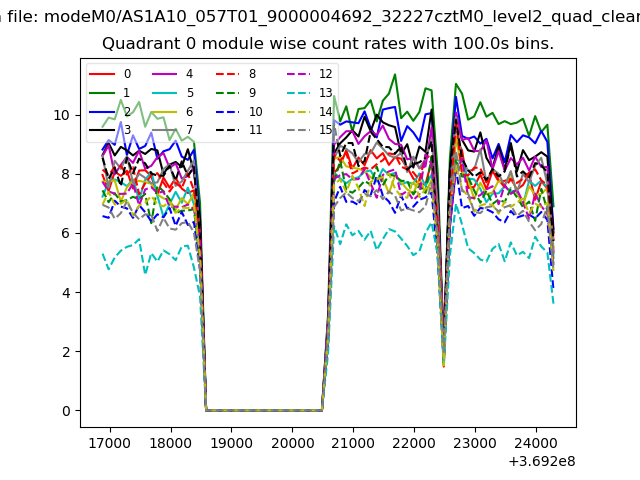 |
 |
| Module-wise count rates for Quadrant B Data is divided into 100 sec bins |
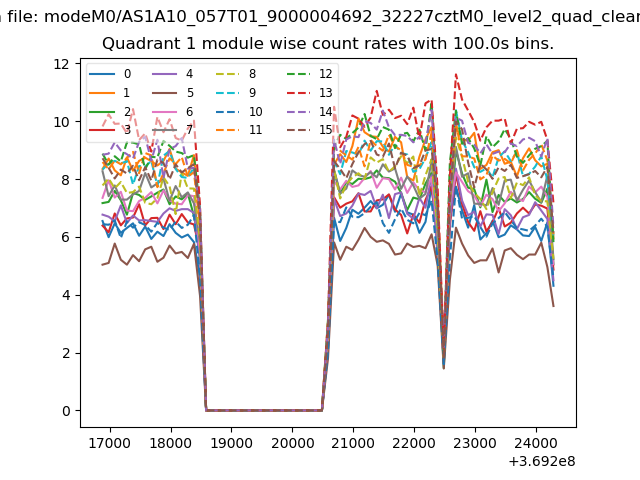 |
 |
| Module-wise count rates for Quadrant C Data is divided into 100 sec bins |
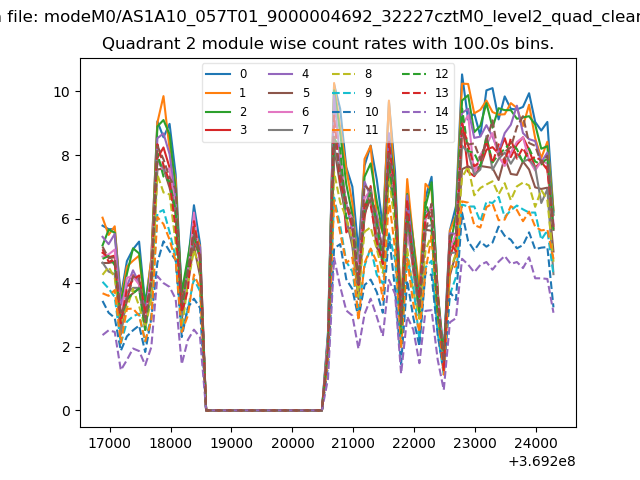 |
 |
| Module-wise count rates for Quadrant D Data is divided into 100 sec bins |
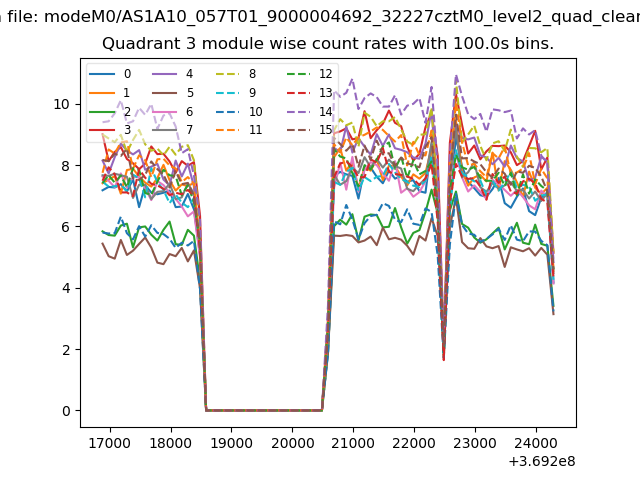 |
 |
| Parameter | Plot |
|---|---|
| CZT HV Monitor | 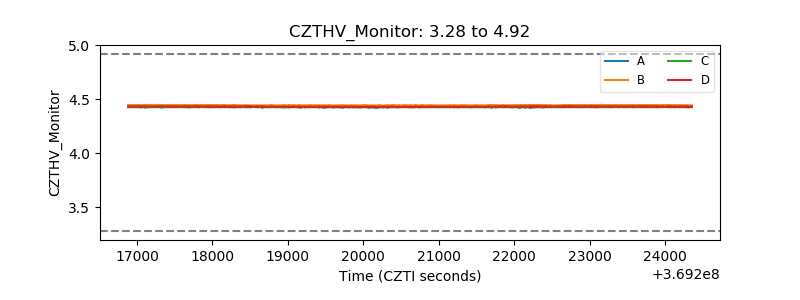 |
| D_VDD | 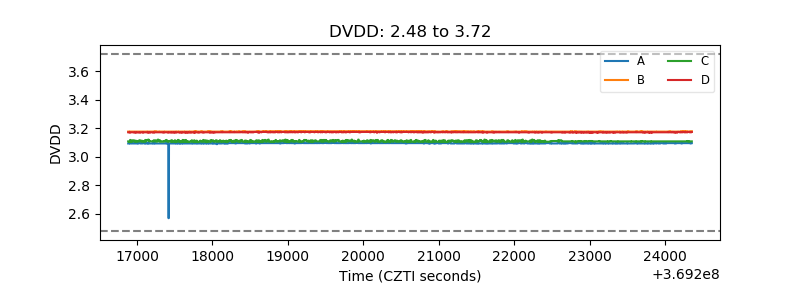 |
| Temperature 1 | 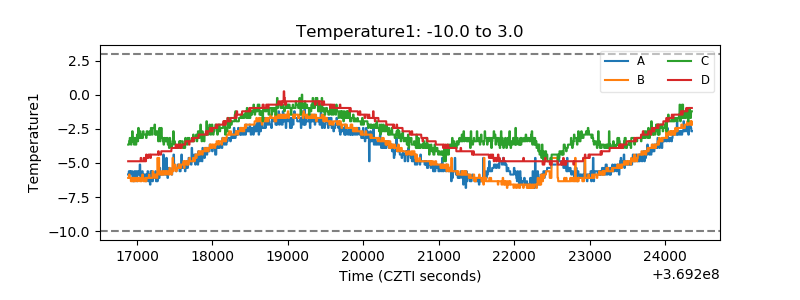 |
| Veto HV Monitor | 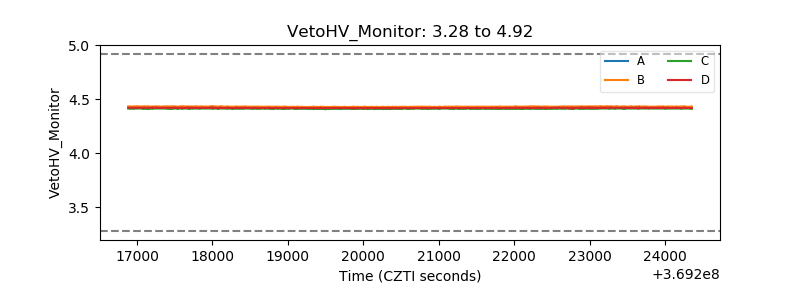 |
| Veto LLD | 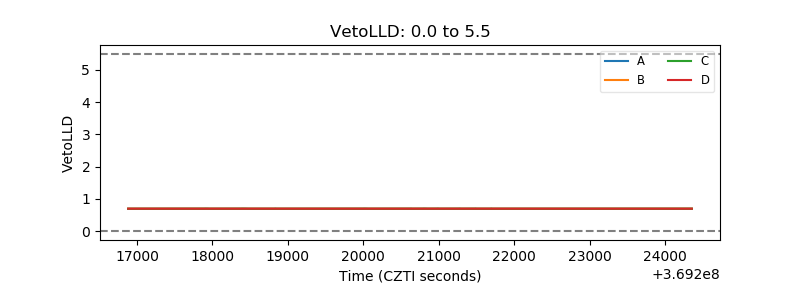 |
| Alpha Counter | 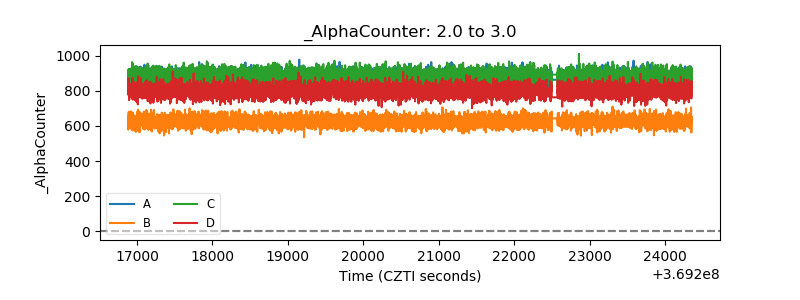 |
| _CPM_Rate | 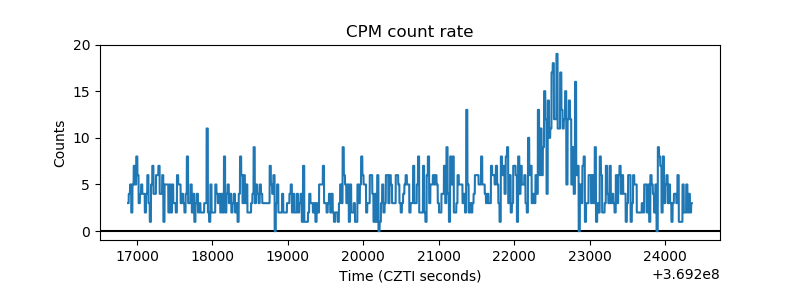 |
| CZT Counter | 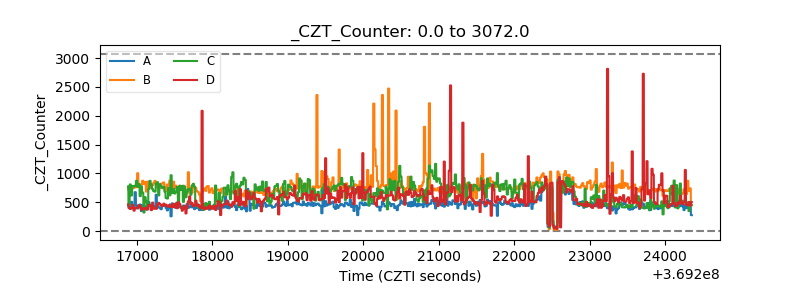 |
| +2.5 Volts monitor |  |
| +5 Volts monitor |  |
| _ROLL_ROT | 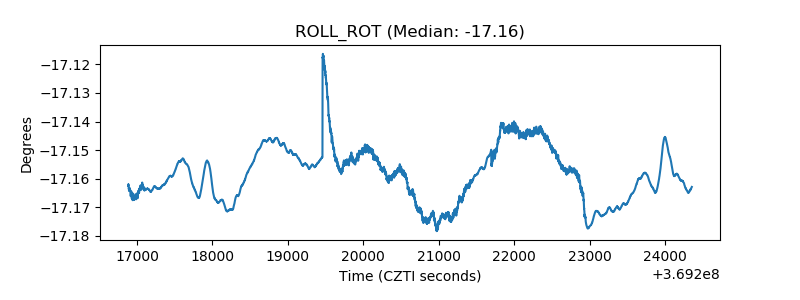 |
| _Roll_DEC | 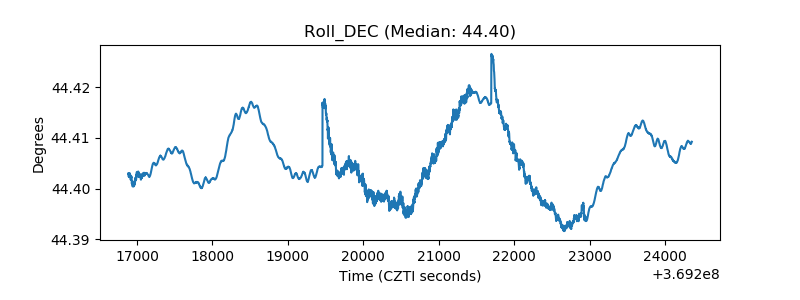 |
| _Roll_RA | 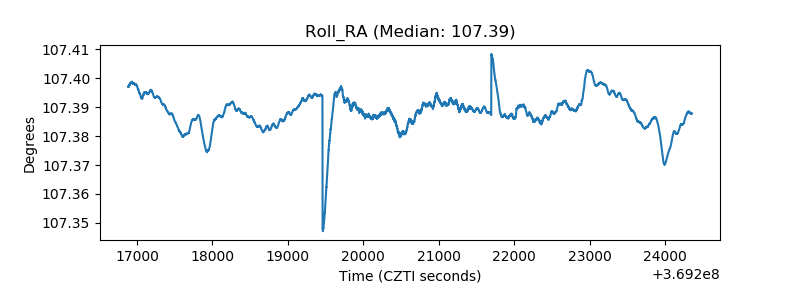 |
| Veto Counter | 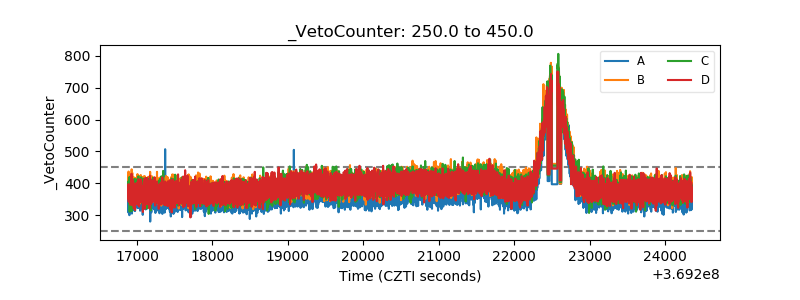 |