| Param | Original file | Final file |
|---|---|---|
| Filename | modeM0/AS1A10_057T01_9000004692_32230cztM0_level2.evt | modeM0/AS1A10_057T01_9000004692_32230cztM0_level2_quad_clean.evt |
| Size (bytes) | 1,532,257,920 | 208,877,760 |
| Size | 1.4 GB | 199.2 MB |
| Events in quadrant A | 8,464,911 | 1,332,729 |
| Events in quadrant B | 14,273,370 | 1,328,405 |
| Events in quadrant C | 10,721,194 | 1,157,075 |
| Events in quadrant D | 11,729,375 | 1,266,703 |
| Mode M0 | |||
|---|---|---|---|
| Quadrant | BADHDUFLAG | Total packets | Discarded packets |
| A | 0 | 36601 | 4 |
| B | 0 | 55872 | 3 |
| C | 0 | 43617 | 3 |
| D | 0 | 45962 | 3 |
| Mode SS | |||
|---|---|---|---|
| Quadrant | BADHDUFLAG | Total packets | Discarded packets |
| A | 0 | 366 | 0 |
| B | 0 | 366 | 0 |
| C | 0 | 366 | 0 |
| D | 0 | 366 | 0 |
| Mode M9 | |||
|---|---|---|---|
| Quadrant | BADHDUFLAG | Total packets | Discarded packets |
| A | 0 | 18 | 0 |
| B | 0 | 18 | 0 |
| C | 0 | 18 | 0 |
| D | 0 | 18 | 0 |
| Quadrant | Total seconds | Saturated seconds | Saturation percentage |
|---|---|---|---|
| A | 17985 | 184 | 1.023075% |
| B | 17985 | 446 | 2.479844% |
| C | 17985 | 4471 | 24.859605% |
| D | 17985 | 810 | 4.503753% |
Noise dominated data is calculated using 1-second bins in cleaned event files. If a bin has >2000 counts, and if more than 50% of those come from <1% of pixels, then it is considered to be noise-dominated and hence unusable.
| Quadrant | # 1 sec bins | Bins with >0 counts | Bins with >2000 counts | High rate bins dominated by noise | Noise dominated (total time) | Noise dominated (detector-on time) | Marked lightcurve |
|---|---|---|---|---|---|---|---|
| A | 19780 | 17988 | 0 | 0 | 0.00% | 0.00% | 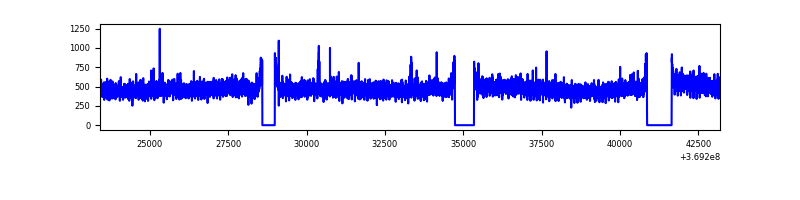 |
| B | 19780 | 17988 | 98 | 98 | 0.50% | 0.54% | 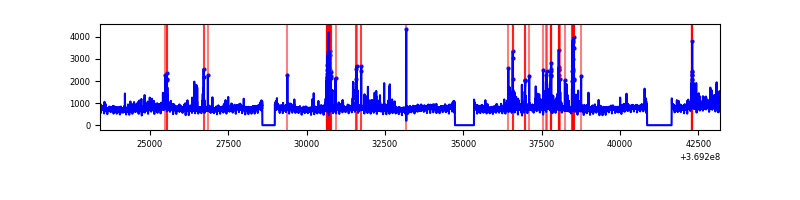 |
| C | 19780 | 17988 | 13 | 13 | 0.07% | 0.07% |  |
| D | 19780 | 17988 | 480 | 480 | 2.43% | 2.67% | 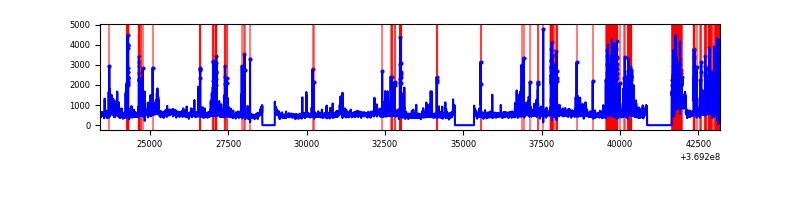 |
Top three noisy pixels from each quadrant. If the there are fewer than three noisy pixels in the level2.evt file, extra rows are filled as -1
| Pixel properties | Quadrant properties | ||||||
|---|---|---|---|---|---|---|---|
| Quadrant | DetID | PixID | Counts | Sigma | Mean | Median | Sigma |
| A | 13 | 6 | 39132 | 85.5 | 2175 | 2134 | 432.7 |
| A | 13 | 254 | 33248 | 71.9 | 2175 | 2134 | 432.7 |
| A | 3 | 137 | 22433 | 46.91 | 2175 | 2134 | 432.7 |
| B | 6 | 159 | 4887225 | 12019.23 | 2142 | 2084 | 406.4 |
| B | 5 | 172 | 376549 | 921.32 | 2142 | 2084 | 406.4 |
| B | 4 | 80 | 133816 | 324.11 | 2142 | 2084 | 406.4 |
| C | 14 | 254 | 1651719 | 3820.43 | 1848 | 1860 | 431.9 |
| C | 14 | 238 | 1525393 | 3527.91 | 1848 | 1860 | 431.9 |
| C | 14 | 67 | 108994 | 248.08 | 1848 | 1860 | 431.9 |
| D | 8 | 195 | 1597108 | 3225.29 | 2081 | 2026 | 494.6 |
| D | 2 | 250 | 975438 | 1968.26 | 2081 | 2026 | 494.6 |
| D | 12 | 218 | 471805 | 949.9 | 2081 | 2026 | 494.6 |
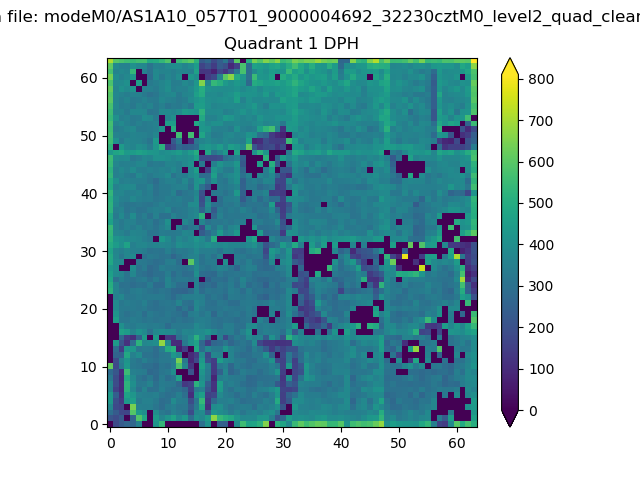
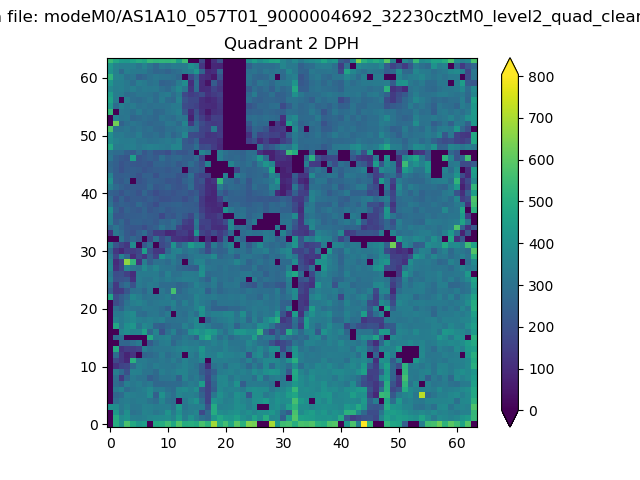
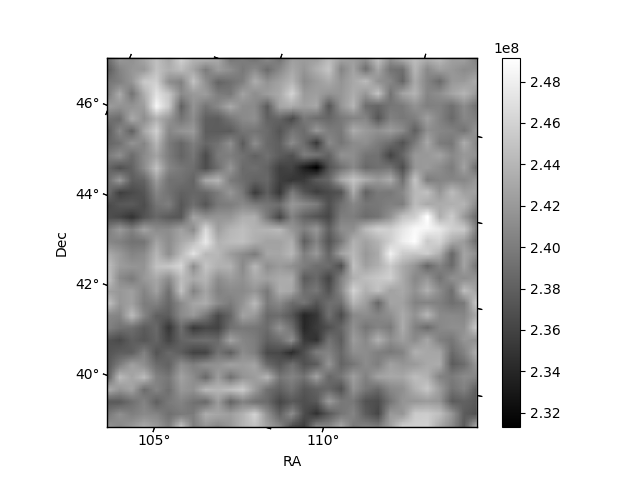
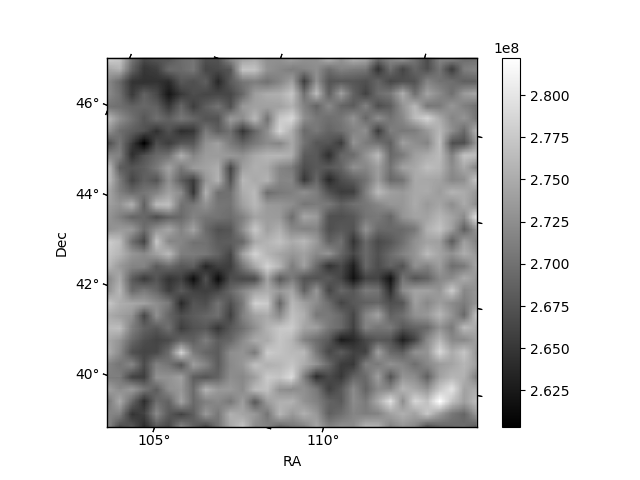
Histogram calculated using DETX and DETY for each event in the final _common_clean file
| Quadrant A |  |
 |
Quadrant B |
|---|---|---|---|
| Quadrant D | 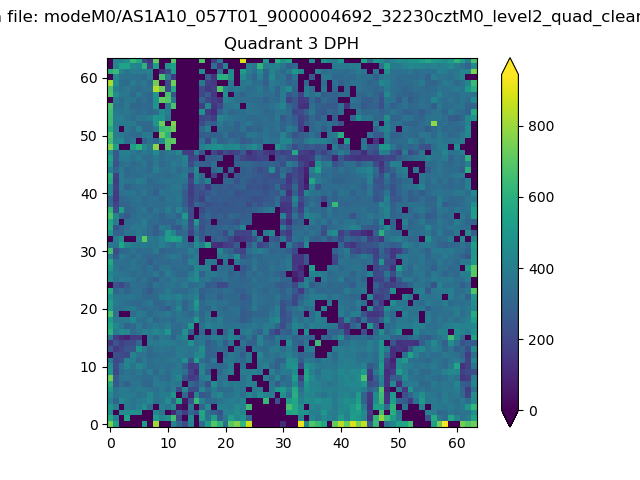 |
 |
Quadrant C |
| Plot type | Count rate plots | Images |
|---|---|---|
| Comparison with Poisson distribution Blue bars denote a histogram of data divided into 1 sec bins. Red curve is a Poisson curve with rate = median count rate of data. |
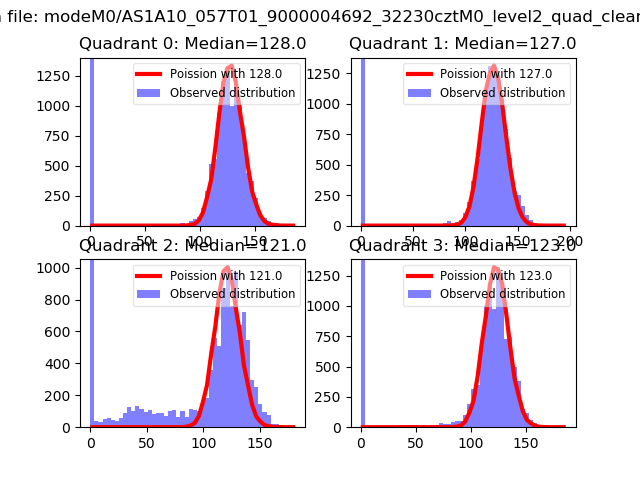 |
 |
| Quadrant-wise count rates Data is divided into 100 sec bins |
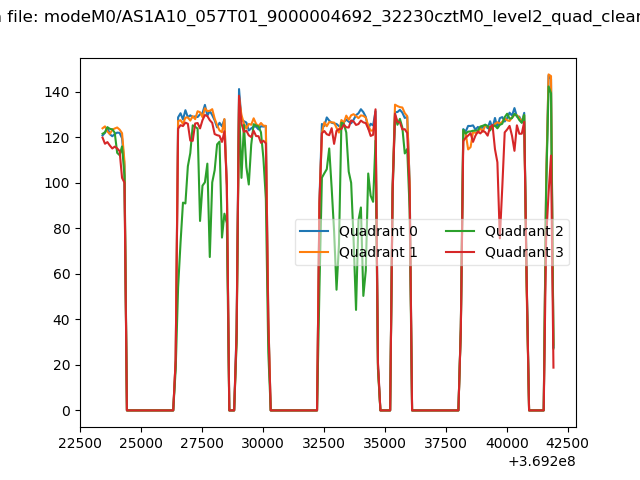 |
|
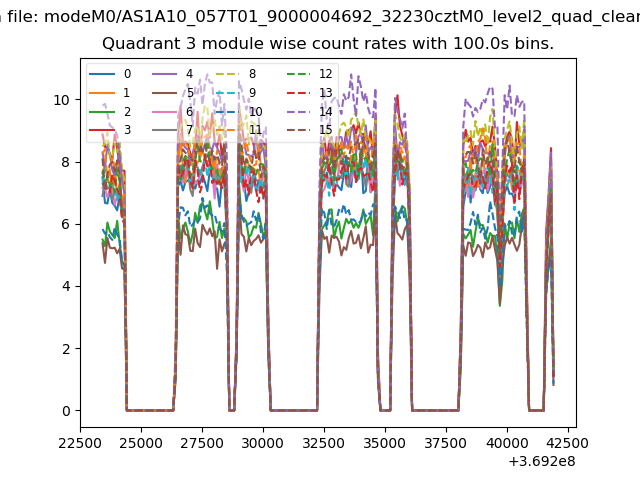
| Module-wise count rates for Quadrant A Data is divided into 100 sec bins |
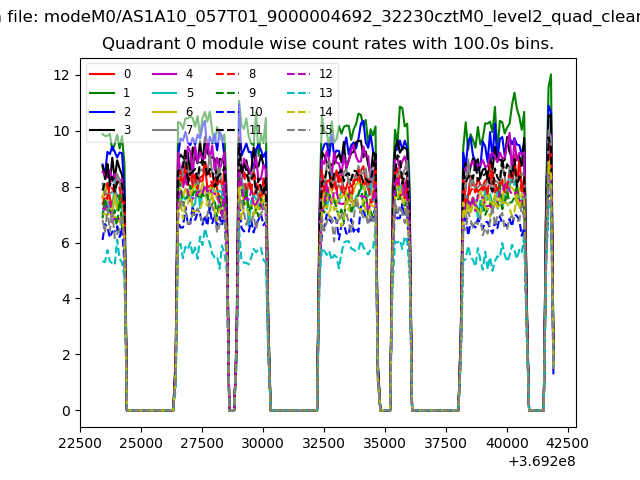 |
 |
| Module-wise count rates for Quadrant B Data is divided into 100 sec bins |
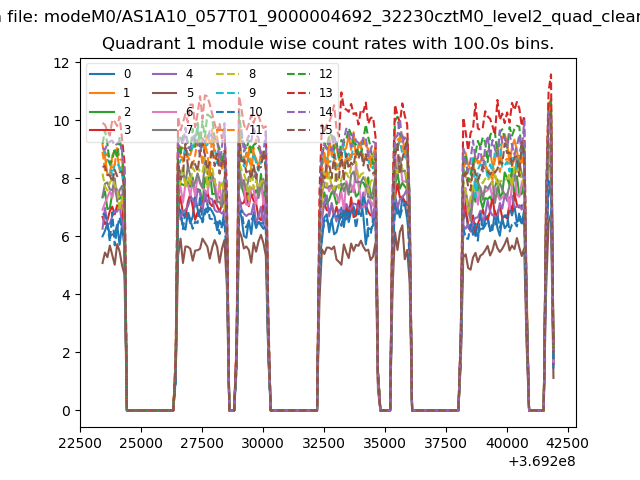 |
 |
| Module-wise count rates for Quadrant C Data is divided into 100 sec bins |
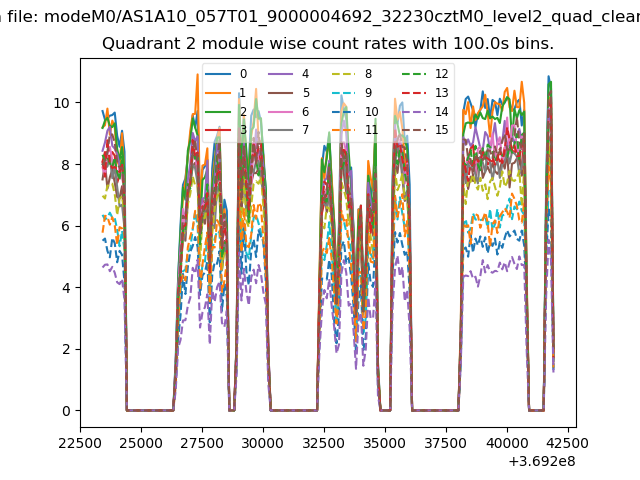 |
 |
| Module-wise count rates for Quadrant D Data is divided into 100 sec bins |
 |
 |
| Parameter | Plot |
|---|---|
| CZT HV Monitor | 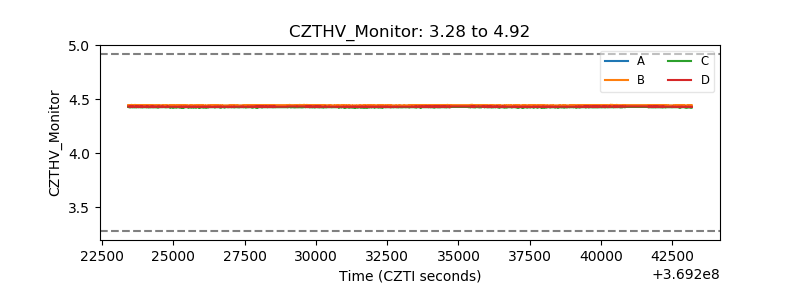 |
| D_VDD | 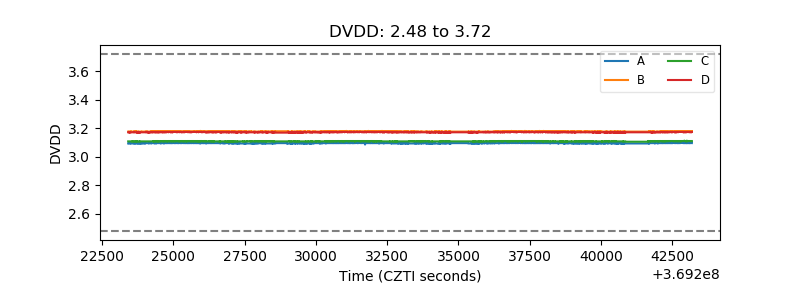 |
| Temperature 1 | 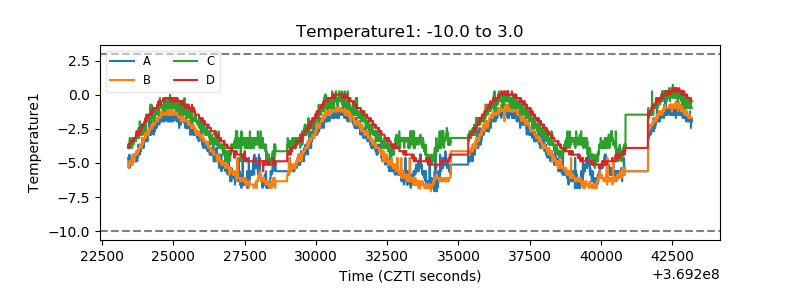 |
| Veto HV Monitor | 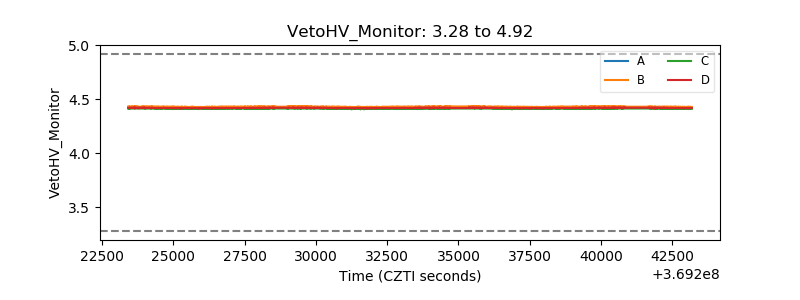 |
| Veto LLD | 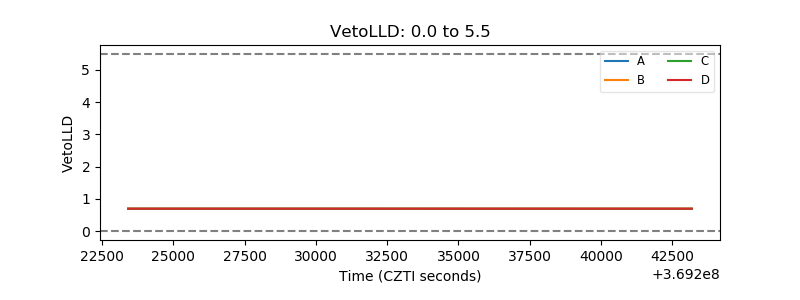 |
| Alpha Counter | 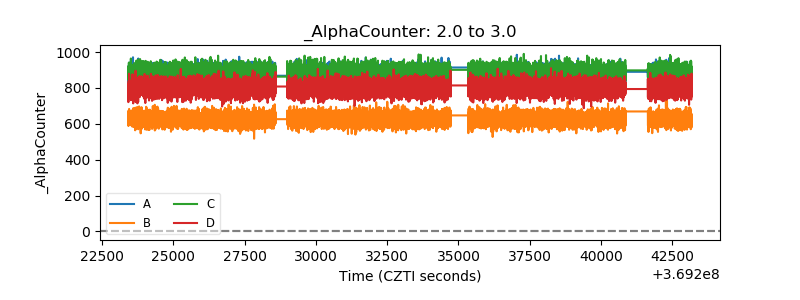 |
| _CPM_Rate | 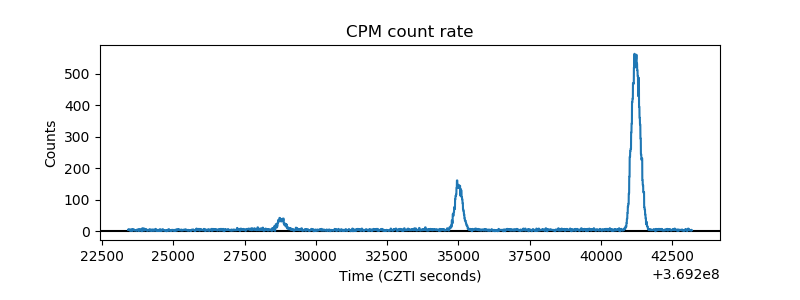 |
| CZT Counter | 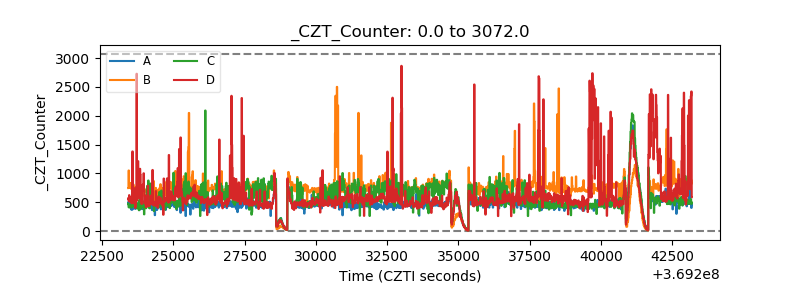 |
| +2.5 Volts monitor |  |
| +5 Volts monitor |  |
| _ROLL_ROT | 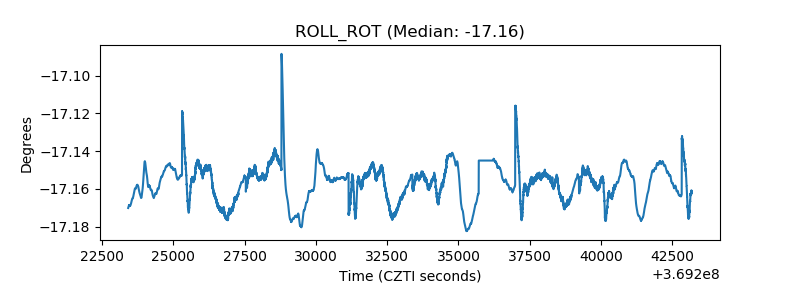 |
| _Roll_DEC | 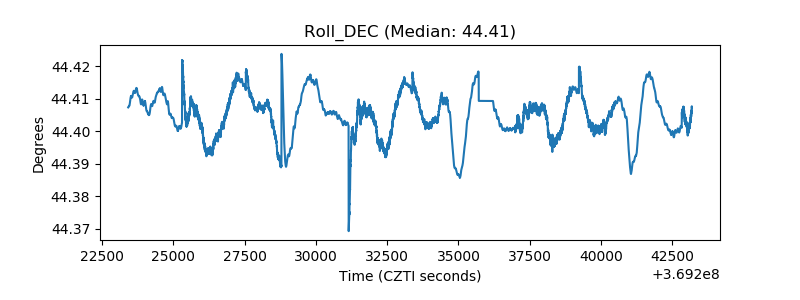 |
| _Roll_RA | 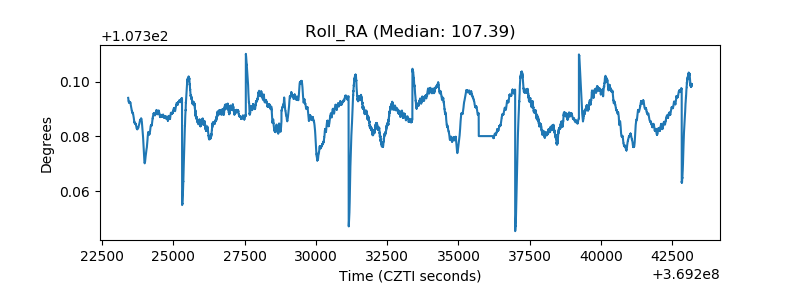 |
| Veto Counter | 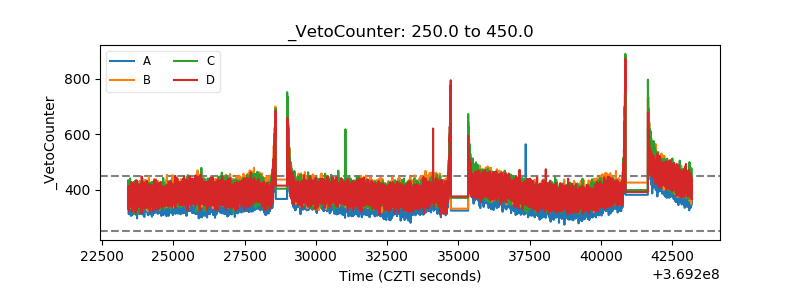 |