| Param | Original file | Final file |
|---|---|---|
| Filename | modeM0/AS1A10_057T01_9000004692_32231cztM0_level2.evt | modeM0/AS1A10_057T01_9000004692_32231cztM0_level2_quad_clean.evt |
| Size (bytes) | 607,656,960 | 63,305,280 |
| Size | 579.5 MB | 60.4 MB |
| Events in quadrant A | 3,118,822 | 374,862 |
| Events in quadrant B | 5,526,156 | 371,255 |
| Events in quadrant C | 3,538,477 | 369,395 |
| Events in quadrant D | 5,786,023 | 354,068 |
| Mode M0 | |||
|---|---|---|---|
| Quadrant | BADHDUFLAG | Total packets | Discarded packets |
| A | 0 | 13353 | 1 |
| B | 0 | 20752 | 2 |
| C | 0 | 14506 | 1 |
| D | 0 | 21660 | 1 |
| Mode SS | |||
|---|---|---|---|
| Quadrant | BADHDUFLAG | Total packets | Discarded packets |
| A | 0 | 130 | 0 |
| B | 0 | 130 | 0 |
| C | 0 | 130 | 0 |
| D | 0 | 130 | 0 |
| Mode M9 | |||
|---|---|---|---|
| Quadrant | BADHDUFLAG | Total packets | Discarded packets |
| A | 0 | 10 | 0 |
| B | 0 | 10 | 0 |
| C | 0 | 10 | 0 |
| D | 0 | 10 | 0 |
| Quadrant | Total seconds | Saturated seconds | Saturation percentage |
|---|---|---|---|
| A | 6406 | 49 | 0.764908% |
| B | 6405 | 230 | 3.590945% |
| C | 6406 | 212 | 3.309397% |
| D | 6406 | 780 | 12.176085% |
Noise dominated data is calculated using 1-second bins in cleaned event files. If a bin has >2000 counts, and if more than 50% of those come from <1% of pixels, then it is considered to be noise-dominated and hence unusable.
| Quadrant | # 1 sec bins | Bins with >0 counts | Bins with >2000 counts | High rate bins dominated by noise | Noise dominated (total time) | Noise dominated (detector-on time) | Marked lightcurve |
|---|---|---|---|---|---|---|---|
| A | 7366 | 6407 | 0 | 0 | 0.00% | 0.00% | 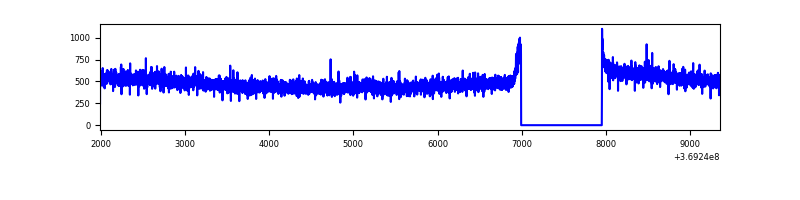 |
| B | 7365 | 6406 | 73 | 73 | 0.99% | 1.14% | 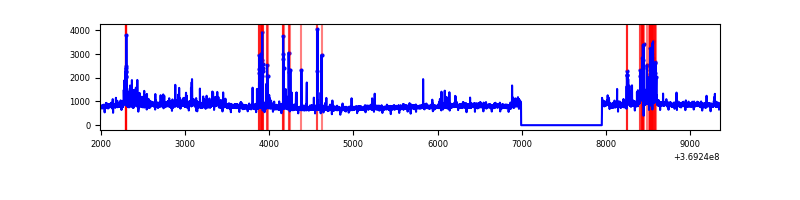 |
| C | 7366 | 6407 | 30 | 30 | 0.41% | 0.47% | 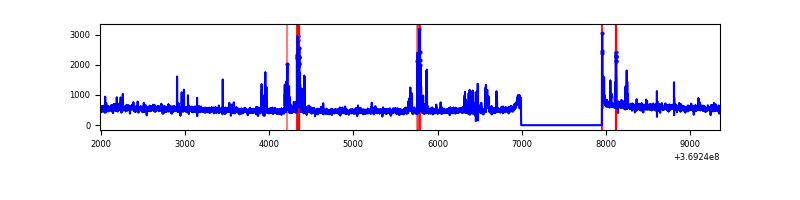 |
| D | 7366 | 6407 | 450 | 450 | 6.11% | 7.02% | 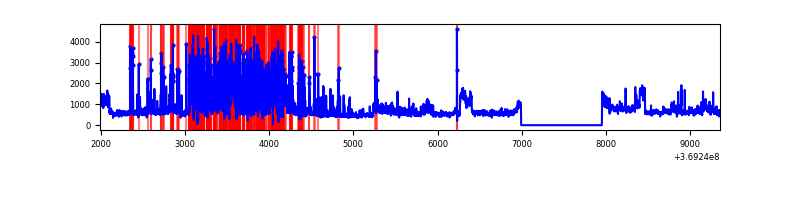 |
Top three noisy pixels from each quadrant. If the there are fewer than three noisy pixels in the level2.evt file, extra rows are filled as -1
| Pixel properties | Quadrant properties | ||||||
|---|---|---|---|---|---|---|---|
| Quadrant | DetID | PixID | Counts | Sigma | Mean | Median | Sigma |
| A | 13 | 254 | 13238 | 76.58 | 804 | 788 | 162.6 |
| A | 13 | 6 | 12934 | 74.71 | 804 | 788 | 162.6 |
| A | 3 | 137 | 8111 | 45.04 | 804 | 788 | 162.6 |
| B | 6 | 159 | 1901703 | 12750.14 | 789 | 769 | 149.1 |
| B | 5 | 172 | 293324 | 1962.25 | 789 | 769 | 149.1 |
| B | 4 | 80 | 80844 | 537.09 | 789 | 769 | 149.1 |
| C | 15 | 208 | 205438 | 1131.06 | 772 | 778 | 180.9 |
| C | 14 | 238 | 150663 | 828.34 | 772 | 778 | 180.9 |
| C | 3 | 233 | 46614 | 253.31 | 772 | 778 | 180.9 |
| D | 12 | 218 | 1347867 | 7582.4 | 742 | 722 | 177.7 |
| D | 8 | 195 | 1062861 | 5978.24 | 742 | 722 | 177.7 |
| D | 13 | 249 | 218916 | 1228.1 | 742 | 722 | 177.7 |
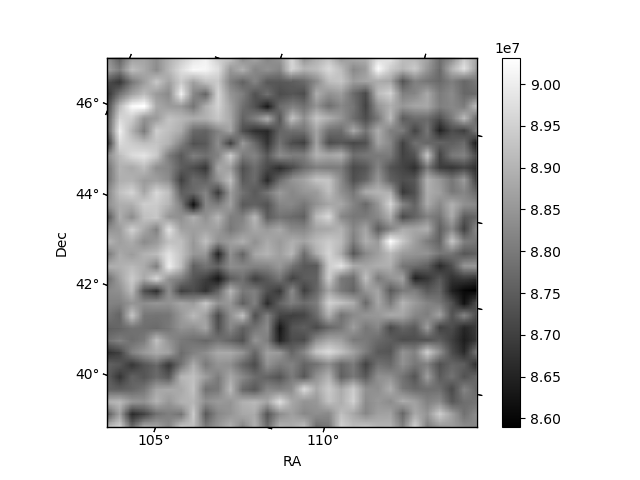
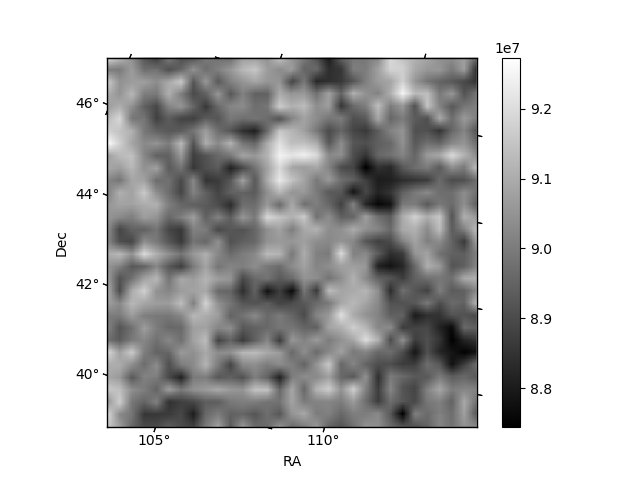
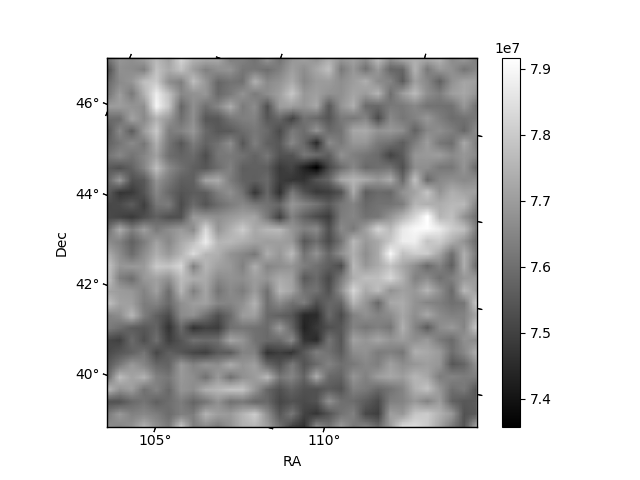
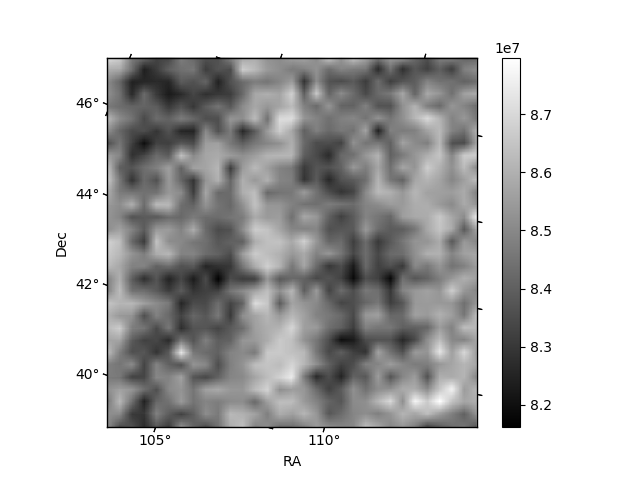
Histogram calculated using DETX and DETY for each event in the final _common_clean file
| Quadrant A |  |
 |
Quadrant B |
|---|---|---|---|
| Quadrant D | 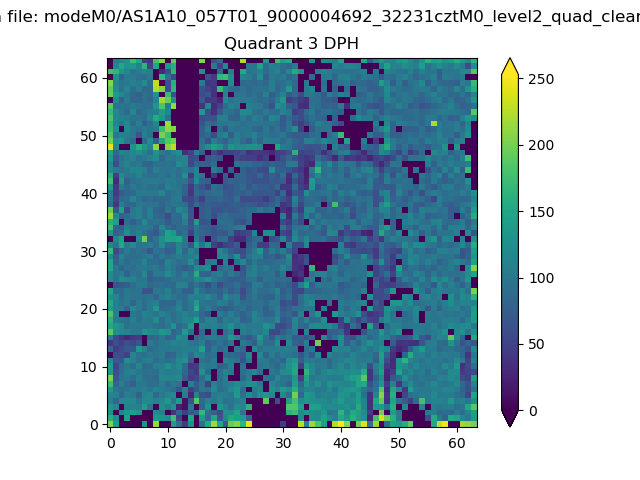 |
 |
Quadrant C |
| Plot type | Count rate plots | Images |
|---|---|---|
| Comparison with Poisson distribution Blue bars denote a histogram of data divided into 1 sec bins. Red curve is a Poisson curve with rate = median count rate of data. |
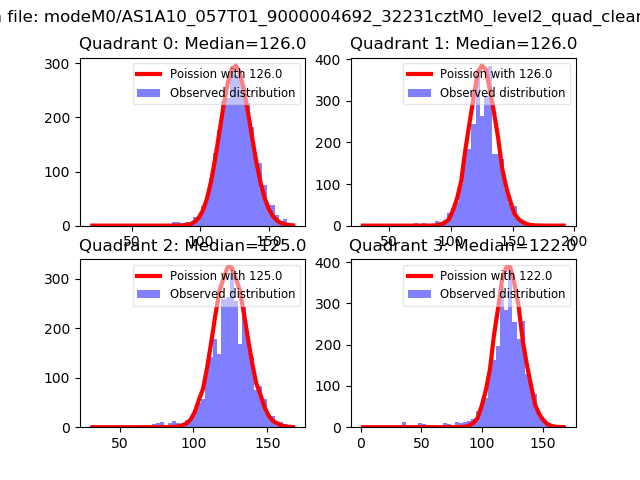 |
 |
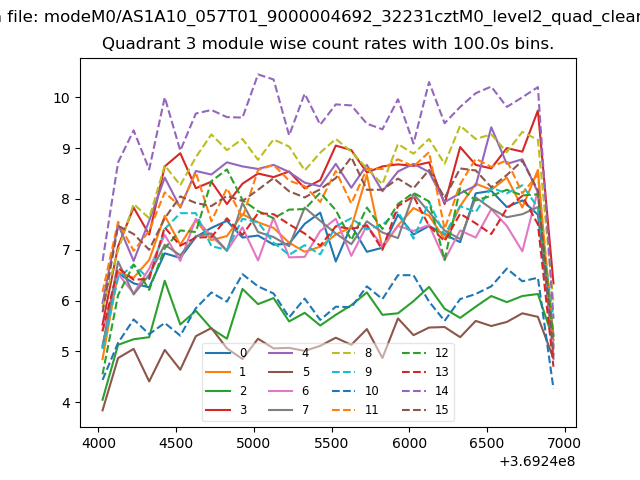
| Quadrant-wise count rates Data is divided into 100 sec bins |
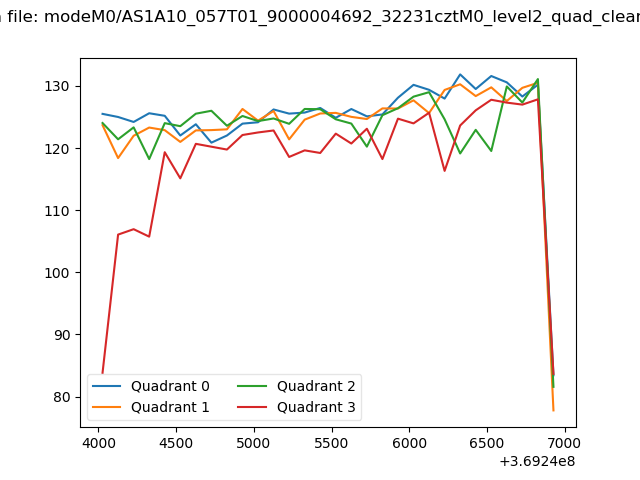 |
|
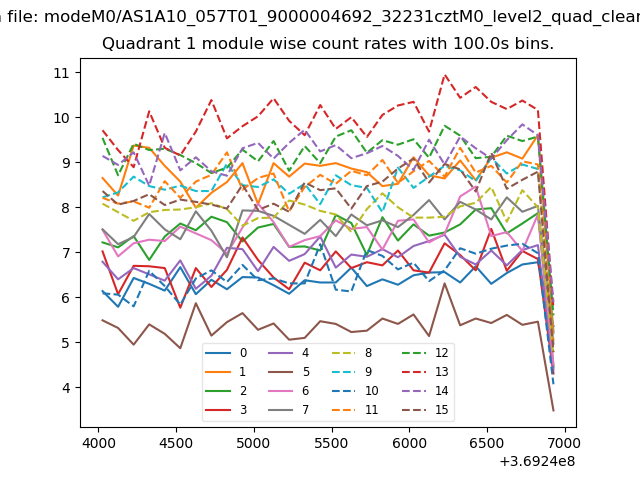
| Module-wise count rates for Quadrant A Data is divided into 100 sec bins |
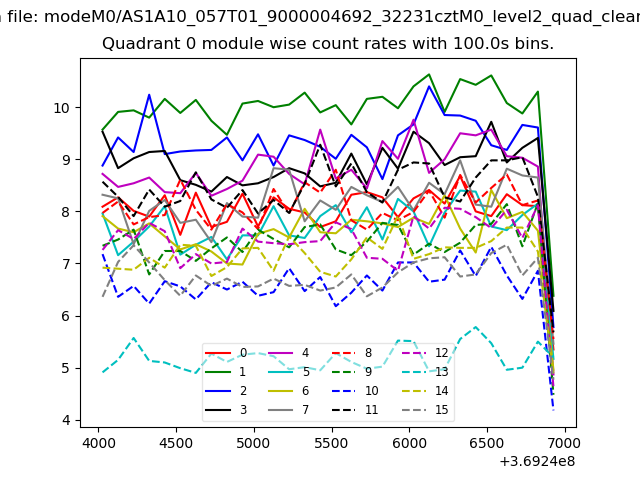 |
 |
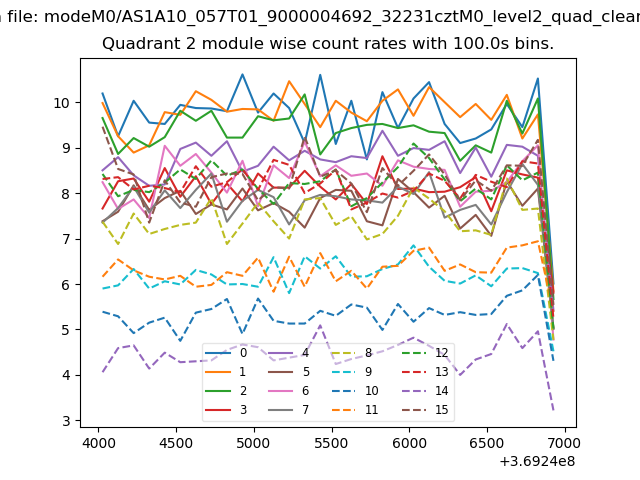
| Module-wise count rates for Quadrant B Data is divided into 100 sec bins |
 |
 |
| Module-wise count rates for Quadrant C Data is divided into 100 sec bins |
 |
 |
| Module-wise count rates for Quadrant D Data is divided into 100 sec bins |
 |
 |
| Parameter | Plot |
|---|---|
| CZT HV Monitor | 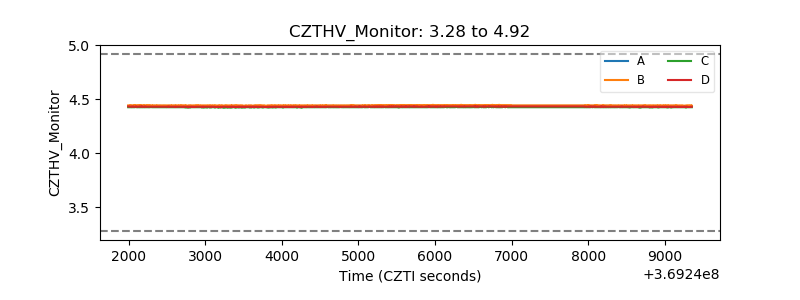 |
| D_VDD | 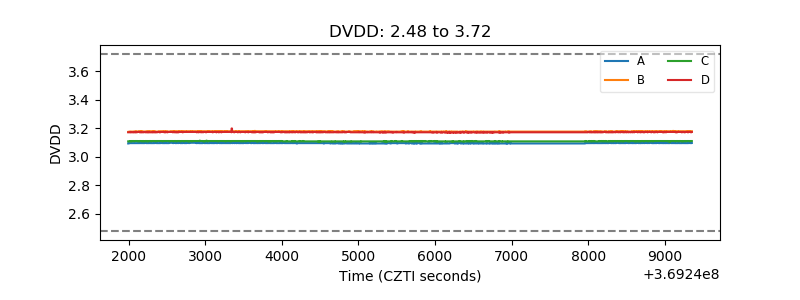 |
| Temperature 1 | 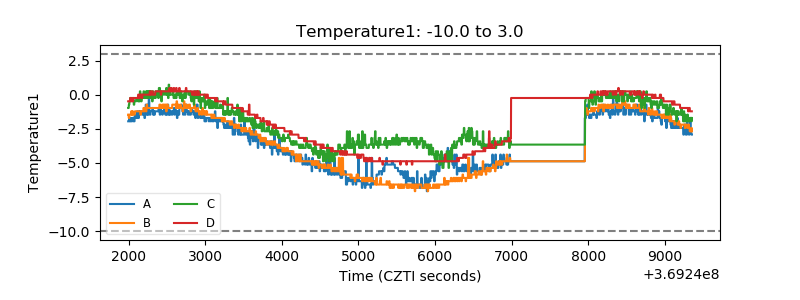 |
| Veto HV Monitor | 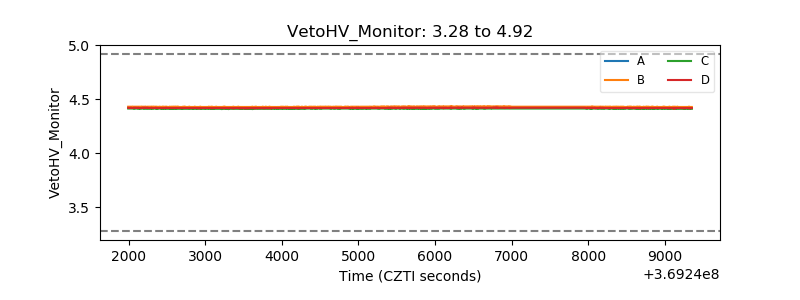 |
| Veto LLD | 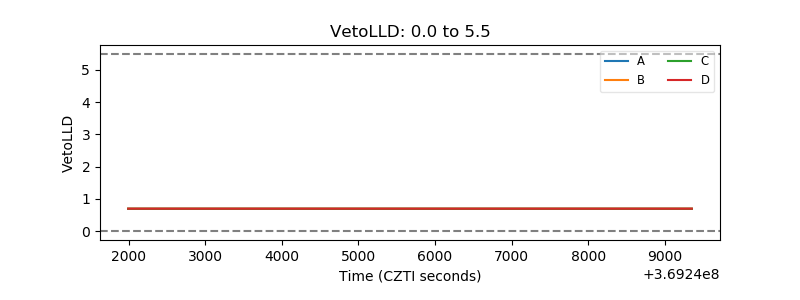 |
| Alpha Counter | 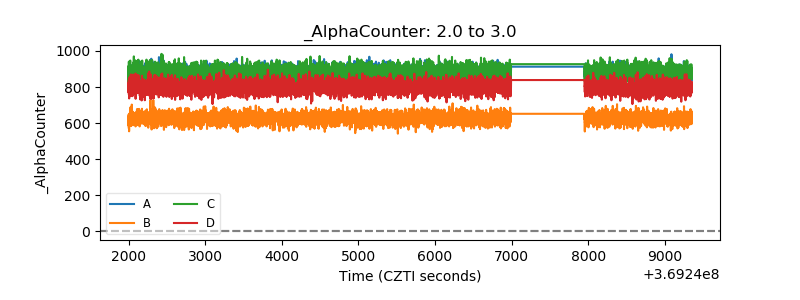 |
| _CPM_Rate | 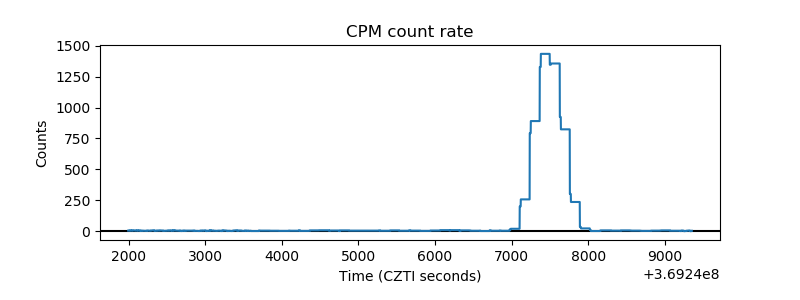 |
| CZT Counter |  |
| +2.5 Volts monitor |  |
| +5 Volts monitor |  |
| _ROLL_ROT | 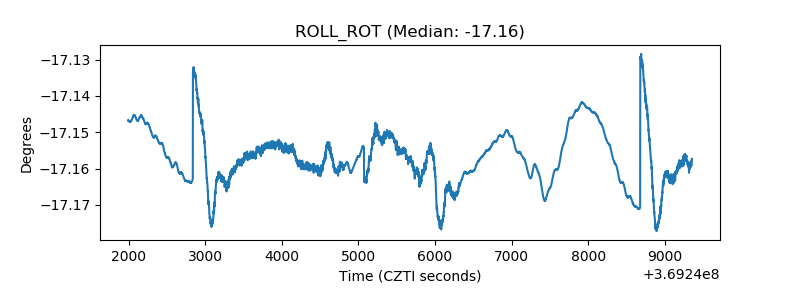 |
| _Roll_DEC | 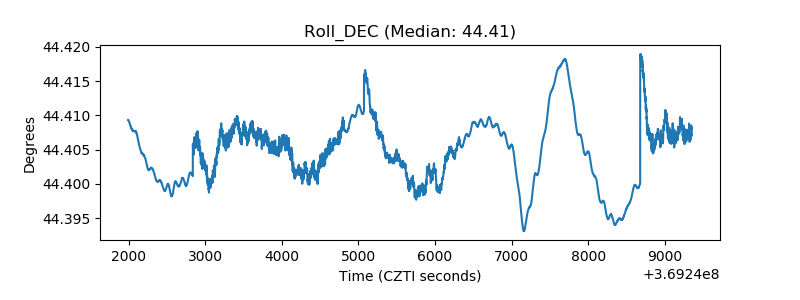 |
| _Roll_RA | 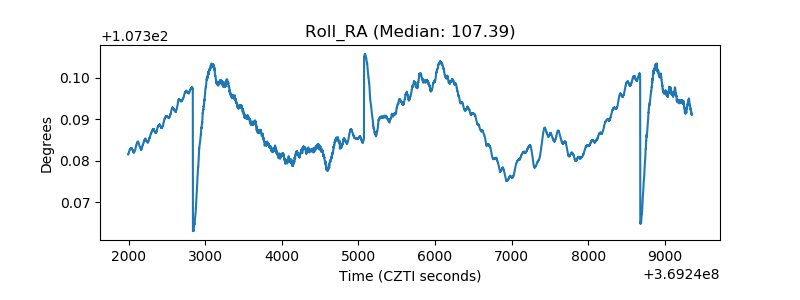 |
| Veto Counter | 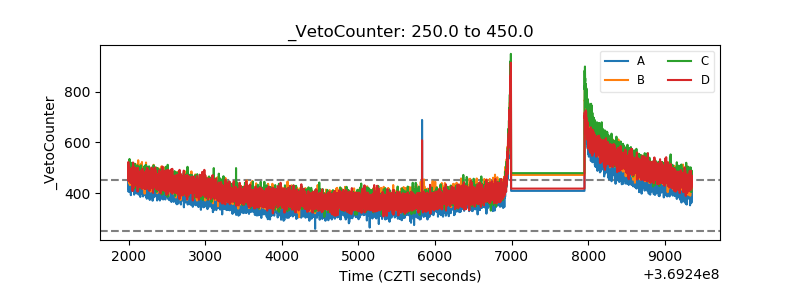 |