| Param | Original file | Final file |
|---|---|---|
| Filename | modeM0/AS1A10_057T01_9000004692_32233cztM0_level2.evt | modeM0/AS1A10_057T01_9000004692_32233cztM0_level2_quad_clean.evt |
| Size (bytes) | 578,223,360 | 70,012,800 |
| Size | 551.4 MB | 66.8 MB |
| Events in quadrant A | 3,230,821 | 423,673 |
| Events in quadrant B | 5,655,186 | 416,955 |
| Events in quadrant C | 3,622,949 | 420,596 |
| Events in quadrant D | 4,568,720 | 410,981 |
| Mode M0 | |||
|---|---|---|---|
| Quadrant | BADHDUFLAG | Total packets | Discarded packets |
| A | 0 | 13845 | 2 |
| B | 0 | 21423 | 2 |
| C | 0 | 15058 | 2 |
| D | 0 | 17934 | 2 |
| Mode SS | |||
|---|---|---|---|
| Quadrant | BADHDUFLAG | Total packets | Discarded packets |
| A | 0 | 132 | 0 |
| B | 0 | 132 | 0 |
| C | 0 | 132 | 0 |
| D | 0 | 132 | 0 |
| Mode M9 | |||
|---|---|---|---|
| Quadrant | BADHDUFLAG | Total packets | Discarded packets |
| A | 0 | 11 | 0 |
| B | 0 | 11 | 0 |
| C | 0 | 11 | 0 |
| D | 0 | 11 | 0 |
| Quadrant | Total seconds | Saturated seconds | Saturation percentage |
|---|---|---|---|
| A | 6409 | 26 | 0.405680% |
| B | 6410 | 219 | 3.416537% |
| C | 6410 | 182 | 2.839314% |
| D | 6410 | 110 | 1.716069% |
Noise dominated data is calculated using 1-second bins in cleaned event files. If a bin has >2000 counts, and if more than 50% of those come from <1% of pixels, then it is considered to be noise-dominated and hence unusable.
| Quadrant | # 1 sec bins | Bins with >0 counts | Bins with >2000 counts | High rate bins dominated by noise | Noise dominated (total time) | Noise dominated (detector-on time) | Marked lightcurve |
|---|---|---|---|---|---|---|---|
| A | 7534 | 6410 | 0 | 0 | 0.00% | 0.00% | 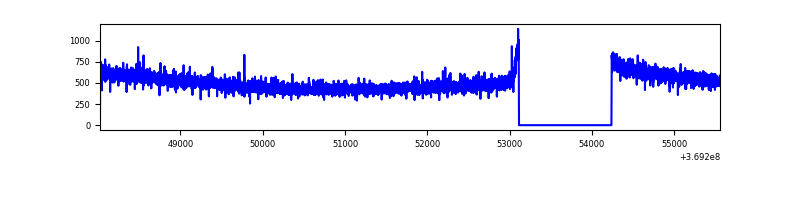 |
| B | 7535 | 6411 | 59 | 59 | 0.78% | 0.92% | 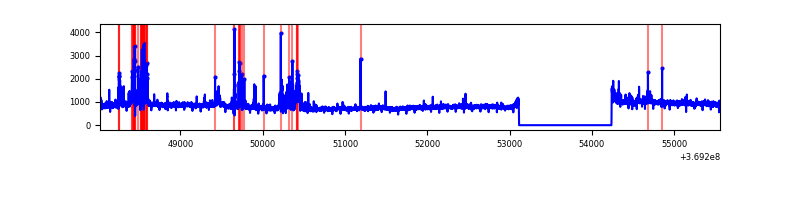 |
| C | 7535 | 6411 | 26 | 26 | 0.35% | 0.41% | 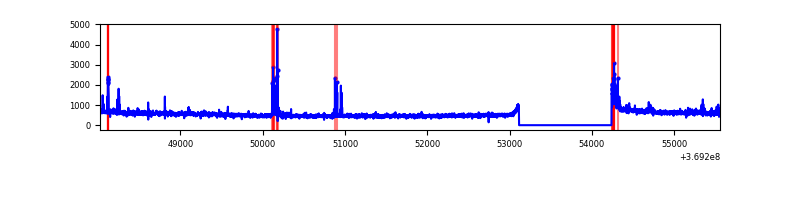 |
| D | 7535 | 6411 | 33 | 33 | 0.44% | 0.51% | 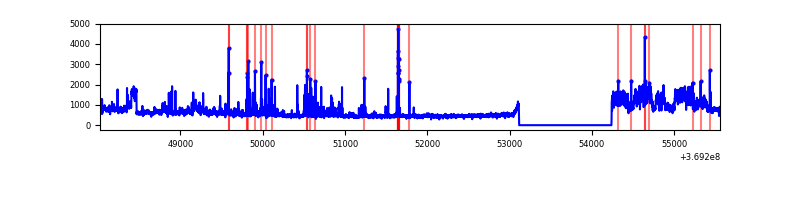 |
Top three noisy pixels from each quadrant. If the there are fewer than three noisy pixels in the level2.evt file, extra rows are filled as -1
| Pixel properties | Quadrant properties | ||||||
|---|---|---|---|---|---|---|---|
| Quadrant | DetID | PixID | Counts | Sigma | Mean | Median | Sigma |
| A | 13 | 6 | 12465 | 69.43 | 833 | 817 | 167.8 |
| A | 13 | 254 | 12293 | 68.41 | 833 | 817 | 167.8 |
| A | 3 | 137 | 7787 | 41.55 | 833 | 817 | 167.8 |
| B | 6 | 159 | 1915801 | 12473.71 | 821 | 800 | 153.5 |
| B | 5 | 172 | 228282 | 1481.75 | 821 | 800 | 153.5 |
| B | 4 | 80 | 184111 | 1194.03 | 821 | 800 | 153.5 |
| C | 14 | 238 | 140430 | 740.78 | 808 | 815 | 188.5 |
| C | 15 | 208 | 120371 | 634.35 | 808 | 815 | 188.5 |
| C | 0 | 10 | 68792 | 360.68 | 808 | 815 | 188.5 |
| D | 8 | 195 | 1112847 | 5786.3 | 813 | 794 | 192.2 |
| D | 2 | 250 | 219935 | 1140.25 | 813 | 794 | 192.2 |
| D | 13 | 249 | 91285 | 470.85 | 813 | 794 | 192.2 |
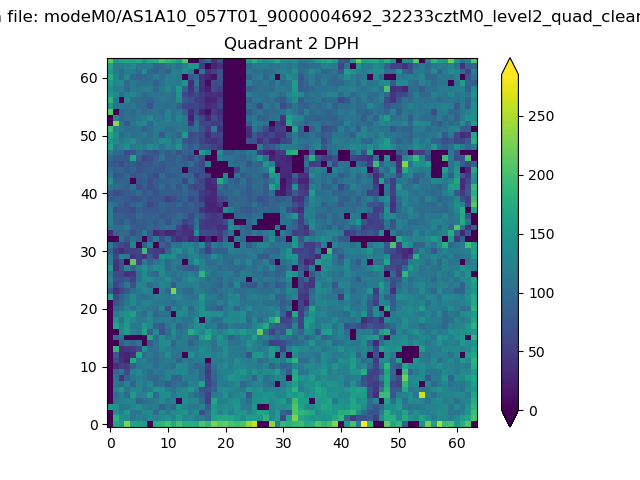
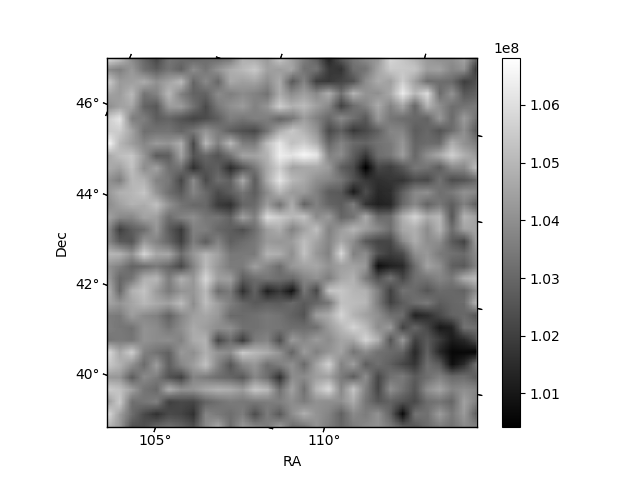
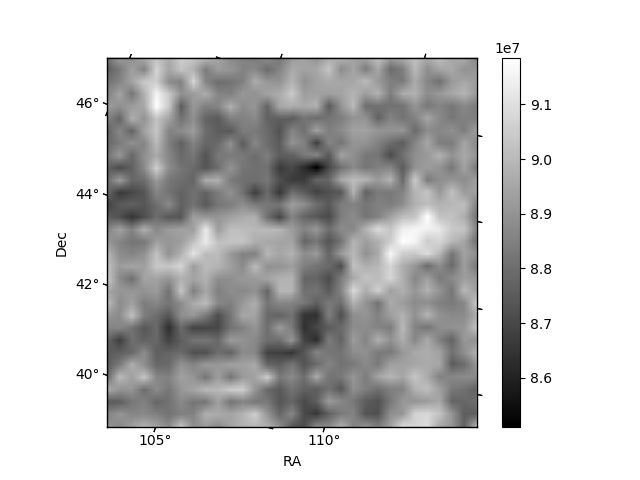
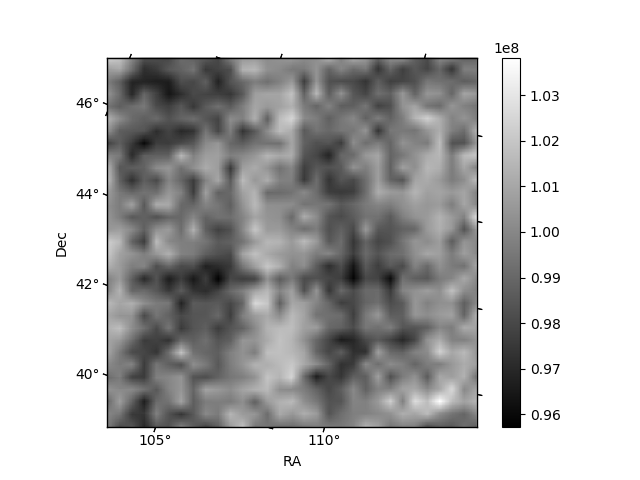
Histogram calculated using DETX and DETY for each event in the final _common_clean file
| Quadrant A | 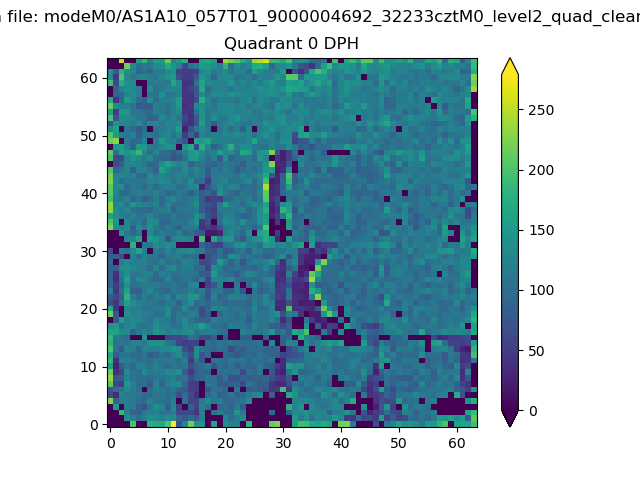 |
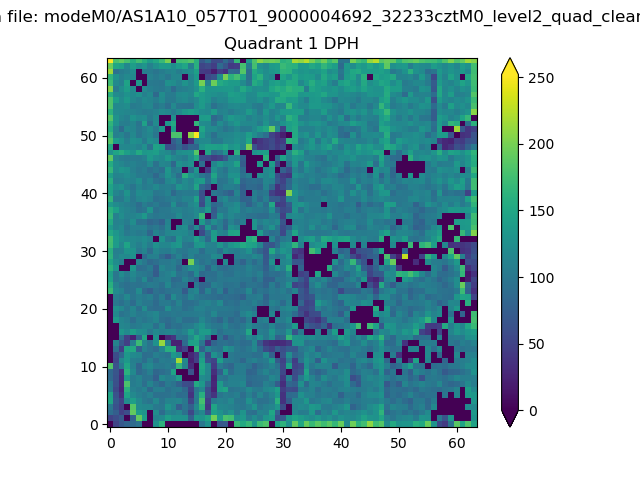 |
Quadrant B |
|---|---|---|---|
| Quadrant D | 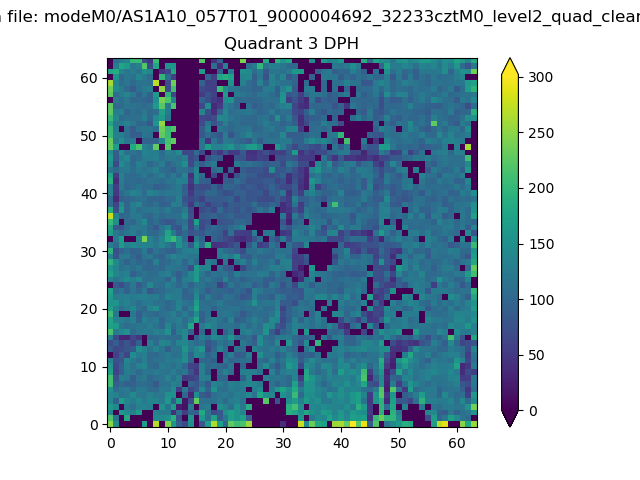 |
 |
Quadrant C |
| Plot type | Count rate plots | Images |
|---|---|---|
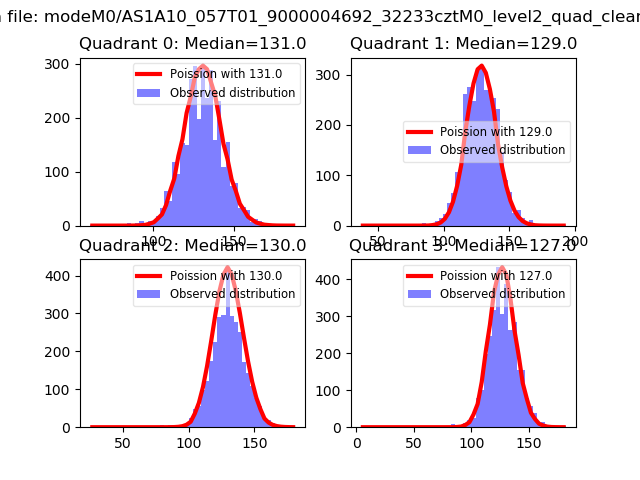
| Comparison with Poisson distribution Blue bars denote a histogram of data divided into 1 sec bins. Red curve is a Poisson curve with rate = median count rate of data. |
 |
 |
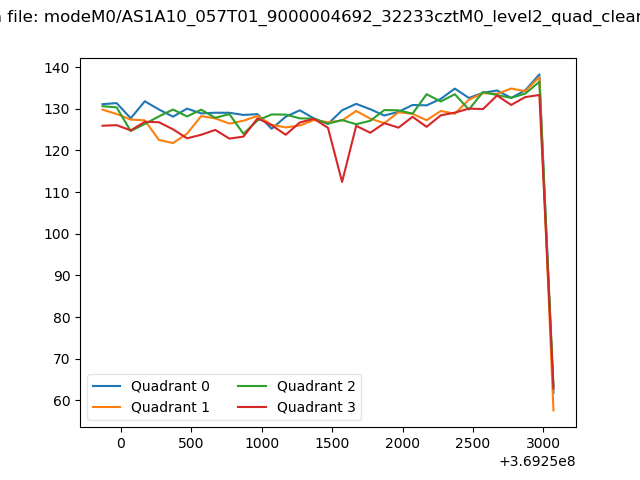
| Quadrant-wise count rates Data is divided into 100 sec bins |
 |
|
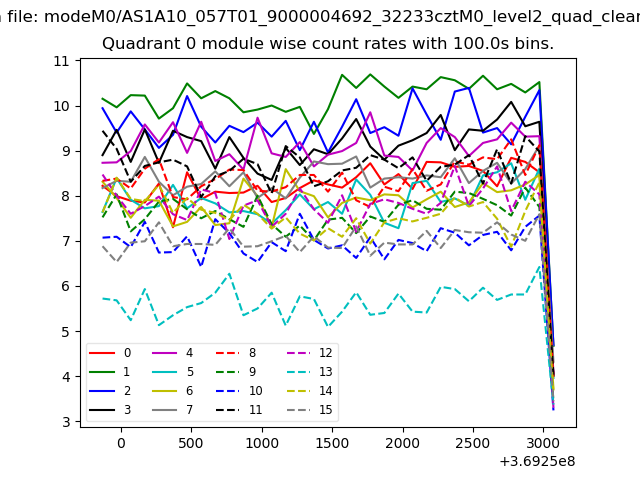
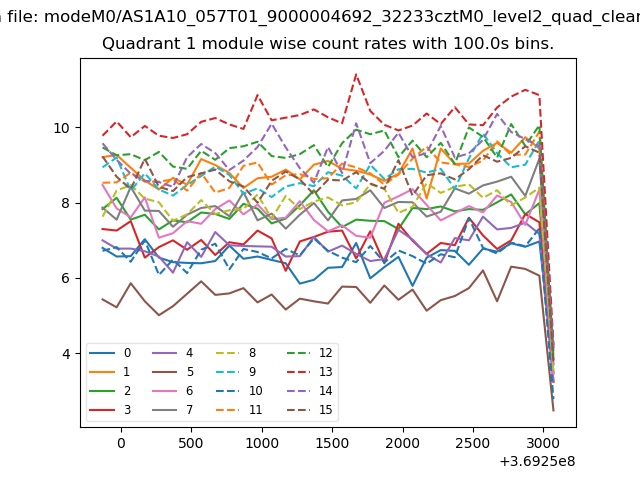
| Module-wise count rates for Quadrant A Data is divided into 100 sec bins |
 |
 |
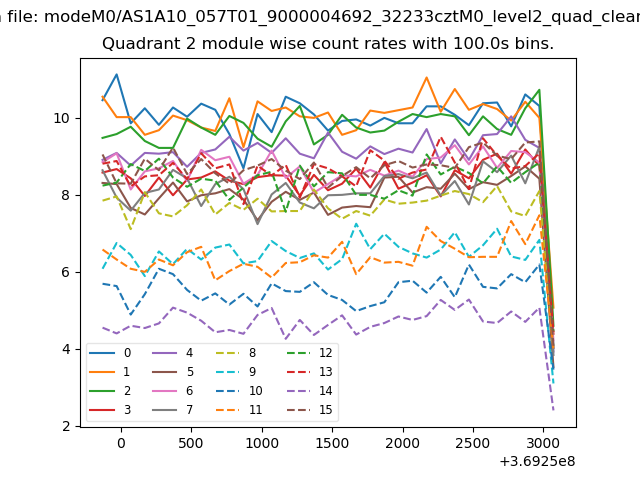
| Module-wise count rates for Quadrant B Data is divided into 100 sec bins |
 |
 |
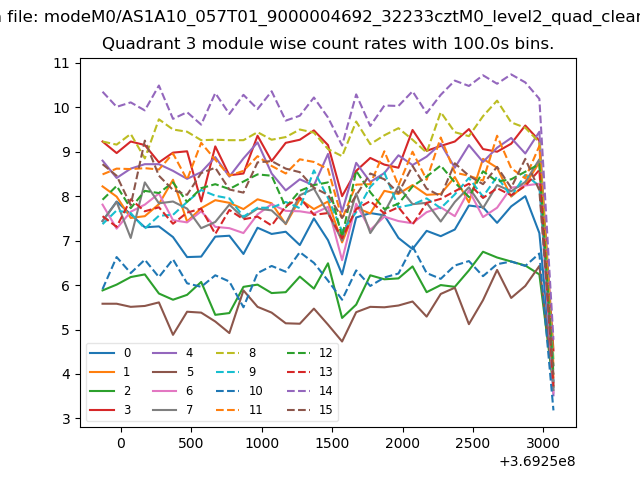
| Module-wise count rates for Quadrant C Data is divided into 100 sec bins |
 |
 |
| Module-wise count rates for Quadrant D Data is divided into 100 sec bins |
 |
 |
| Parameter | Plot |
|---|---|
| CZT HV Monitor | 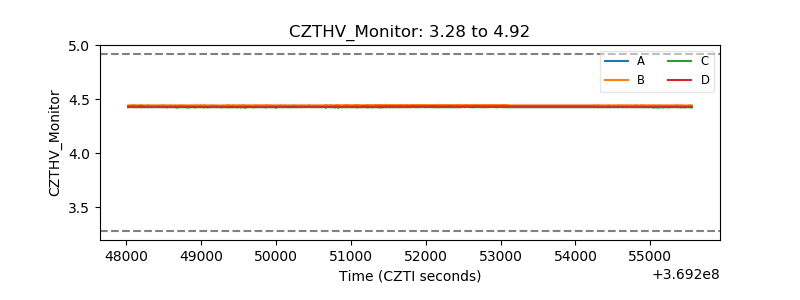 |
| D_VDD | 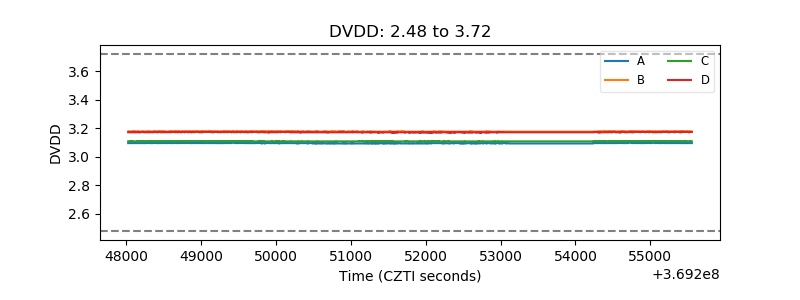 |
| Temperature 1 | 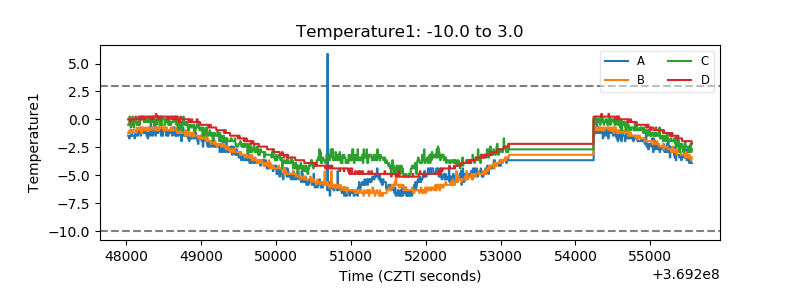 |
| Veto HV Monitor | 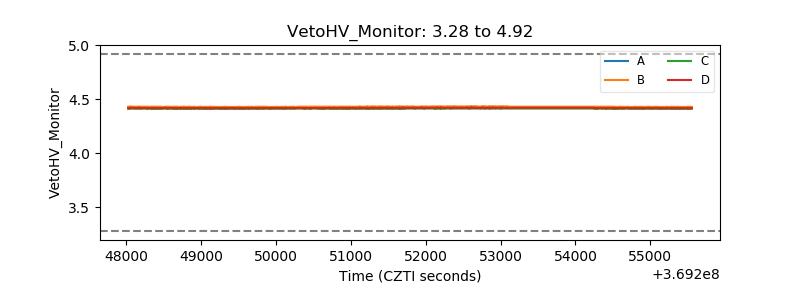 |
| Veto LLD | 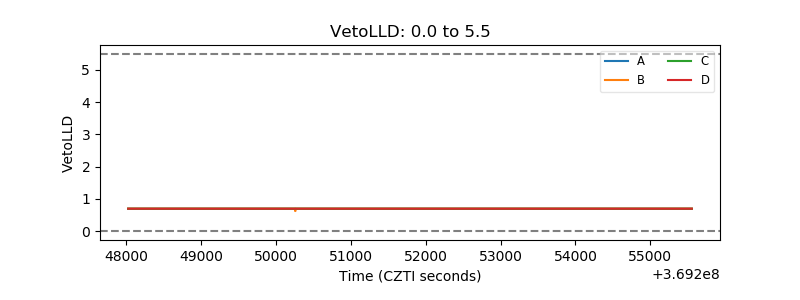 |
| Alpha Counter | 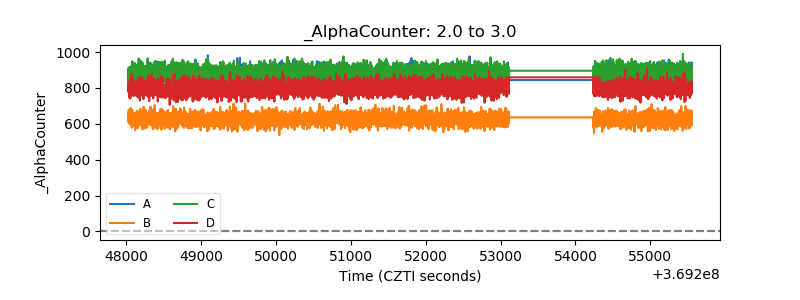 |
| _CPM_Rate | 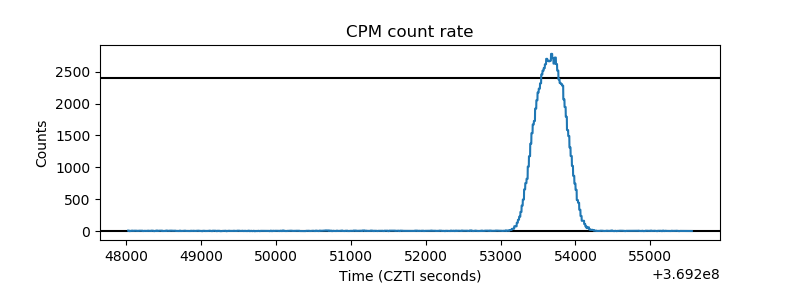 |
| CZT Counter | 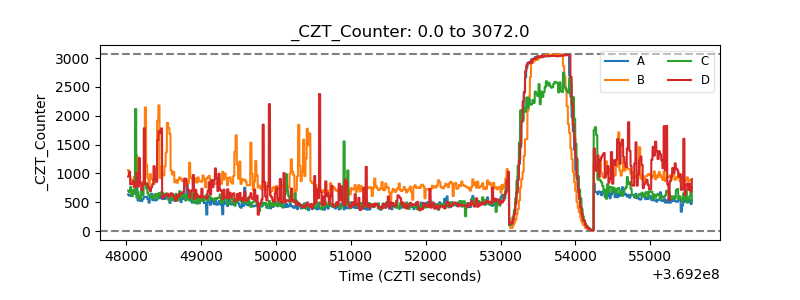 |
| +2.5 Volts monitor | 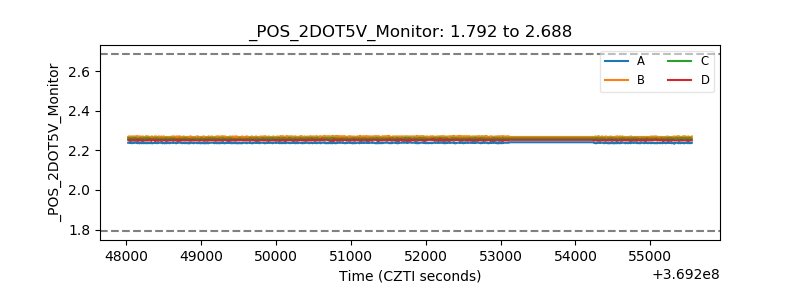 |
| +5 Volts monitor | 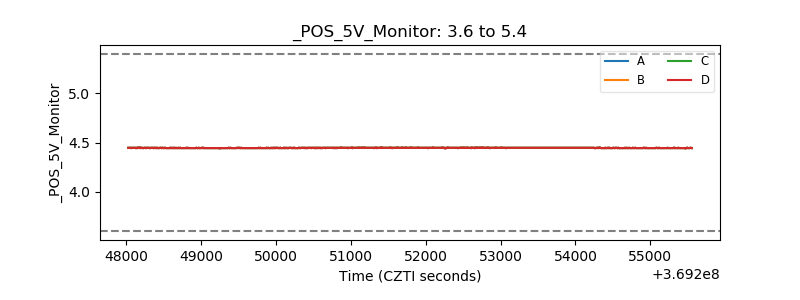 |
| _ROLL_ROT | 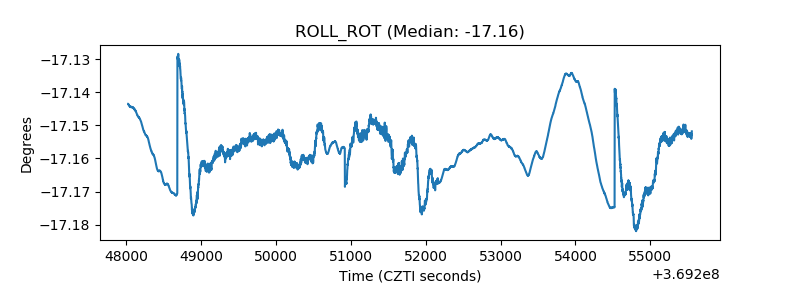 |
| _Roll_DEC |  |
| _Roll_RA | 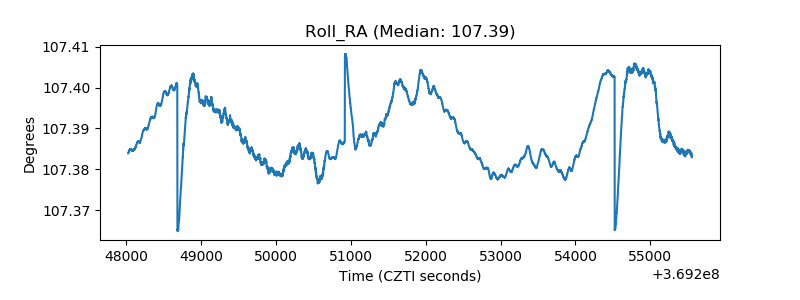 |
| Veto Counter |  |