| Param | Original file | Final file |
|---|---|---|
| Filename | modeM0/AS1A10_057T01_9000004692_32234cztM0_level2.evt | modeM0/AS1A10_057T01_9000004692_32234cztM0_level2_quad_clean.evt |
| Size (bytes) | 209,393,280 | 14,650,560 |
| Size | 199.7 MB | 14.0 MB |
| Events in quadrant A | 1,052,934 | 76,427 |
| Events in quadrant B | 1,821,896 | 76,180 |
| Events in quadrant C | 1,175,726 | 76,779 |
| Events in quadrant D | 2,158,043 | 72,448 |
| Mode M0 | |||
|---|---|---|---|
| Quadrant | BADHDUFLAG | Total packets | Discarded packets |
| A | 0 | 4387 | 0 |
| B | 0 | 6838 | 0 |
| C | 0 | 4859 | 0 |
| D | 0 | 7779 | 0 |
| Mode SS | |||
|---|---|---|---|
| Quadrant | BADHDUFLAG | Total packets | Discarded packets |
| A | 0 | 40 | 0 |
| B | 0 | 40 | 0 |
| C | 0 | 40 | 0 |
| D | 0 | 40 | 0 |
| Quadrant | Total seconds | Saturated seconds | Saturation percentage |
|---|---|---|---|
| A | 1932 | 1 | 0.051760% |
| B | 1932 | 38 | 1.966874% |
| C | 1932 | 54 | 2.795031% |
| D | 1933 | 41 | 2.121055% |
Noise dominated data is calculated using 1-second bins in cleaned event files. If a bin has >2000 counts, and if more than 50% of those come from <1% of pixels, then it is considered to be noise-dominated and hence unusable.
| Quadrant | # 1 sec bins | Bins with >0 counts | Bins with >2000 counts | High rate bins dominated by noise | Noise dominated (total time) | Noise dominated (detector-on time) | Marked lightcurve |
|---|---|---|---|---|---|---|---|
| A | 1932 | 1932 | 0 | 0 | 0.00% | 0.00% | 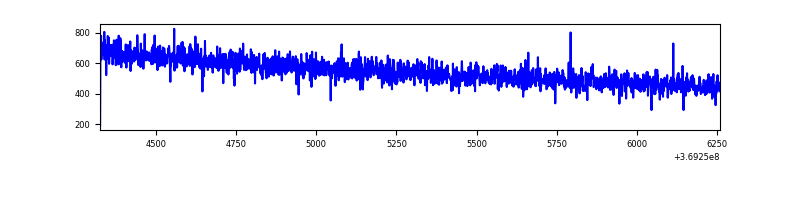 |
| B | 1932 | 1932 | 9 | 9 | 0.47% | 0.47% | 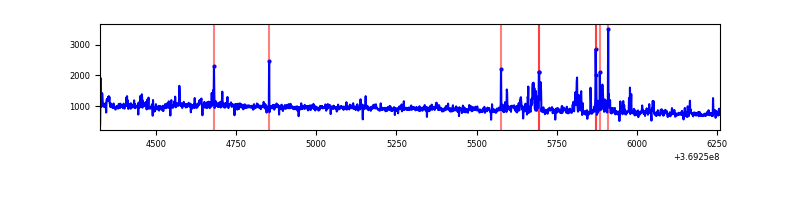 |
| C | 1932 | 1932 | 0 | 0 | 0.00% | 0.00% | 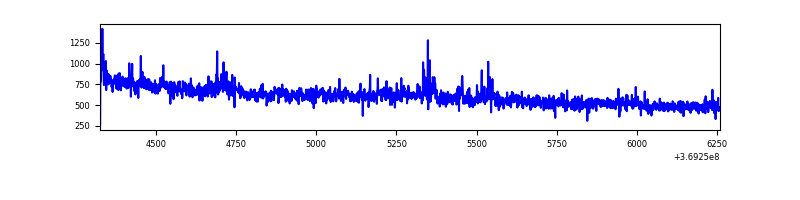 |
| D | 1933 | 1933 | 10 | 10 | 0.52% | 0.52% | 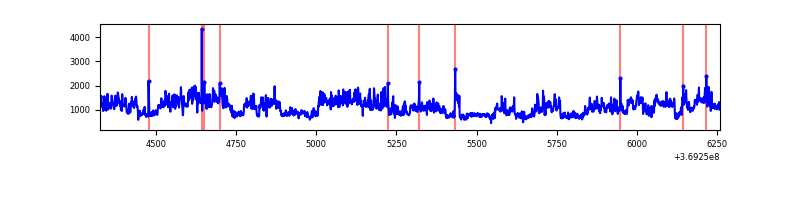 |
Top three noisy pixels from each quadrant. If the there are fewer than three noisy pixels in the level2.evt file, extra rows are filled as -1
| Pixel properties | Quadrant properties | ||||||
|---|---|---|---|---|---|---|---|
| Quadrant | DetID | PixID | Counts | Sigma | Mean | Median | Sigma |
| A | 13 | 254 | 3995 | 66.82 | 272 | 266 | 55.8 |
| A | 0 | 226 | 2390 | 38.06 | 272 | 266 | 55.8 |
| A | 3 | 137 | 2336 | 37.09 | 272 | 266 | 55.8 |
| B | 6 | 159 | 622039 | 12086.12 | 270 | 264 | 51.4 |
| B | 4 | 80 | 59446 | 1150.39 | 270 | 264 | 51.4 |
| B | 5 | 172 | 59047 | 1142.63 | 270 | 264 | 51.4 |
| C | 14 | 238 | 54384 | 843.51 | 269 | 271 | 64.2 |
| C | 4 | 175 | 25433 | 392.22 | 269 | 271 | 64.2 |
| C | 3 | 233 | 14313 | 218.88 | 269 | 271 | 64.2 |
| D | 8 | 195 | 1079440 | 16701.49 | 268 | 261 | 64.6 |
| D | 13 | 249 | 21079 | 322.18 | 268 | 261 | 64.6 |
| D | 2 | 250 | 20745 | 317.01 | 268 | 261 | 64.6 |
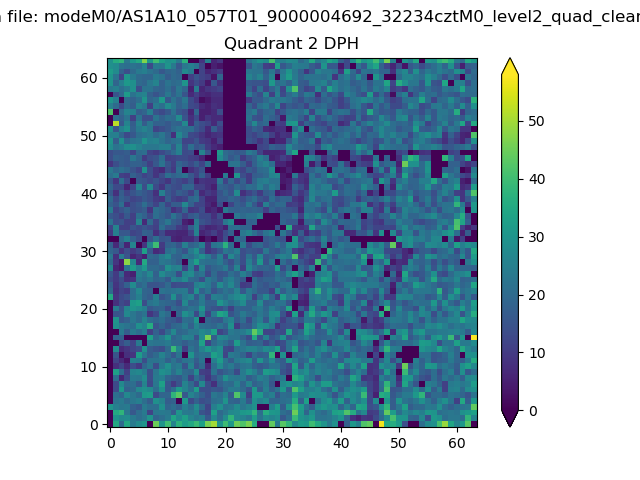
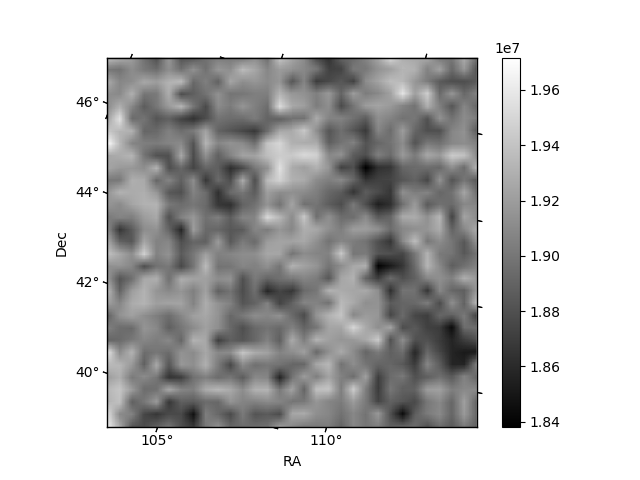
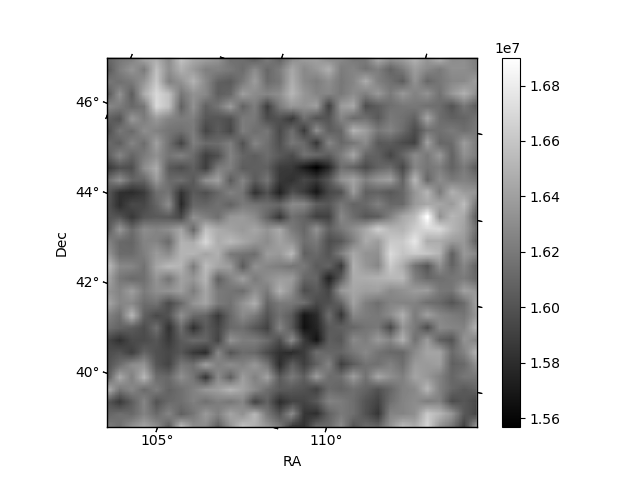
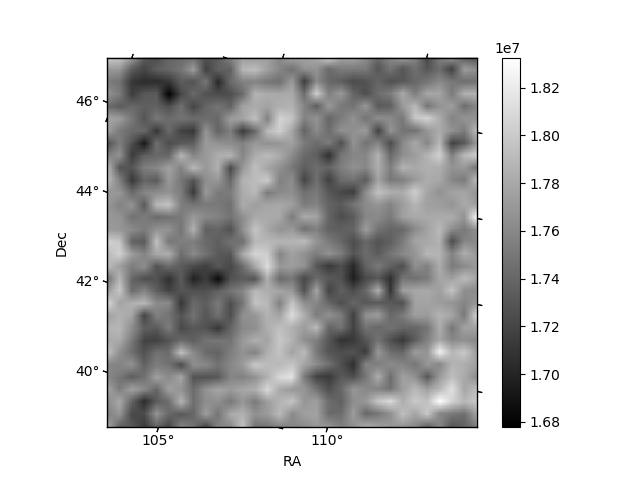
Histogram calculated using DETX and DETY for each event in the final _common_clean file
| Quadrant A | 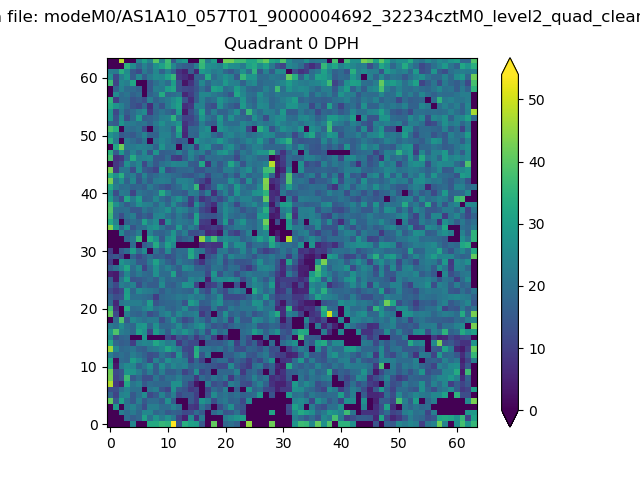 |
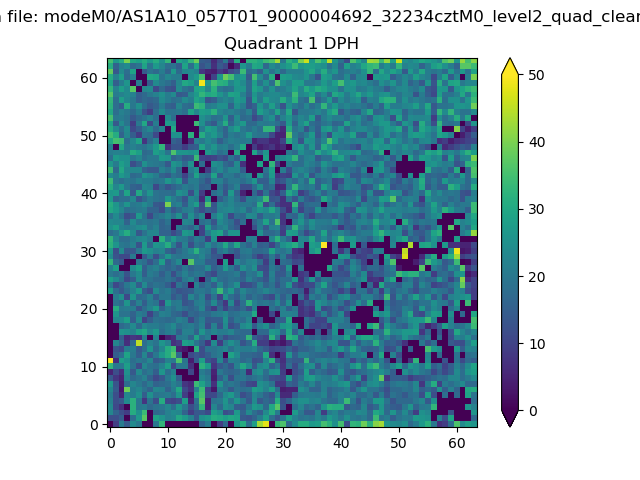 |
Quadrant B |
|---|---|---|---|
| Quadrant D | 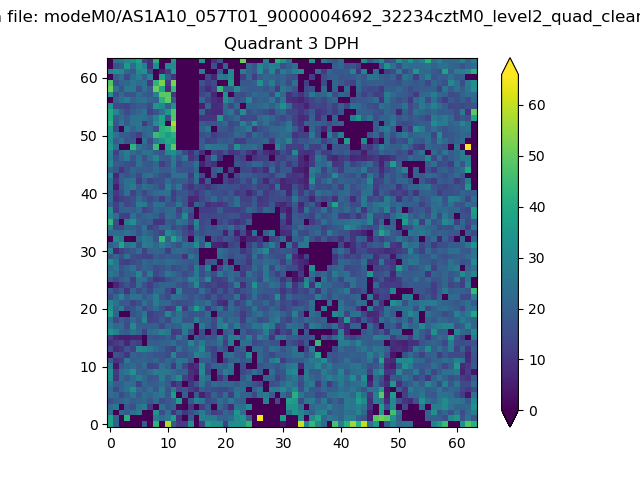 |
 |
Quadrant C |
| Plot type | Count rate plots | Images |
|---|---|---|
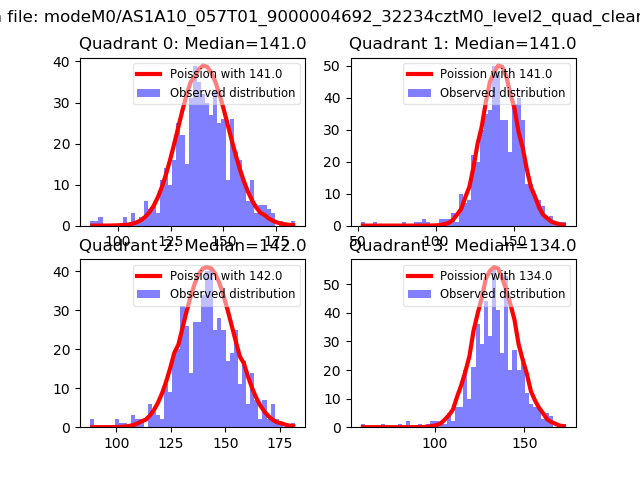
| Comparison with Poisson distribution Blue bars denote a histogram of data divided into 1 sec bins. Red curve is a Poisson curve with rate = median count rate of data. |
 |
 |
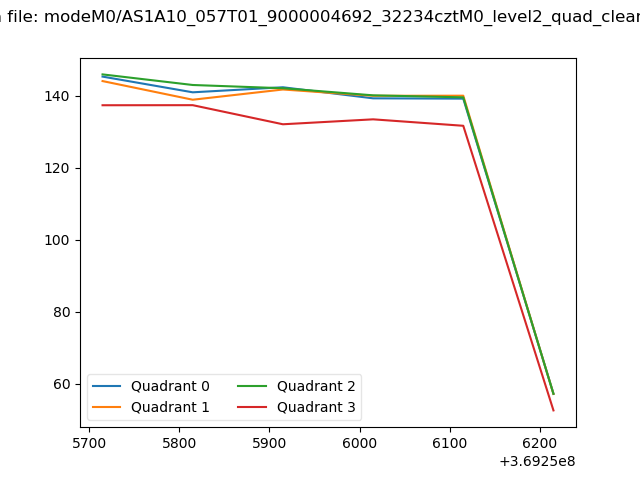
| Quadrant-wise count rates Data is divided into 100 sec bins |
 |
|
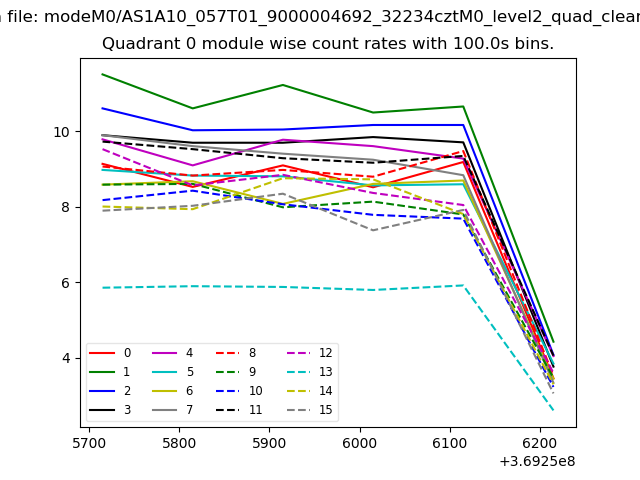
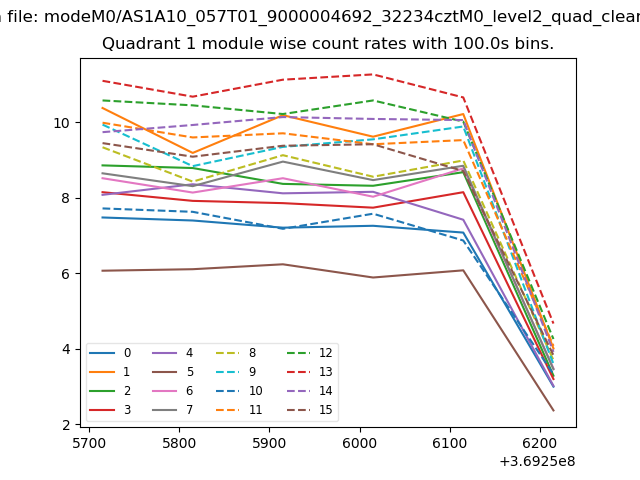
| Module-wise count rates for Quadrant A Data is divided into 100 sec bins |
 |
 |
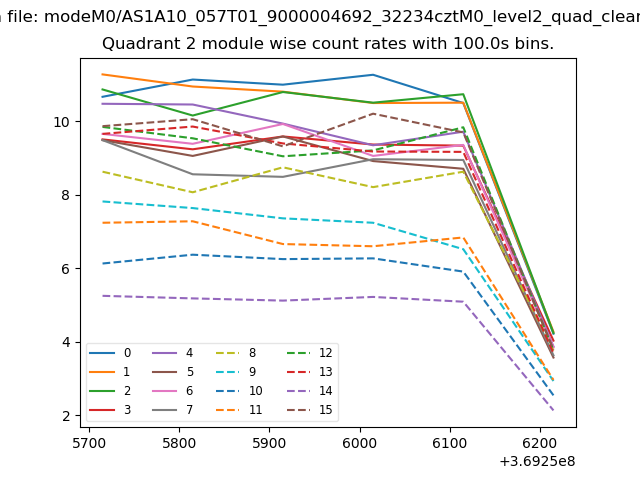
| Module-wise count rates for Quadrant B Data is divided into 100 sec bins |
 |
 |
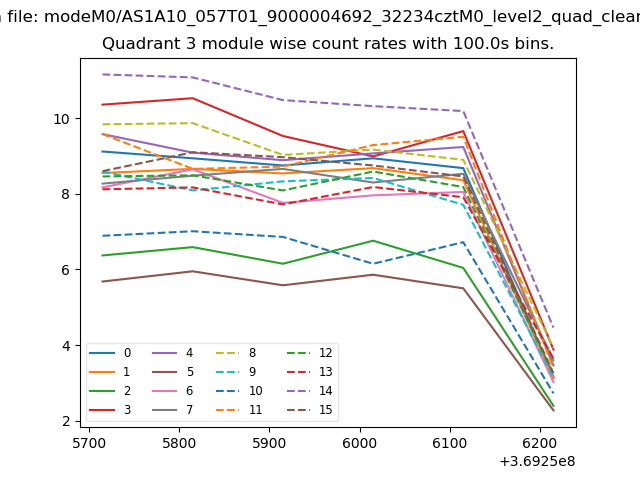
| Module-wise count rates for Quadrant C Data is divided into 100 sec bins |
 |
 |
| Module-wise count rates for Quadrant D Data is divided into 100 sec bins |
 |
 |
| Parameter | Plot |
|---|---|
| CZT HV Monitor | 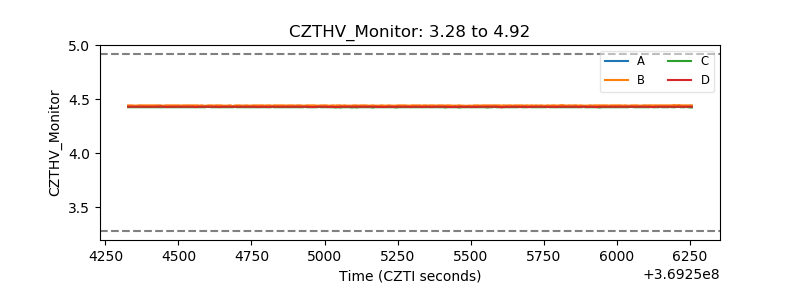 |
| D_VDD |  |
| Temperature 1 | 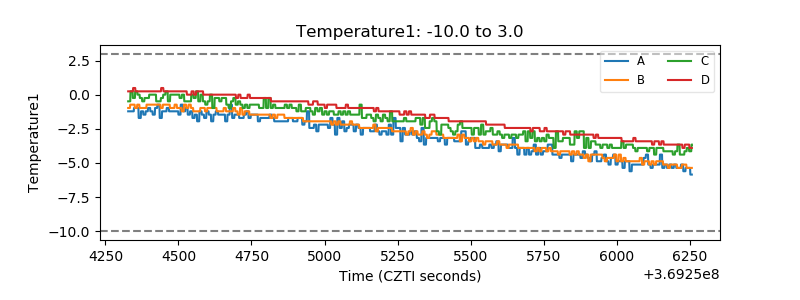 |
| Veto HV Monitor | 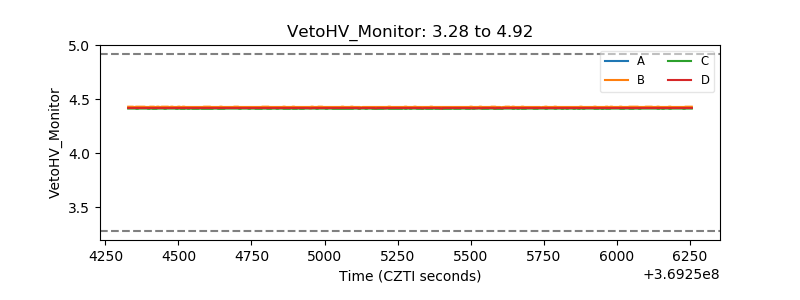 |
| Veto LLD | 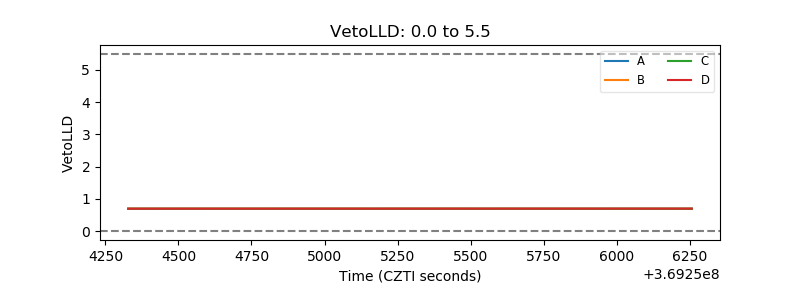 |
| Alpha Counter | 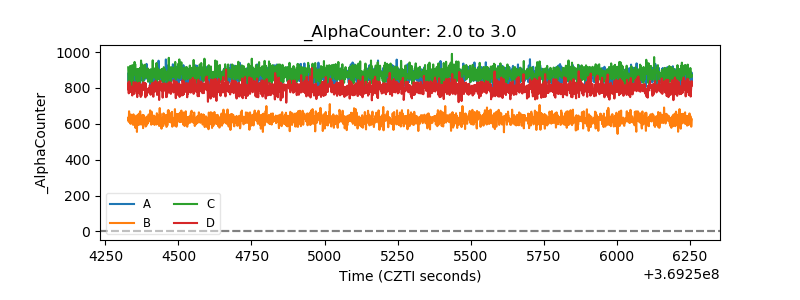 |
| _CPM_Rate | 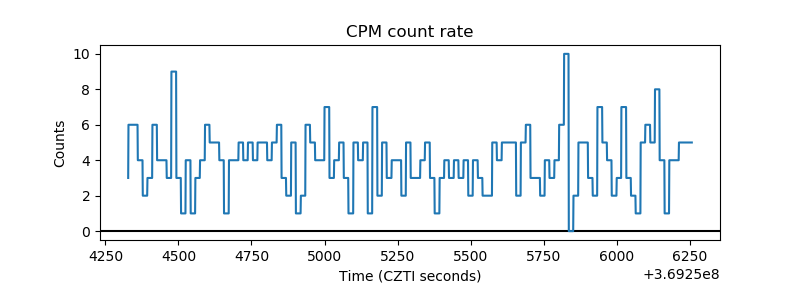 |
| CZT Counter | 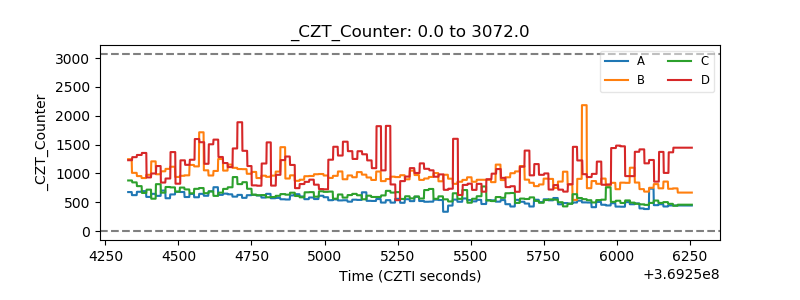 |
| +2.5 Volts monitor |  |
| +5 Volts monitor |  |
| _ROLL_ROT | 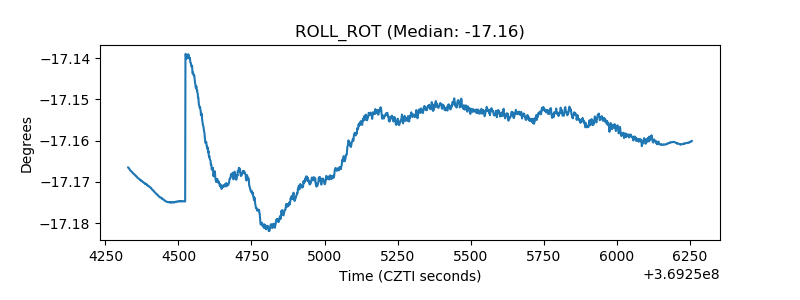 |
| _Roll_DEC | 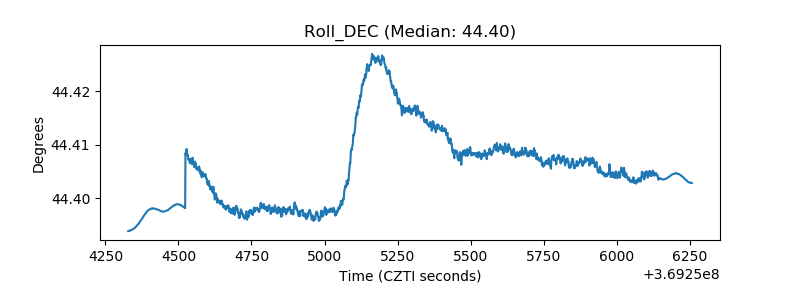 |
| _Roll_RA |  |
| Veto Counter | 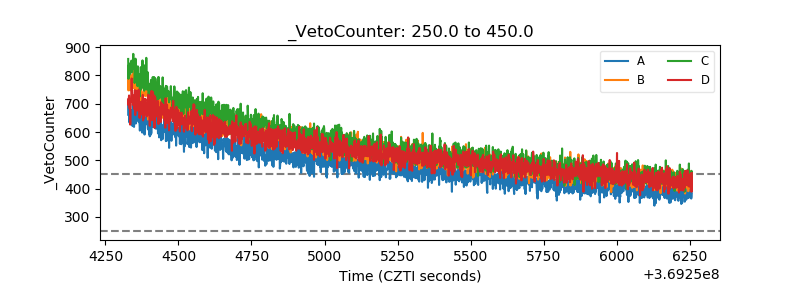 |