| Param | Original file | Final file |
|---|---|---|
| Filename | modeM0/AS1T04_054T01_9000004694cztM0_level2.fits | modeM0/AS1T04_054T01_9000004694cztM0_level2_quad_clean.evt |
| Size (bytes) | 1,021,806,720 | 744,471,360 |
| Size | 974.5 MB | 710.0 MB |
| Events in quadrant A | 6,455,832 | 4,205,915 |
| Events in quadrant B | 5,880,508 | 3,788,468 |
| Events in quadrant C | 6,131,884 | 3,940,583 |
| Events in quadrant D | 5,397,052 | 3,533,471 |
| Mode SS | |||
|---|---|---|---|
| Quadrant | BADHDUFLAG | Total packets | Discarded packets |
| A | 0 | 2100 | 0 |
| B | 0 | 2100 | 0 |
| C | 0 | 2100 | 0 |
| D | 0 | 2100 | 0 |
| Mode M0 | |||
|---|---|---|---|
| Quadrant | BADHDUFLAG | Total packets | Discarded packets |
| A | 0 | 216423 | 0 |
| B | 0 | 350762 | 0 |
| C | 0 | 243247 | 0 |
| D | 0 | 304758 | 0 |
| Mode M9 | |||
|---|---|---|---|
| Quadrant | BADHDUFLAG | Total packets | Discarded packets |
| A | 0 | 186 | 0 |
| B | 0 | 186 | 0 |
| C | 0 | 186 | 0 |
| D | 0 | 186 | 0 |
| Quadrant | Total seconds | Saturated seconds | Saturation percentage |
|---|---|---|---|
| A | 103226 | 1315 | 1.273904% |
| B | 103226 | 8539 | 8.272141% |
| C | 103226 | 5746 | 5.566427% |
| D | 103226 | 3557 | 3.445837% |
Noise dominated data is calculated using 1-second bins in cleaned event files. If a bin has >2000 counts, and if more than 50% of those come from <1% of pixels, then it is considered to be noise-dominated and hence unusable.
| Quadrant | # 1 sec bins | Bins with >0 counts | Bins with >2000 counts | High rate bins dominated by noise | Noise dominated (total time) | Noise dominated (detector-on time) | Marked lightcurve |
|---|---|---|---|---|---|---|---|
| A | 125862 | 103228 | 0 | 0 | 0.00% | 0.00% |  |
| B | 125862 | 103167 | 0 | 0 | 0.00% | 0.00% |  |
| C | 125862 | 103028 | 0 | 0 | 0.00% | 0.00% |  |
| D | 125862 | 103204 | 0 | 0 | 0.00% | 0.00% |  |
Top three noisy pixels from each quadrant. If the there are fewer than three noisy pixels in the level2.evt file, extra rows are filled as -1
| Pixel properties | Quadrant properties | ||||||
|---|---|---|---|---|---|---|---|
| Quadrant | DetID | PixID | Counts | Sigma | Mean | Median | Sigma |
| A | 0 | 29 | 6263 | 11.4 | 1681 | 1583 | 410.6 |
| A | 7 | 110 | 5159 | 8.71 | 1681 | 1583 | 410.6 |
| A | 0 | 30 | 4815 | 7.87 | 1681 | 1583 | 410.6 |
| B | 2 | 9 | 4628 | 10.29 | 1556 | 1490 | 305.0 |
| B | 3 | 80 | 3925 | 7.98 | 1556 | 1490 | 305.0 |
| B | 3 | 17 | 3903 | 7.91 | 1556 | 1490 | 305.0 |
| C | 1 | 81 | 5140 | 8.87 | 1623 | 1525 | 407.5 |
| C | 1 | 80 | 4885 | 8.25 | 1623 | 1525 | 407.5 |
| C | 12 | 241 | 4257 | 6.7 | 1623 | 1525 | 407.5 |
| D | 4 | 246 | 4147 | 6.78 | 1538 | 1402 | 404.8 |
| D | 3 | 14 | 3937 | 6.26 | 1538 | 1402 | 404.8 |
| D | 10 | 189 | 3908 | 6.19 | 1538 | 1402 | 404.8 |
Histogram calculated using DETX and DETY for each event in the final _common_clean file
| Quadrant A | 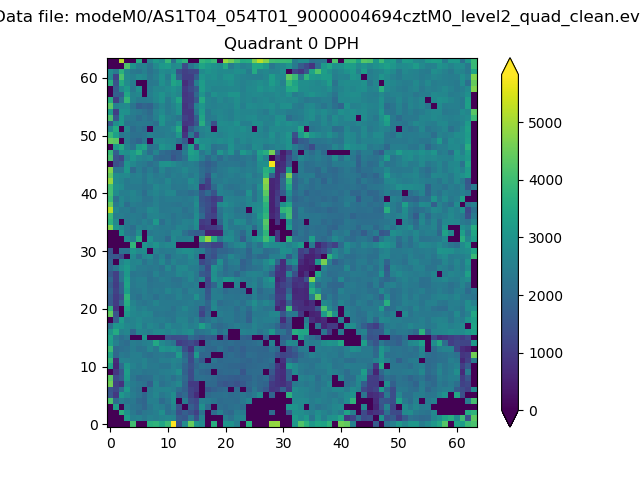 |
 |
Quadrant B |
|---|---|---|---|
| Quadrant D |  |
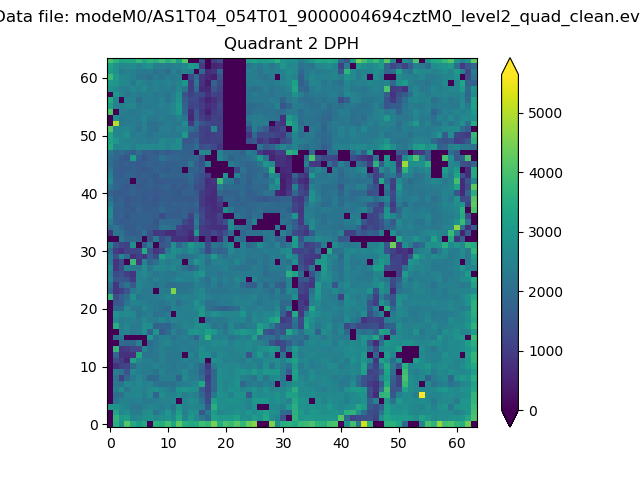 |
Quadrant C |
| Plot type | Count rate plots | Images |
|---|---|---|
| Comparison with Poisson distribution Blue bars denote a histogram of data divided into 1 sec bins. Red curve is a Poisson curve with rate = median count rate of data. |
 |
 |
| Quadrant-wise count rates Data is divided into 100 sec bins |
 |
|
| Module-wise count rates for Quadrant A Data is divided into 100 sec bins |
 |
 |
| Module-wise count rates for Quadrant B Data is divided into 100 sec bins |
 |
 |
| Module-wise count rates for Quadrant C Data is divided into 100 sec bins |
 |
 |
| Module-wise count rates for Quadrant D Data is divided into 100 sec bins |
 |
 |
| Parameter | Plot |
|---|---|
| CZT HV Monitor |  |
| D_VDD |  |
| Temperature 1 |  |
| Veto HV Monitor |  |
| Veto LLD |  |
| Alpha Counter |  |
| _CPM_Rate |  |
| CZT Counter |  |
| +2.5 Volts monitor |  |
| +5 Volts monitor |  |
| _ROLL_ROT |  |
| _Roll_DEC |  |
| _Roll_RA |  |
| Veto Counter |  |