| Param | Original file | Final file |
|---|---|---|
| Filename | modeM0/AS1T04_054T01_9000004694_32234cztM0_level2.evt | modeM0/AS1T04_054T01_9000004694_32234cztM0_level2_quad_clean.evt |
| Size (bytes) | 325,175,040 | 39,242,880 |
| Size | 310.1 MB | 37.4 MB |
| Events in quadrant A | 1,712,731 | 254,476 |
| Events in quadrant B | 3,226,649 | 230,921 |
| Events in quadrant C | 1,992,334 | 240,283 |
| Events in quadrant D | 2,695,399 | 231,697 |
| Mode SS | |||
|---|---|---|---|
| Quadrant | BADHDUFLAG | Total packets | Discarded packets |
| A | 0 | 66 | 0 |
| B | 0 | 66 | 0 |
| C | 0 | 66 | 0 |
| D | 0 | 66 | 0 |
| Mode M0 | |||
|---|---|---|---|
| Quadrant | BADHDUFLAG | Total packets | Discarded packets |
| A | 0 | 7105 | 1 |
| B | 0 | 11770 | 1 |
| C | 0 | 7998 | 1 |
| D | 0 | 10346 | 2 |
| Mode M9 | |||
|---|---|---|---|
| Quadrant | BADHDUFLAG | Total packets | Discarded packets |
| A | 0 | 12 | 0 |
| B | 0 | 12 | 0 |
| C | 0 | 12 | 0 |
| D | 0 | 12 | 0 |
| Quadrant | Total seconds | Saturated seconds | Saturation percentage |
|---|---|---|---|
| A | 3244 | 36 | 1.109741% |
| B | 3244 | 388 | 11.960543% |
| C | 3244 | 184 | 5.672010% |
| D | 3243 | 95 | 2.929386% |
Noise dominated data is calculated using 1-second bins in cleaned event files. If a bin has >2000 counts, and if more than 50% of those come from <1% of pixels, then it is considered to be noise-dominated and hence unusable.
| Quadrant | # 1 sec bins | Bins with >0 counts | Bins with >2000 counts | High rate bins dominated by noise | Noise dominated (total time) | Noise dominated (detector-on time) | Marked lightcurve |
|---|---|---|---|---|---|---|---|
| A | 4449 | 3245 | 0 | 0 | 0.00% | 0.00% | 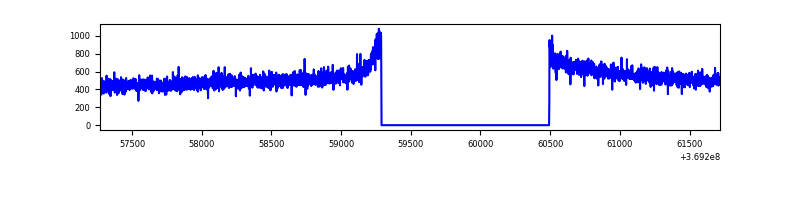 |
| B | 4449 | 3245 | 209 | 209 | 4.70% | 6.44% |  |
| C | 4449 | 3245 | 12 | 12 | 0.27% | 0.37% | 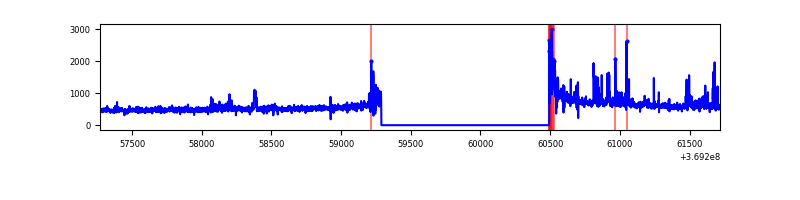 |
| D | 4448 | 3244 | 46 | 46 | 1.03% | 1.42% | 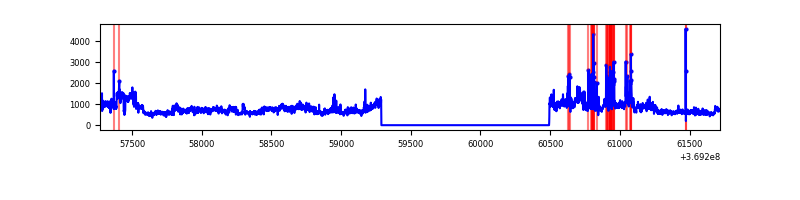 |
Top three noisy pixels from each quadrant. If the there are fewer than three noisy pixels in the level2.evt file, extra rows are filled as -1
| Pixel properties | Quadrant properties | ||||||
|---|---|---|---|---|---|---|---|
| Quadrant | DetID | PixID | Counts | Sigma | Mean | Median | Sigma |
| A | 13 | 6 | 8356 | 87.88 | 441 | 433 | 90.2 |
| A | 13 | 254 | 6519 | 67.51 | 441 | 433 | 90.2 |
| A | 3 | 137 | 4270 | 42.56 | 441 | 433 | 90.2 |
| B | 6 | 159 | 895567 | 11248.76 | 418 | 407 | 79.6 |
| B | 4 | 80 | 560951 | 7043.91 | 418 | 407 | 79.6 |
| B | 5 | 172 | 75349 | 941.74 | 418 | 407 | 79.6 |
| C | 0 | 10 | 136273 | 1384.11 | 420 | 423 | 98.1 |
| C | 14 | 238 | 82134 | 832.51 | 420 | 423 | 98.1 |
| C | 3 | 233 | 75357 | 763.47 | 420 | 423 | 98.1 |
| D | 8 | 195 | 875715 | 8506.48 | 427 | 416 | 102.9 |
| D | 12 | 218 | 147863 | 1432.94 | 427 | 416 | 102.9 |
| D | 14 | 52 | 23592 | 225.23 | 427 | 416 | 102.9 |
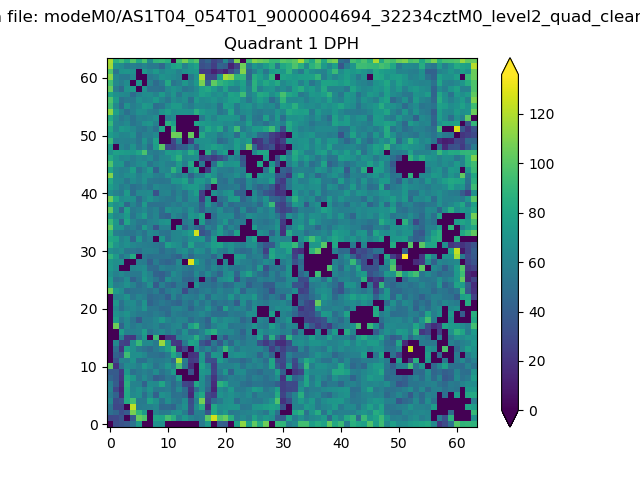
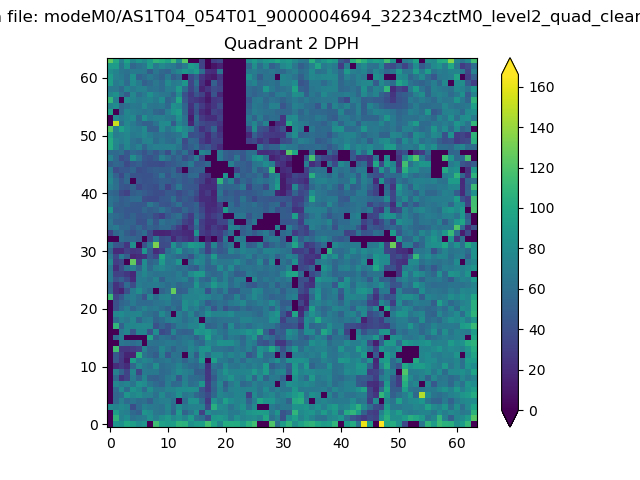
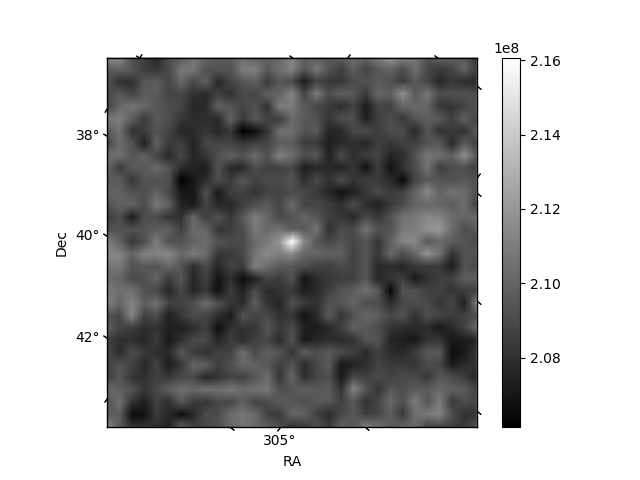
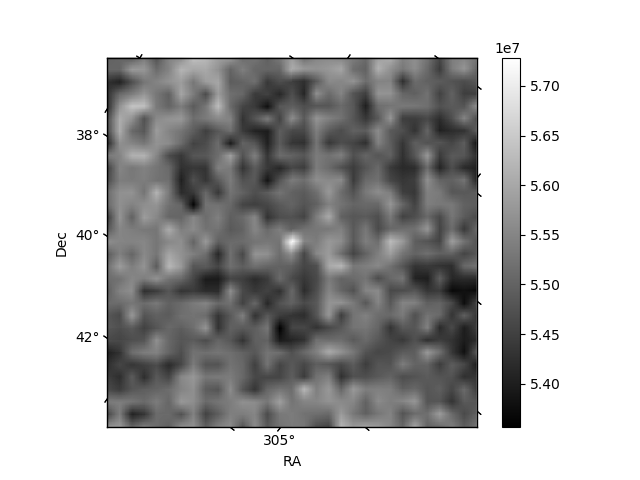
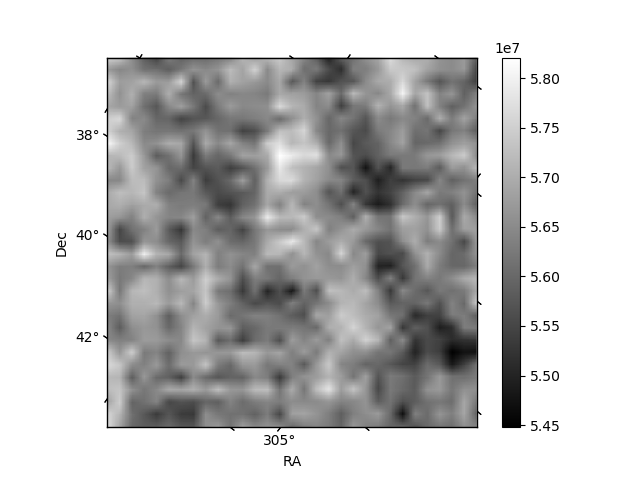
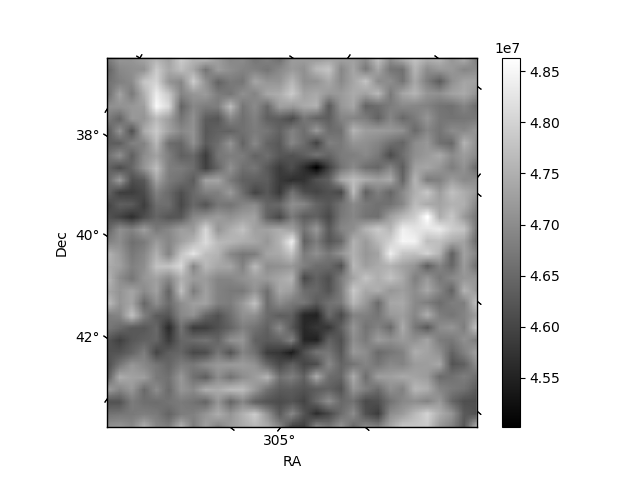
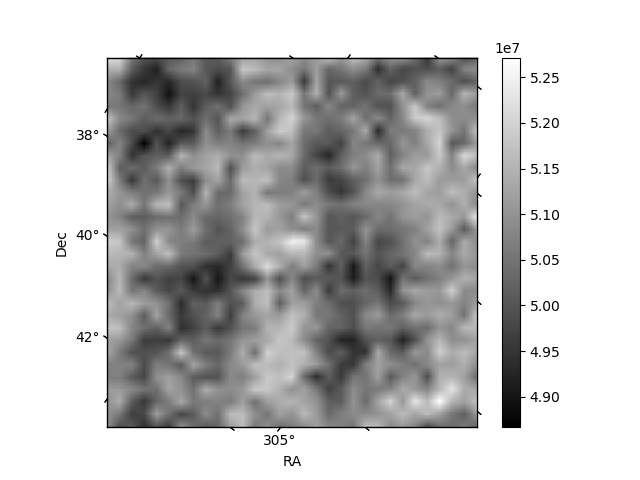
Histogram calculated using DETX and DETY for each event in the final _common_clean file
| Quadrant A | 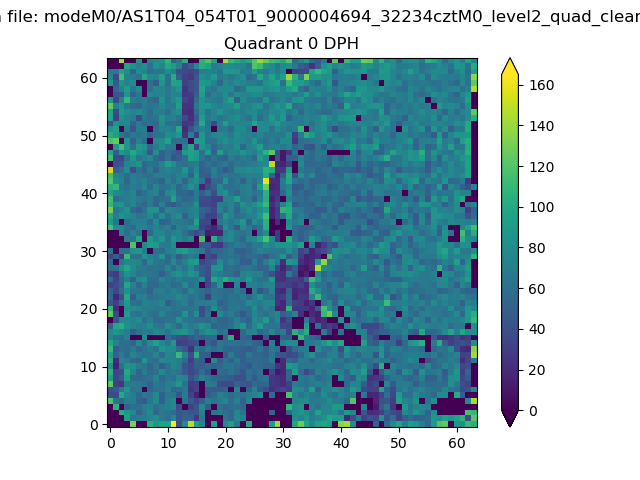 |
 |
Quadrant B |
|---|---|---|---|
| Quadrant D | 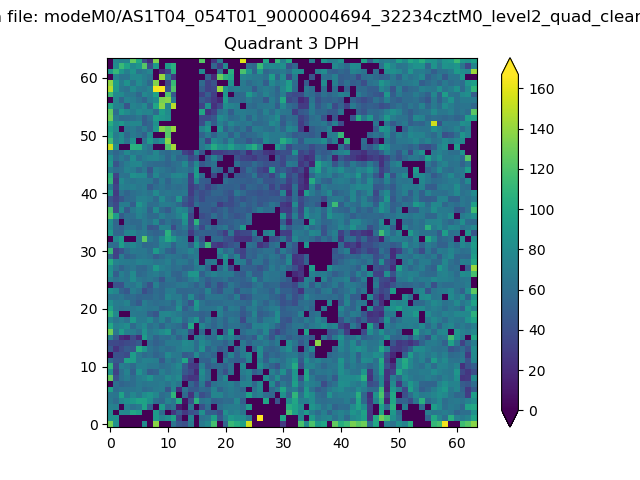 |
 |
Quadrant C |
| Plot type | Count rate plots | Images |
|---|---|---|
| Comparison with Poisson distribution Blue bars denote a histogram of data divided into 1 sec bins. Red curve is a Poisson curve with rate = median count rate of data. |
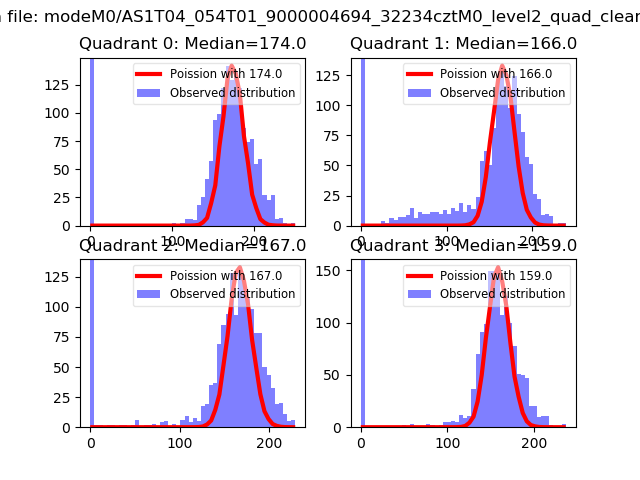 |
 |
| Quadrant-wise count rates Data is divided into 100 sec bins |
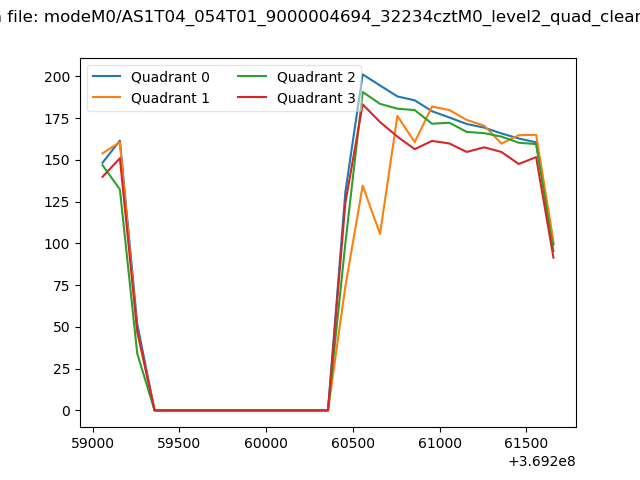 |
|
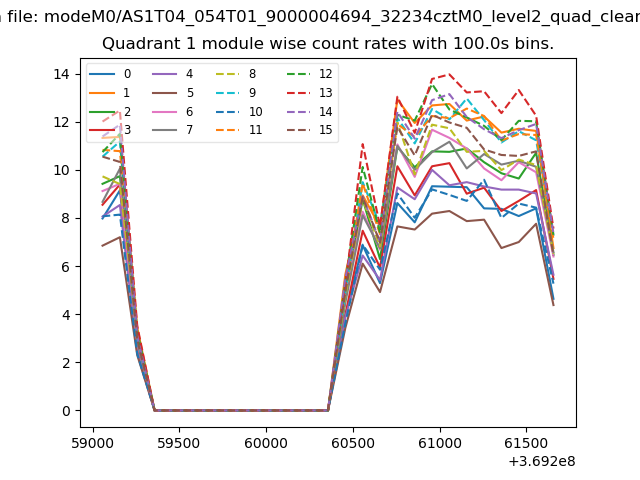
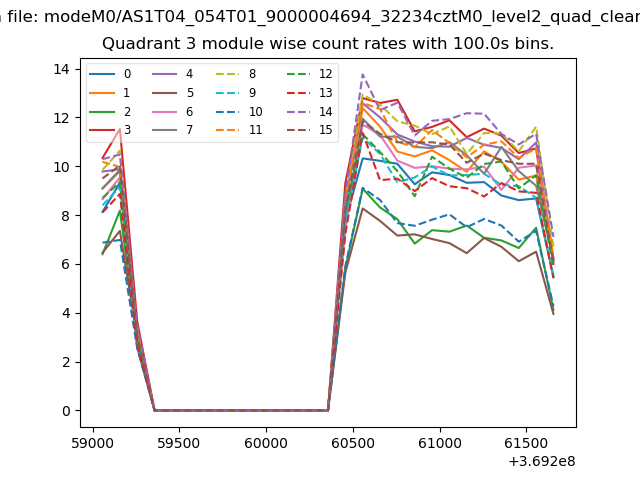
| Module-wise count rates for Quadrant A Data is divided into 100 sec bins |
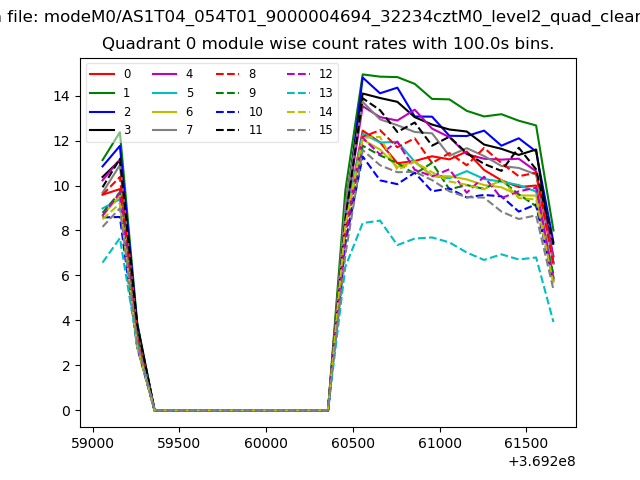 |
 |
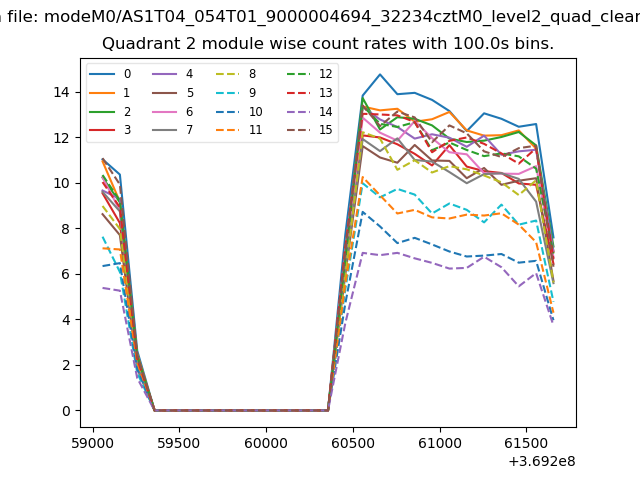
| Module-wise count rates for Quadrant B Data is divided into 100 sec bins |
 |
 |
| Module-wise count rates for Quadrant C Data is divided into 100 sec bins |
 |
 |
| Module-wise count rates for Quadrant D Data is divided into 100 sec bins |
 |
 |
| Parameter | Plot |
|---|---|
| CZT HV Monitor |  |
| D_VDD | 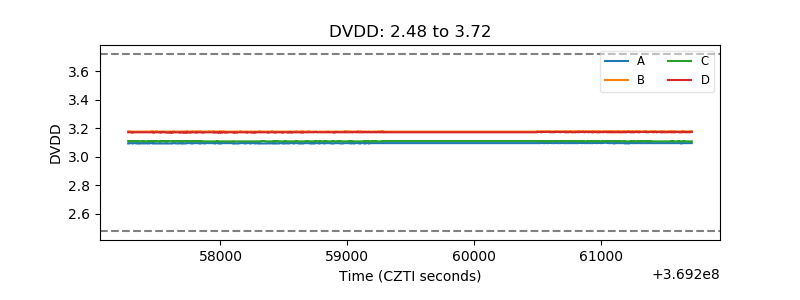 |
| Temperature 1 | 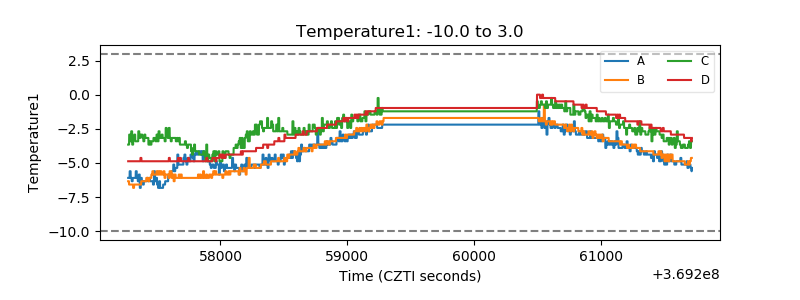 |
| Veto HV Monitor | 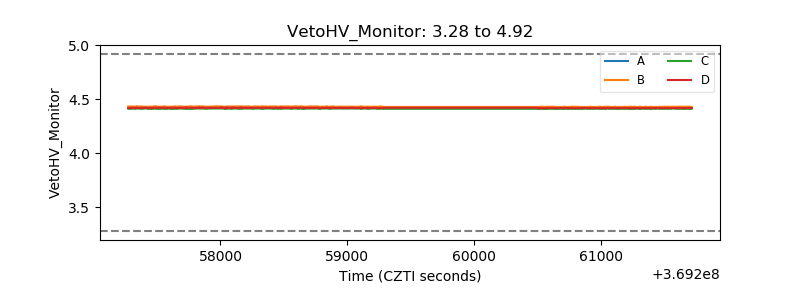 |
| Veto LLD | 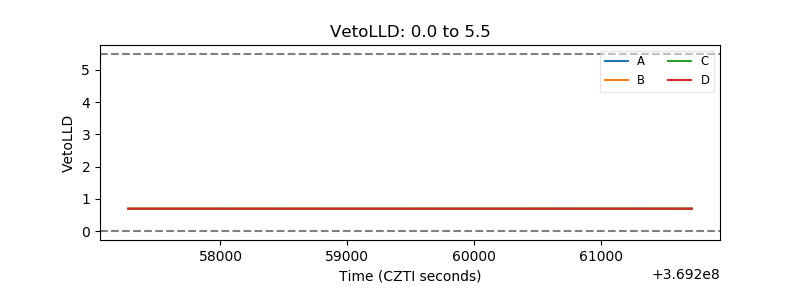 |
| Alpha Counter | 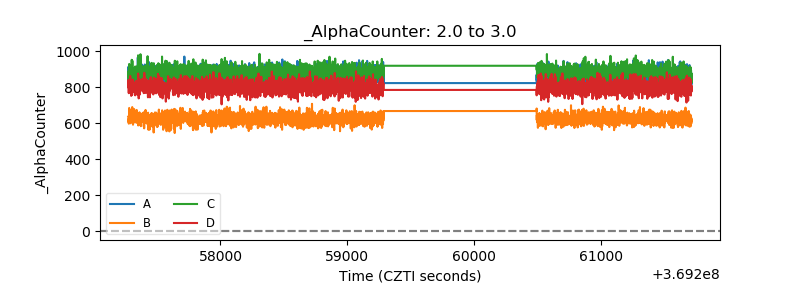 |
| _CPM_Rate | 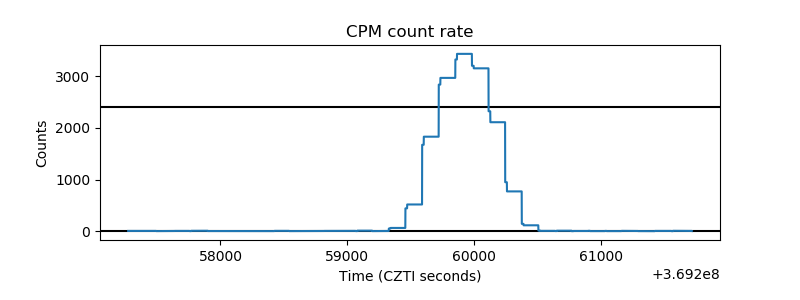 |
| CZT Counter | 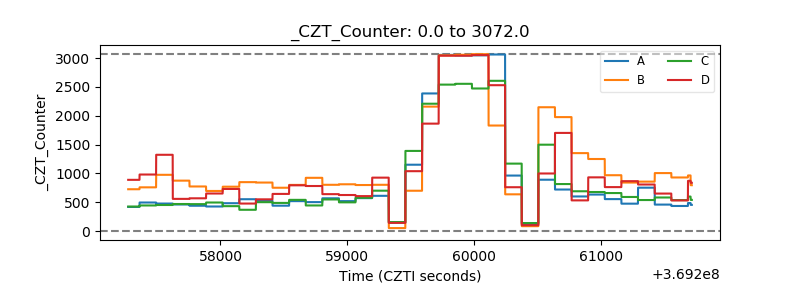 |
| +2.5 Volts monitor |  |
| +5 Volts monitor |  |
| _ROLL_ROT | 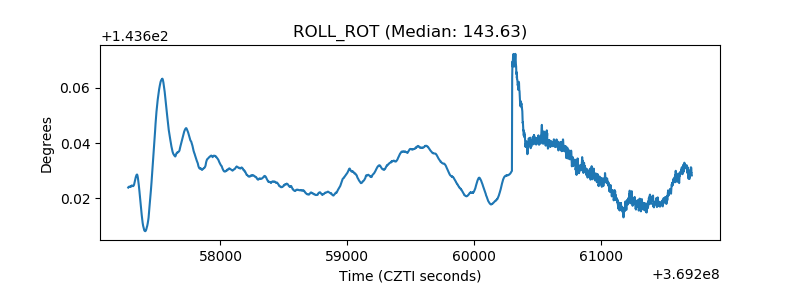 |
| _Roll_DEC | 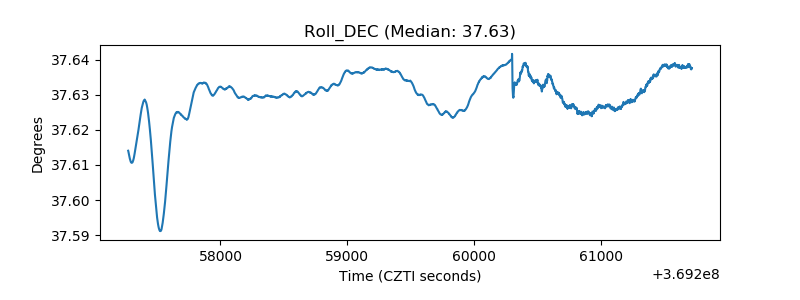 |
| _Roll_RA | 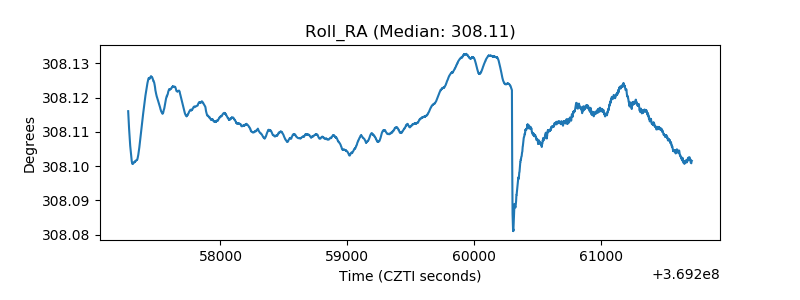 |
| Veto Counter | 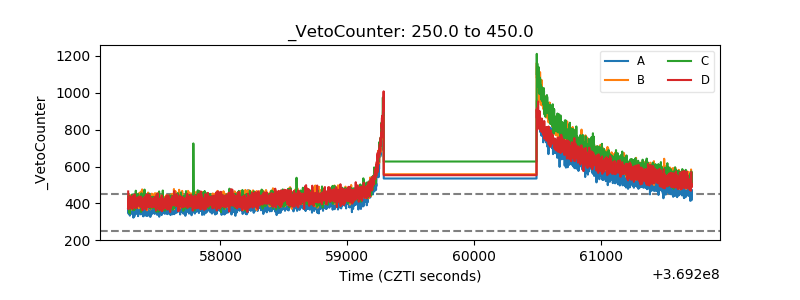 |