| Param | Original file | Final file |
|---|---|---|
| Filename | modeM0/AS1T04_054T01_9000004694_32235cztM0_level2.evt | modeM0/AS1T04_054T01_9000004694_32235cztM0_level2_quad_clean.evt |
| Size (bytes) | 598,222,080 | 101,018,880 |
| Size | 570.5 MB | 96.3 MB |
| Events in quadrant A | 3,169,142 | 686,137 |
| Events in quadrant B | 5,771,206 | 669,913 |
| Events in quadrant C | 4,055,878 | 649,100 |
| Events in quadrant D | 4,705,892 | 625,189 |
| Mode SS | |||
|---|---|---|---|
| Quadrant | BADHDUFLAG | Total packets | Discarded packets |
| A | 0 | 124 | 0 |
| B | 0 | 124 | 0 |
| C | 0 | 124 | 0 |
| D | 0 | 124 | 0 |
| Mode M0 | |||
|---|---|---|---|
| Quadrant | BADHDUFLAG | Total packets | Discarded packets |
| A | 0 | 13247 | 2 |
| B | 0 | 21263 | 2 |
| C | 0 | 16054 | 2 |
| D | 0 | 18202 | 3 |
| Mode M9 | |||
|---|---|---|---|
| Quadrant | BADHDUFLAG | Total packets | Discarded packets |
| A | 0 | 17 | 0 |
| B | 0 | 18 | 0 |
| C | 0 | 18 | 0 |
| D | 0 | 18 | 0 |
| Quadrant | Total seconds | Saturated seconds | Saturation percentage |
|---|---|---|---|
| A | 6145 | 16 | 0.260374% |
| B | 6145 | 394 | 6.411717% |
| C | 6145 | 369 | 6.004882% |
| D | 6144 | 116 | 1.888021% |
Noise dominated data is calculated using 1-second bins in cleaned event files. If a bin has >2000 counts, and if more than 50% of those come from <1% of pixels, then it is considered to be noise-dominated and hence unusable.
| Quadrant | # 1 sec bins | Bins with >0 counts | Bins with >2000 counts | High rate bins dominated by noise | Noise dominated (total time) | Noise dominated (detector-on time) | Marked lightcurve |
|---|---|---|---|---|---|---|---|
| A | 7475 | 6146 | 0 | 0 | 0.00% | 0.00% | 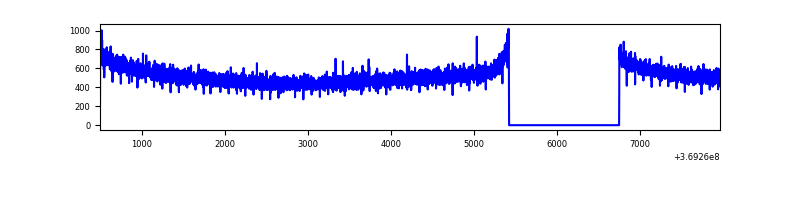 |
| B | 7475 | 6146 | 214 | 214 | 2.86% | 3.48% |  |
| C | 7475 | 6146 | 99 | 99 | 1.32% | 1.61% | 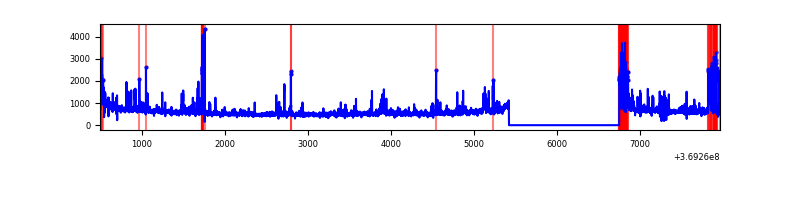 |
| D | 7474 | 6145 | 69 | 69 | 0.92% | 1.12% | 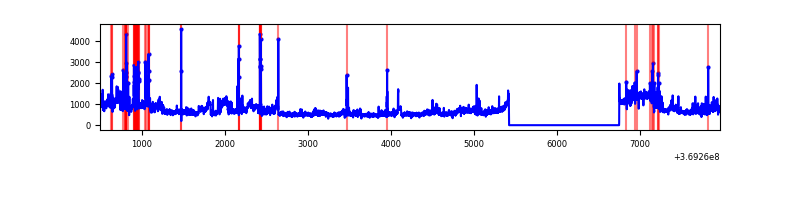 |
Top three noisy pixels from each quadrant. If the there are fewer than three noisy pixels in the level2.evt file, extra rows are filled as -1
| Pixel properties | Quadrant properties | ||||||
|---|---|---|---|---|---|---|---|
| Quadrant | DetID | PixID | Counts | Sigma | Mean | Median | Sigma |
| A | 13 | 6 | 16228 | 95.1 | 816 | 804 | 162.2 |
| A | 13 | 254 | 12962 | 74.96 | 816 | 804 | 162.2 |
| A | 3 | 137 | 7427 | 40.84 | 816 | 804 | 162.2 |
| B | 6 | 159 | 1773181 | 11900.61 | 799 | 779 | 148.9 |
| B | 4 | 80 | 671348 | 4502.47 | 799 | 779 | 148.9 |
| B | 5 | 172 | 85837 | 571.11 | 799 | 779 | 148.9 |
| C | 0 | 10 | 640603 | 3530.26 | 781 | 789 | 181.2 |
| C | 14 | 238 | 158009 | 867.48 | 781 | 789 | 181.2 |
| C | 3 | 233 | 97061 | 531.19 | 781 | 789 | 181.2 |
| D | 8 | 195 | 1345528 | 7228.86 | 786 | 766 | 186.0 |
| D | 12 | 218 | 148688 | 795.16 | 786 | 766 | 186.0 |
| D | 14 | 52 | 60985 | 323.71 | 786 | 766 | 186.0 |
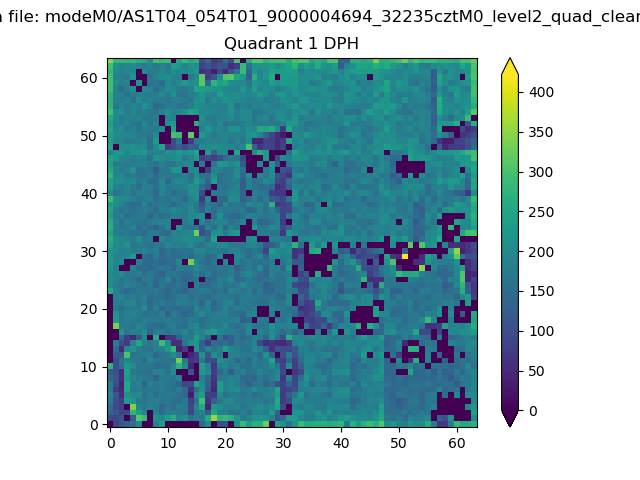
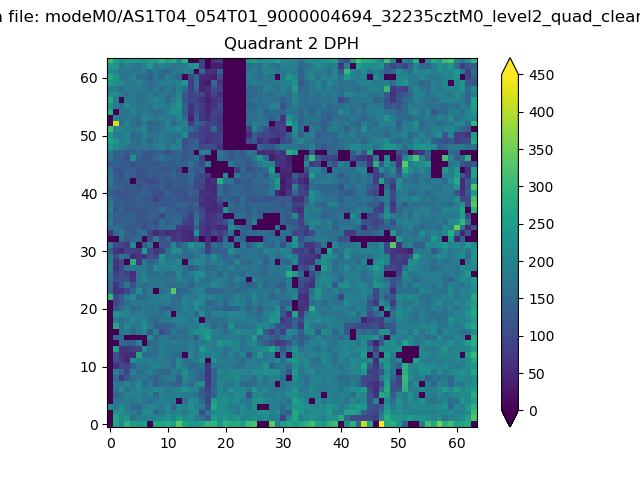
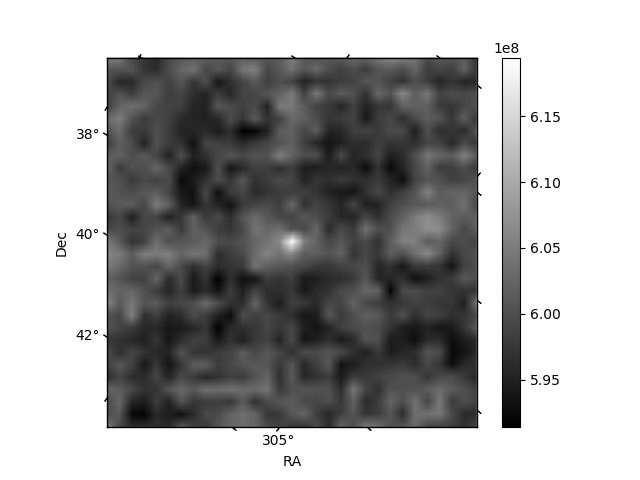
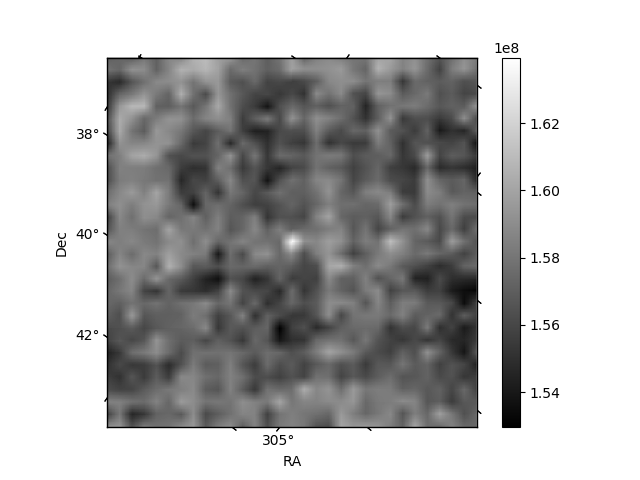
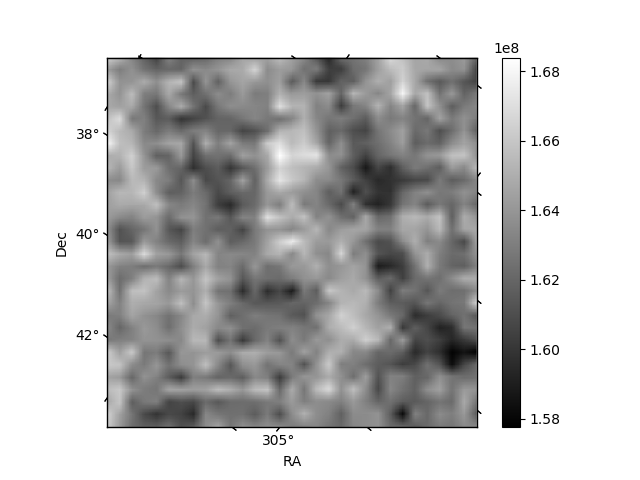
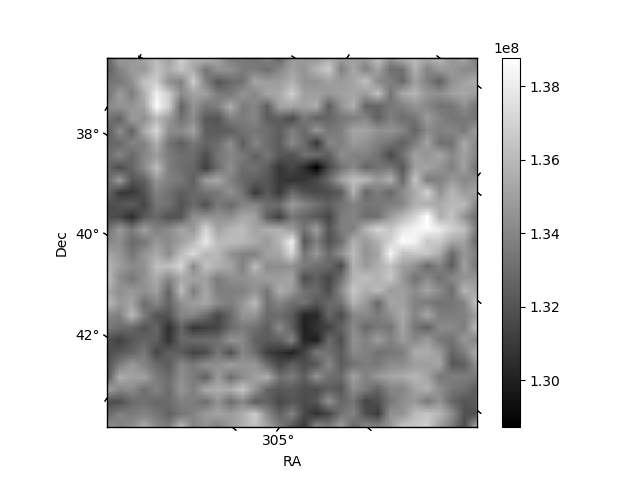
Histogram calculated using DETX and DETY for each event in the final _common_clean file
| Quadrant A | 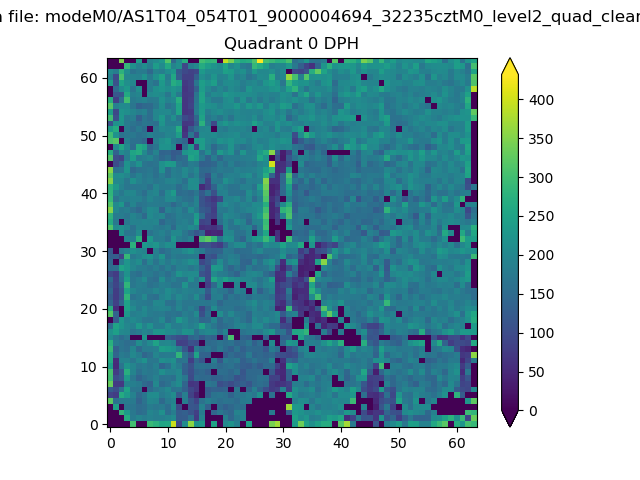 |
 |
Quadrant B |
|---|---|---|---|
| Quadrant D | 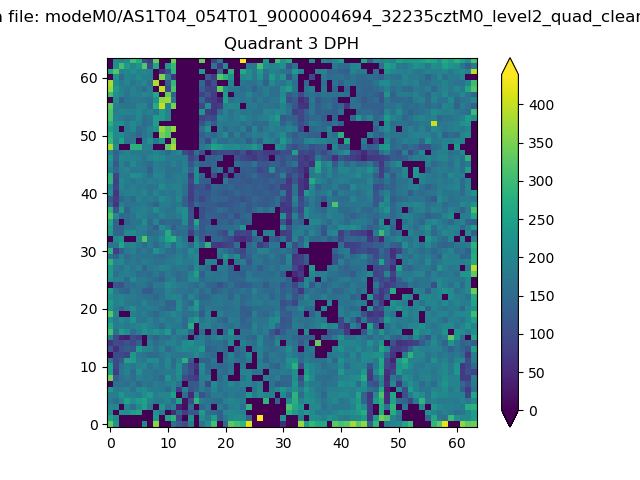 |
 |
Quadrant C |
| Plot type | Count rate plots | Images |
|---|---|---|
| Comparison with Poisson distribution Blue bars denote a histogram of data divided into 1 sec bins. Red curve is a Poisson curve with rate = median count rate of data. |
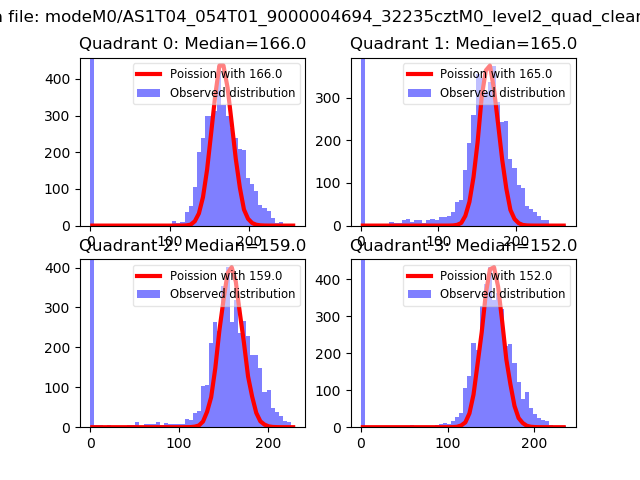 |
 |
| Quadrant-wise count rates Data is divided into 100 sec bins |
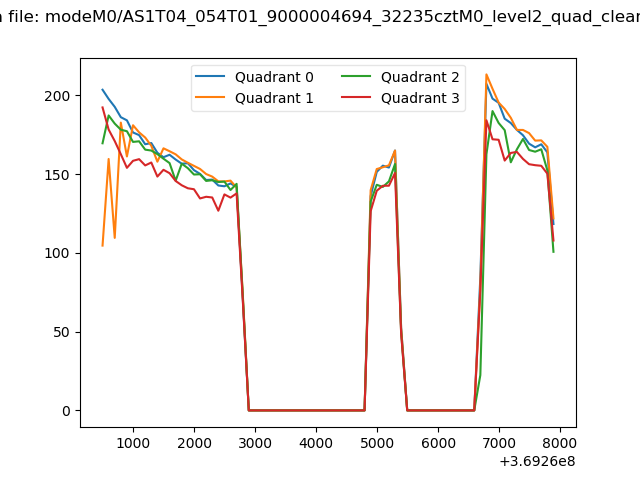 |
|
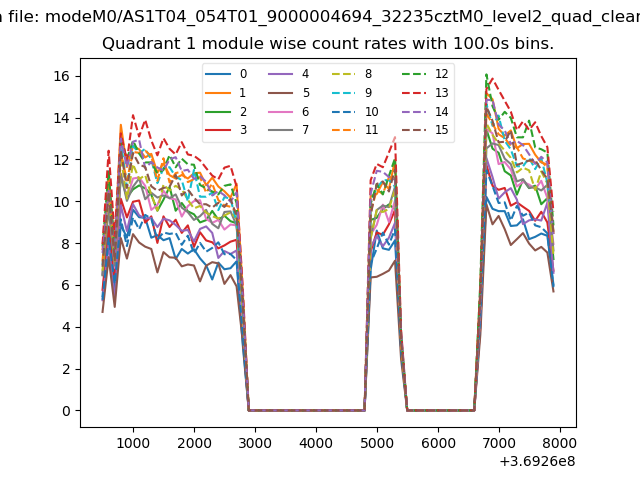
| Module-wise count rates for Quadrant A Data is divided into 100 sec bins |
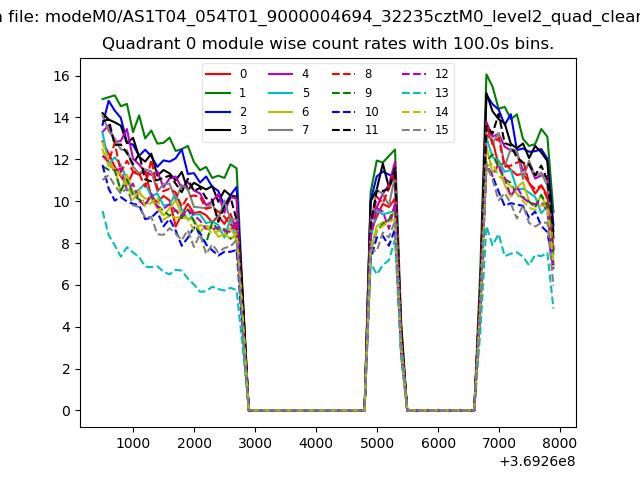 |
 |
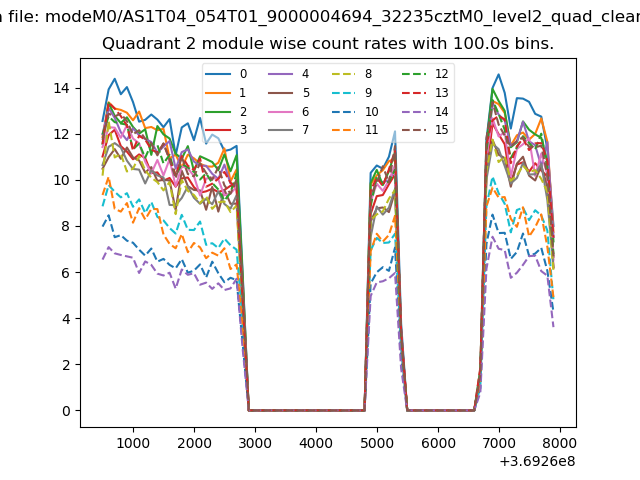
| Module-wise count rates for Quadrant B Data is divided into 100 sec bins |
 |
 |
| Module-wise count rates for Quadrant C Data is divided into 100 sec bins |
 |
 |
| Module-wise count rates for Quadrant D Data is divided into 100 sec bins |
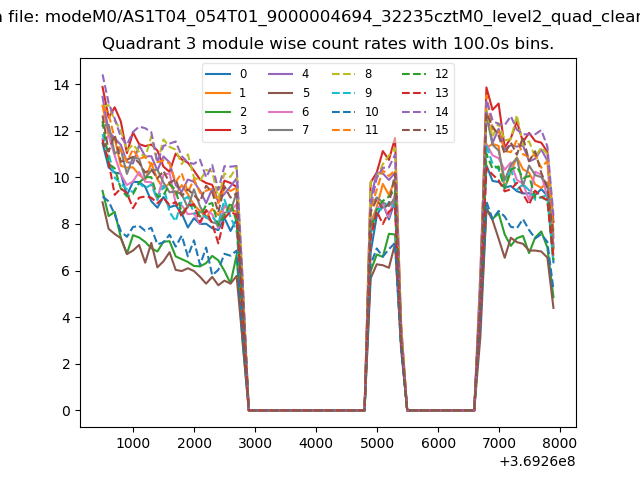 |
 |
| Parameter | Plot |
|---|---|
| CZT HV Monitor | 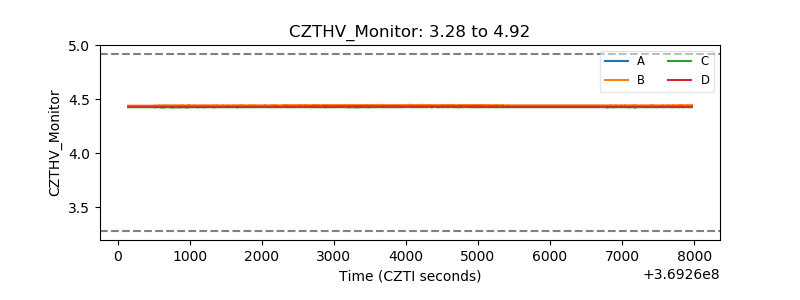 |
| D_VDD | 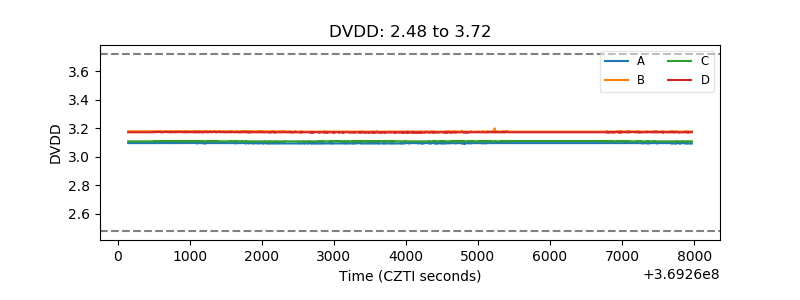 |
| Temperature 1 | 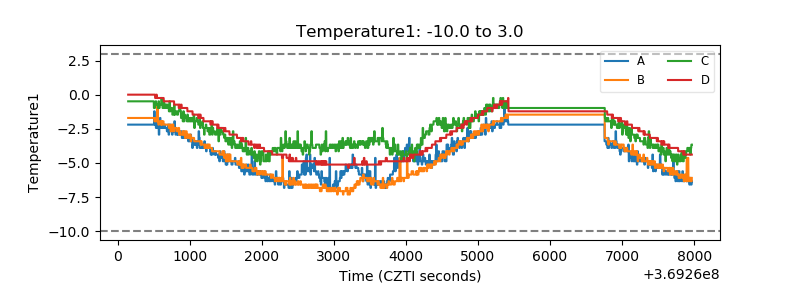 |
| Veto HV Monitor |  |
| Veto LLD | 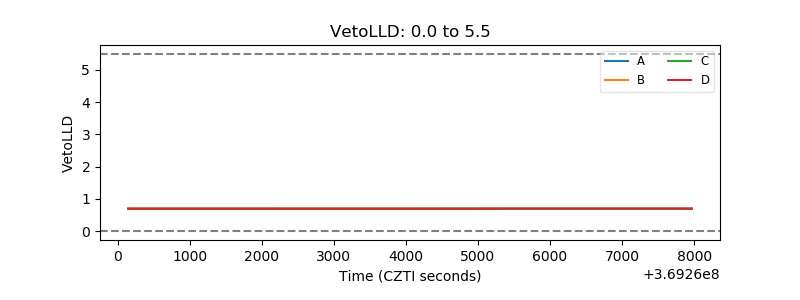 |
| Alpha Counter | 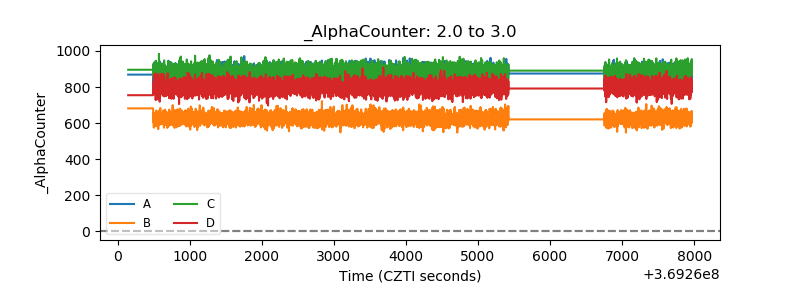 |
| _CPM_Rate | 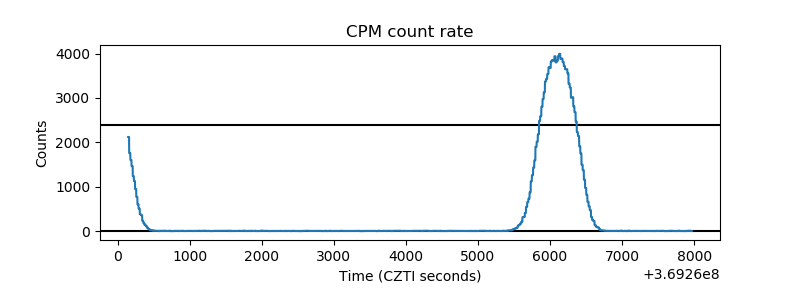 |
| CZT Counter | 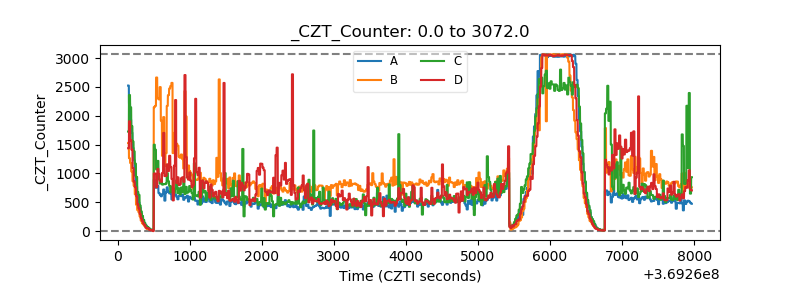 |
| +2.5 Volts monitor |  |
| +5 Volts monitor |  |
| _ROLL_ROT | 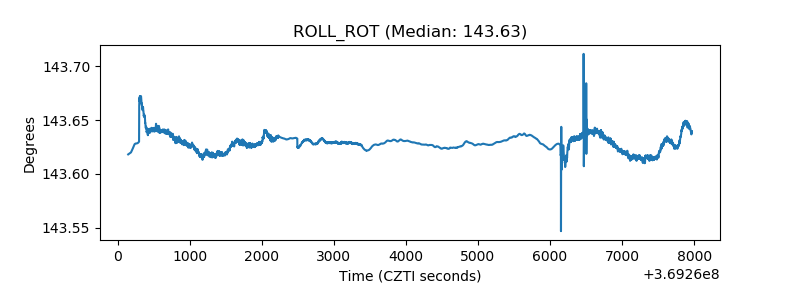 |
| _Roll_DEC | 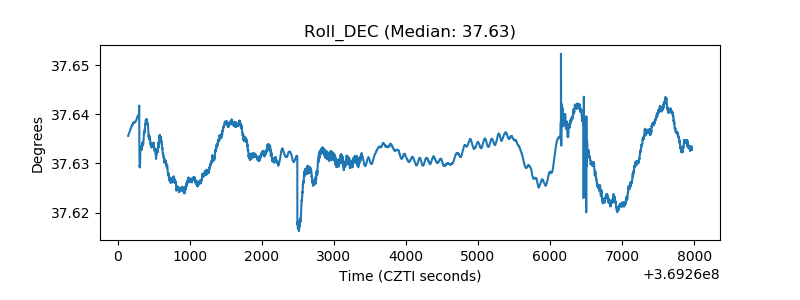 |
| _Roll_RA | 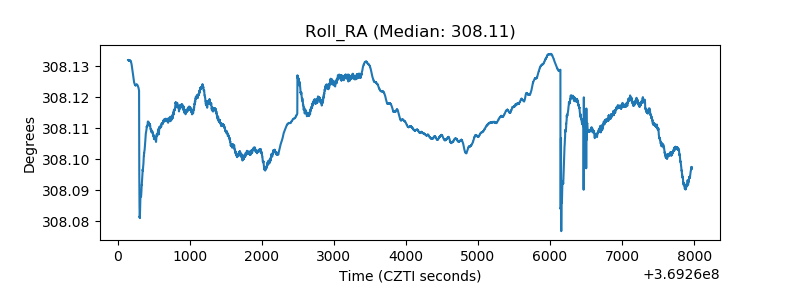 |
| Veto Counter | 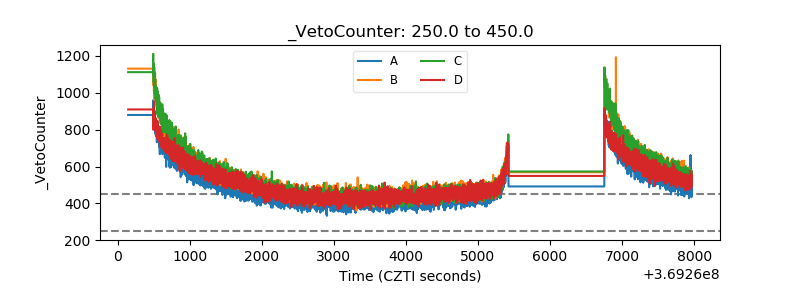 |