| Param | Original file | Final file |
|---|---|---|
| Filename | modeM0/AS1T04_054T01_9000004694_32236cztM0_level2.evt | modeM0/AS1T04_054T01_9000004694_32236cztM0_level2_quad_clean.evt |
| Size (bytes) | 601,548,480 | 101,050,560 |
| Size | 573.7 MB | 96.4 MB |
| Events in quadrant A | 3,211,372 | 686,090 |
| Events in quadrant B | 5,640,902 | 687,976 |
| Events in quadrant C | 4,053,893 | 639,528 |
| Events in quadrant D | 4,897,588 | 618,586 |
| Mode SS | |||
|---|---|---|---|
| Quadrant | BADHDUFLAG | Total packets | Discarded packets |
| A | 0 | 124 | 0 |
| B | 0 | 124 | 0 |
| C | 0 | 124 | 0 |
| D | 0 | 124 | 0 |
| Mode M0 | |||
|---|---|---|---|
| Quadrant | BADHDUFLAG | Total packets | Discarded packets |
| A | 0 | 13282 | 2 |
| B | 0 | 20937 | 4 |
| C | 0 | 15997 | 2 |
| D | 0 | 18756 | 2 |
| Mode M9 | |||
|---|---|---|---|
| Quadrant | BADHDUFLAG | Total packets | Discarded packets |
| A | 0 | 21 | 0 |
| B | 0 | 22 | 0 |
| C | 0 | 22 | 0 |
| D | 0 | 22 | 0 |
| Quadrant | Total seconds | Saturated seconds | Saturation percentage |
|---|---|---|---|
| A | 6133 | 38 | 0.619599% |
| B | 6132 | 279 | 4.549902% |
| C | 6132 | 413 | 6.735160% |
| D | 6132 | 138 | 2.250489% |
Noise dominated data is calculated using 1-second bins in cleaned event files. If a bin has >2000 counts, and if more than 50% of those come from <1% of pixels, then it is considered to be noise-dominated and hence unusable.
| Quadrant | # 1 sec bins | Bins with >0 counts | Bins with >2000 counts | High rate bins dominated by noise | Noise dominated (total time) | Noise dominated (detector-on time) | Marked lightcurve |
|---|---|---|---|---|---|---|---|
| A | 7469 | 6135 | 1 | 1 | 0.01% | 0.02% | 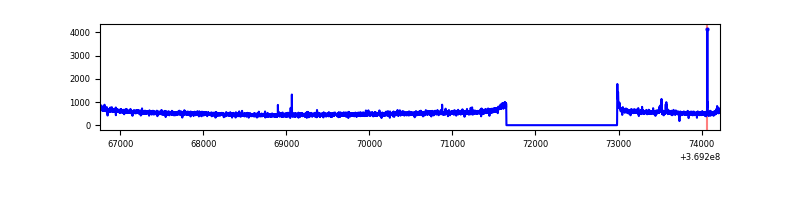 |
| B | 7468 | 6134 | 96 | 96 | 1.29% | 1.57% | 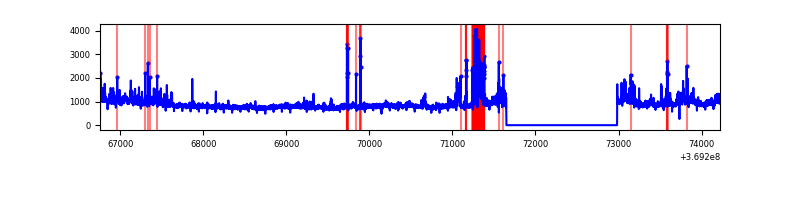 |
| C | 7468 | 6134 | 137 | 137 | 1.83% | 2.23% | 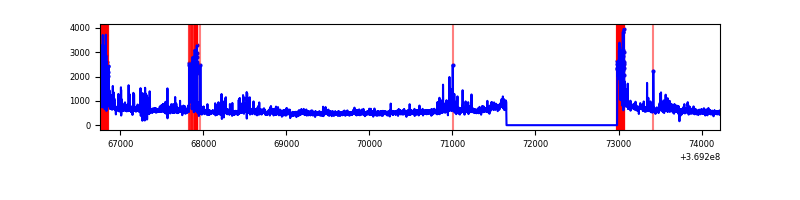 |
| D | 7468 | 6134 | 88 | 88 | 1.18% | 1.43% | 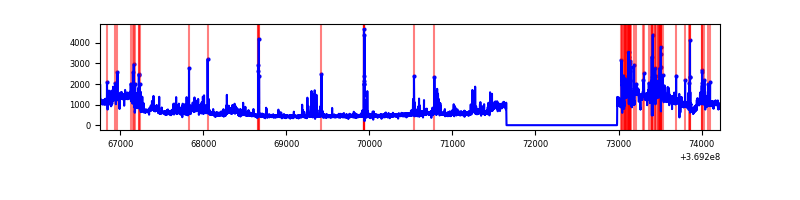 |
Top three noisy pixels from each quadrant. If the there are fewer than three noisy pixels in the level2.evt file, extra rows are filled as -1
| Pixel properties | Quadrant properties | ||||||
|---|---|---|---|---|---|---|---|
| Quadrant | DetID | PixID | Counts | Sigma | Mean | Median | Sigma |
| A | 15 | 174 | 20888 | 123.54 | 818 | 804 | 162.6 |
| A | 13 | 6 | 17456 | 102.43 | 818 | 804 | 162.6 |
| A | 13 | 254 | 11492 | 65.74 | 818 | 804 | 162.6 |
| B | 6 | 159 | 1704821 | 11278.19 | 814 | 794 | 151.1 |
| B | 4 | 80 | 631722 | 4175.83 | 814 | 794 | 151.1 |
| B | 0 | 229 | 41811 | 271.47 | 814 | 794 | 151.1 |
| C | 0 | 10 | 569016 | 3172.31 | 775 | 783 | 179.1 |
| C | 3 | 233 | 166670 | 926.11 | 775 | 783 | 179.1 |
| C | 14 | 238 | 166152 | 923.21 | 775 | 783 | 179.1 |
| D | 8 | 195 | 1491462 | 7933.99 | 783 | 764 | 187.9 |
| D | 12 | 233 | 214828 | 1139.32 | 783 | 764 | 187.9 |
| D | 2 | 250 | 104019 | 549.56 | 783 | 764 | 187.9 |
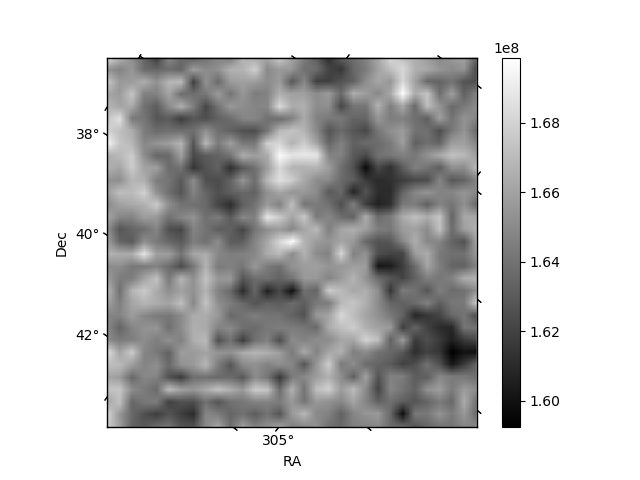
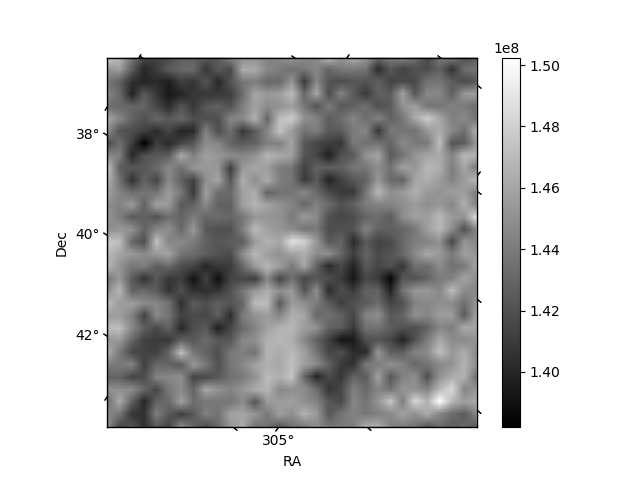
Histogram calculated using DETX and DETY for each event in the final _common_clean file
| Quadrant A | 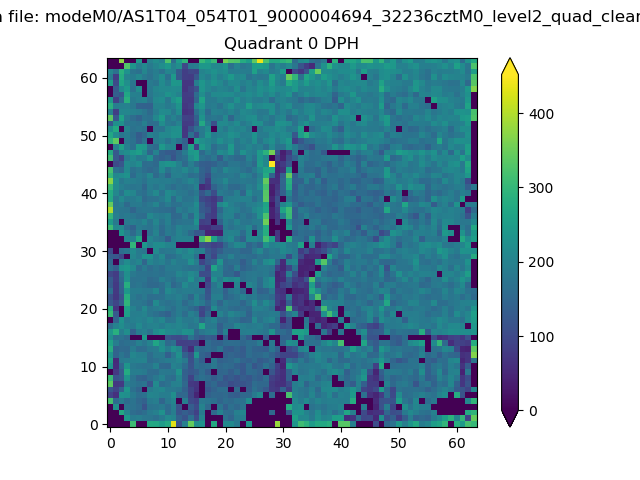 |
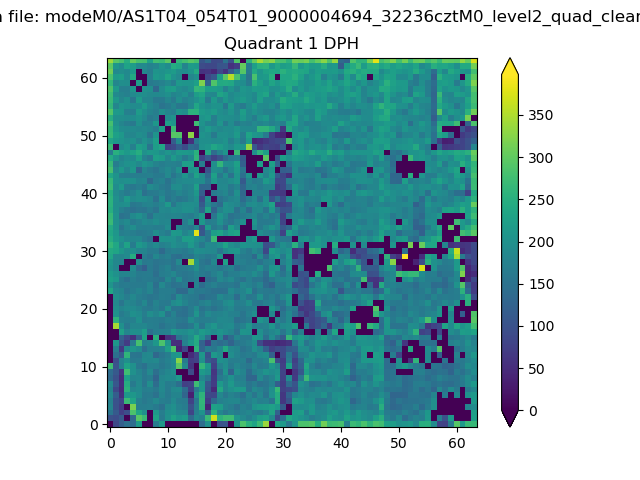 |
Quadrant B |
|---|---|---|---|
| Quadrant D | 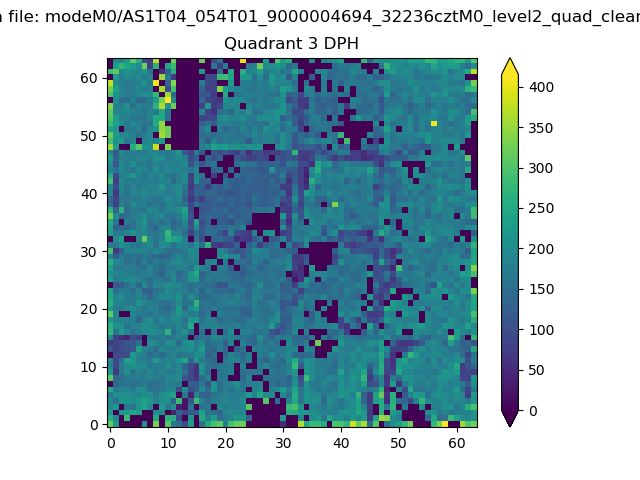 |
 |
Quadrant C |
| Plot type | Count rate plots | Images |
|---|---|---|
| Comparison with Poisson distribution Blue bars denote a histogram of data divided into 1 sec bins. Red curve is a Poisson curve with rate = median count rate of data. |
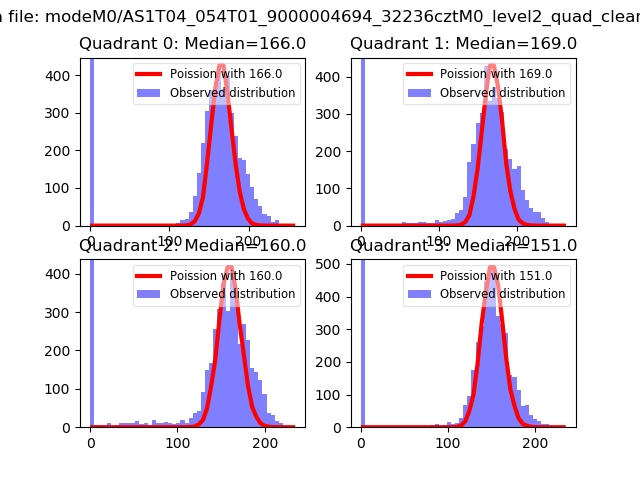 |
 |
| Quadrant-wise count rates Data is divided into 100 sec bins |
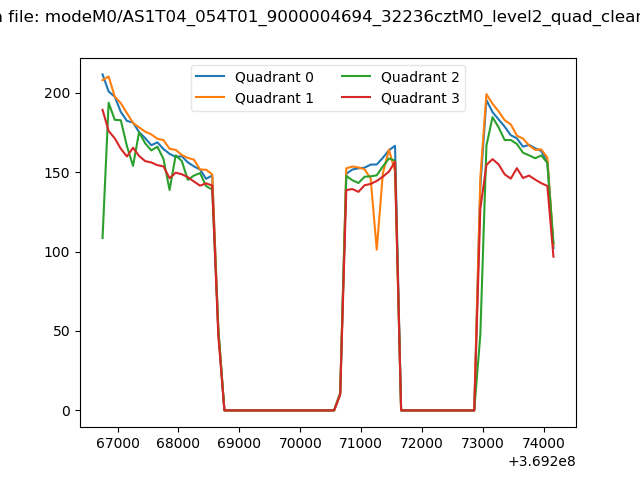 |
|
| Module-wise count rates for Quadrant A Data is divided into 100 sec bins |
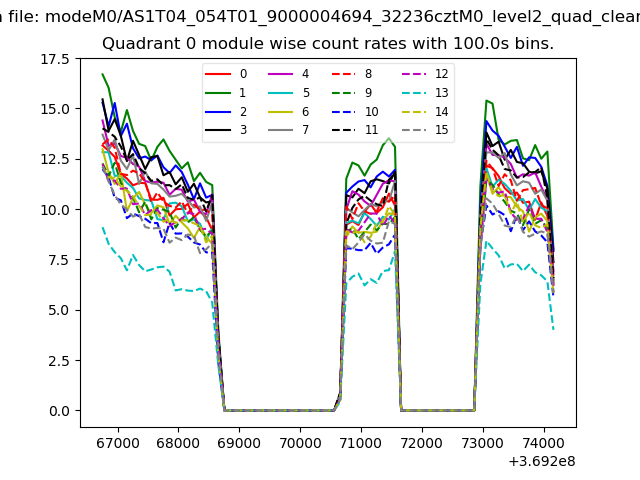 |
 |
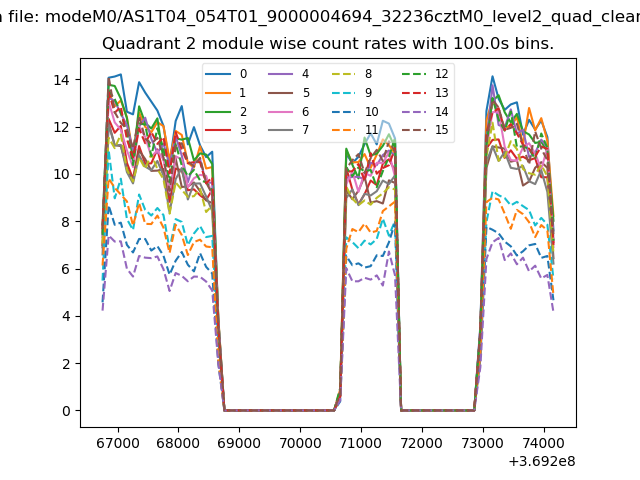
| Module-wise count rates for Quadrant B Data is divided into 100 sec bins |
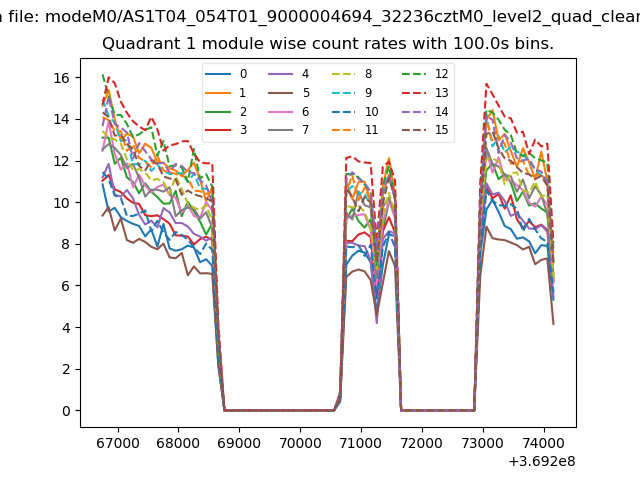 |
 |
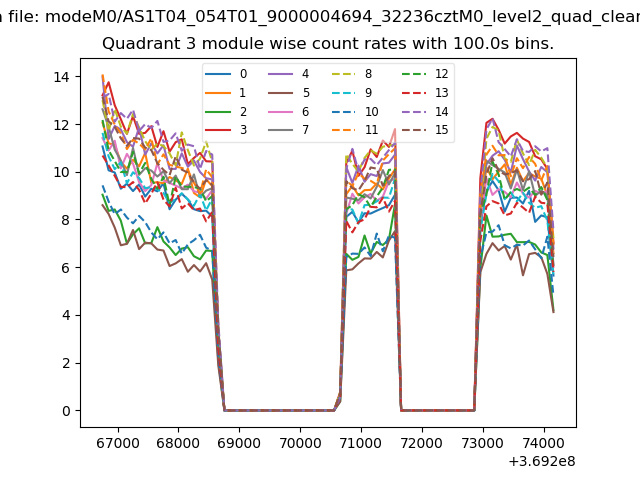
| Module-wise count rates for Quadrant C Data is divided into 100 sec bins |
 |
 |
| Module-wise count rates for Quadrant D Data is divided into 100 sec bins |
 |
 |
| Parameter | Plot |
|---|---|
| CZT HV Monitor | 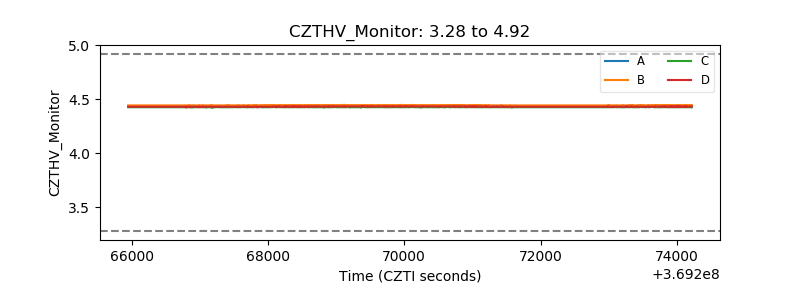 |
| D_VDD | 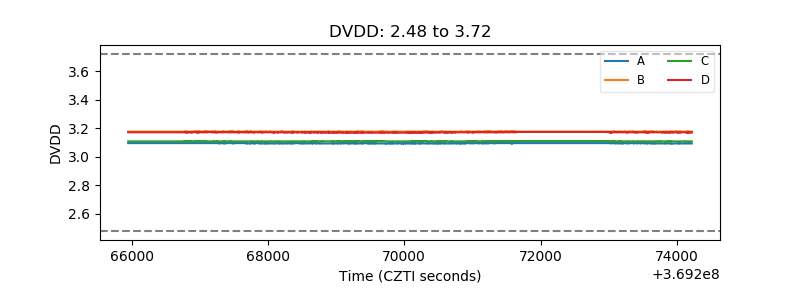 |
| Temperature 1 | 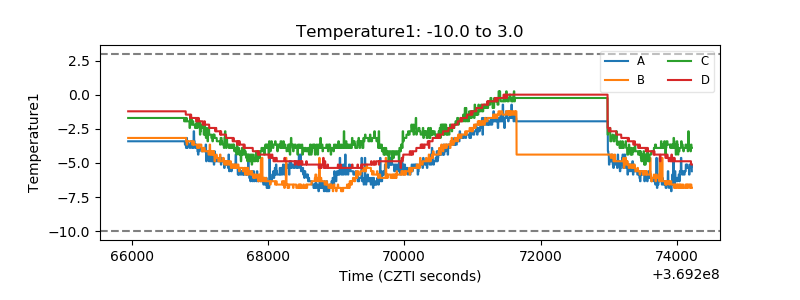 |
| Veto HV Monitor |  |
| Veto LLD | 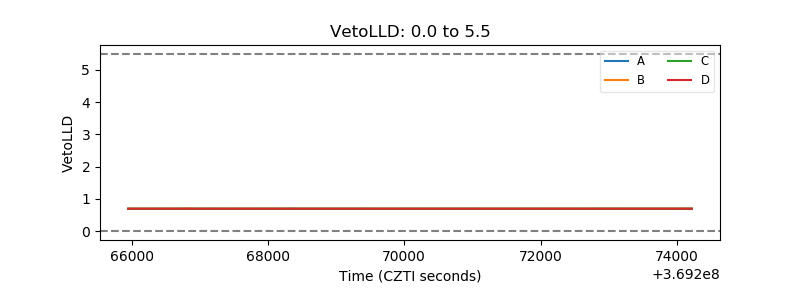 |
| Alpha Counter | 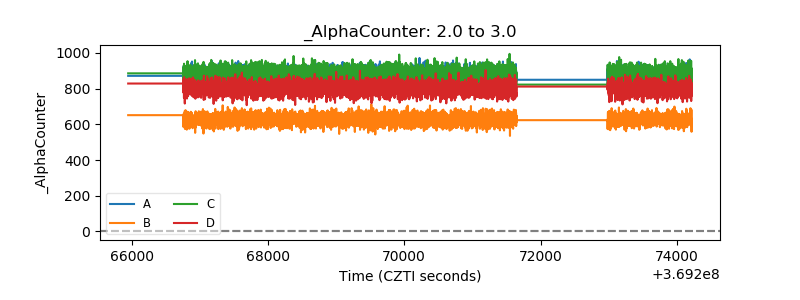 |
| _CPM_Rate | 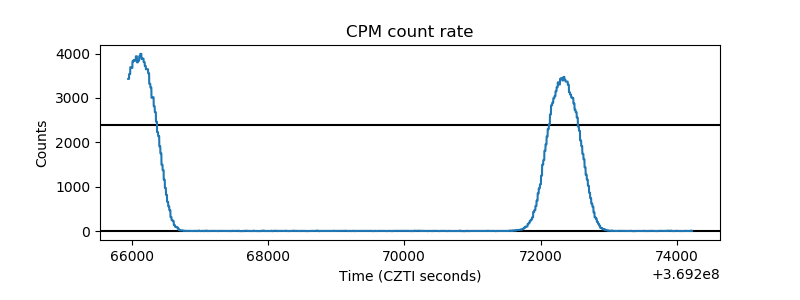 |
| CZT Counter | 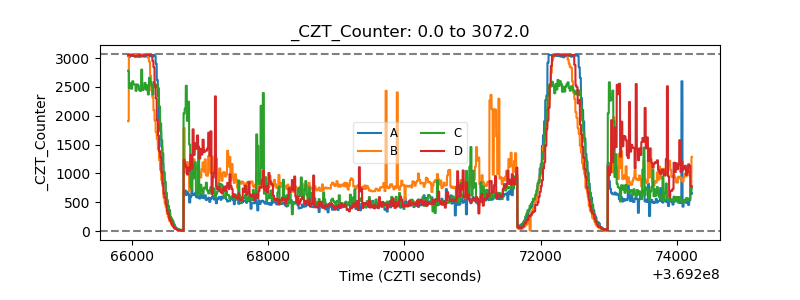 |
| +2.5 Volts monitor |  |
| +5 Volts monitor |  |
| _ROLL_ROT | 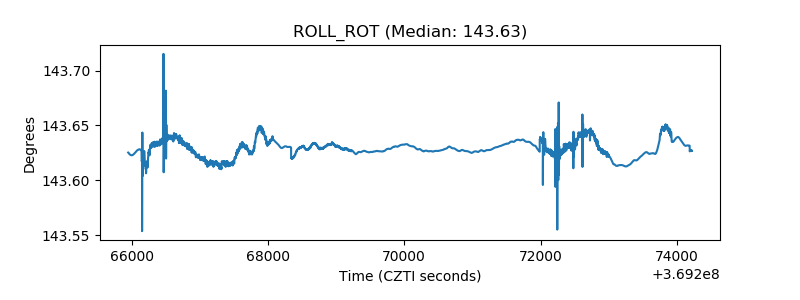 |
| _Roll_DEC | 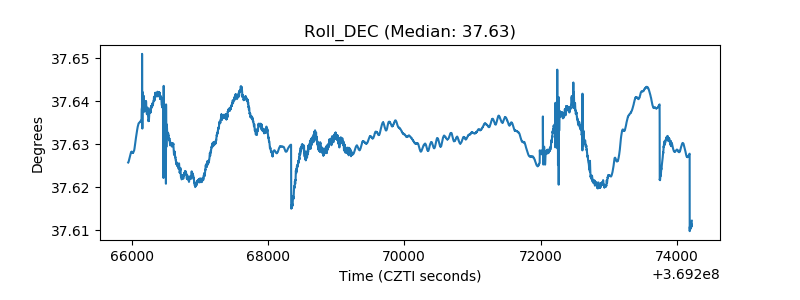 |
| _Roll_RA | 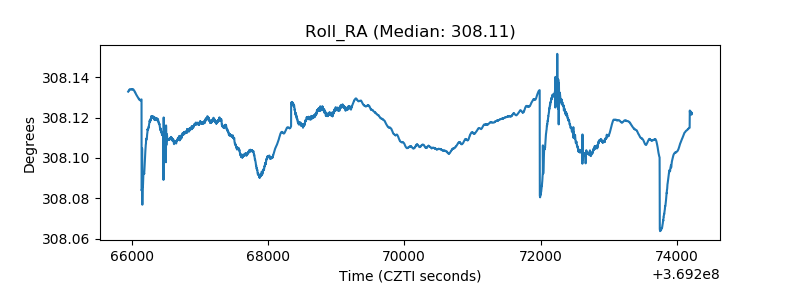 |
| Veto Counter | 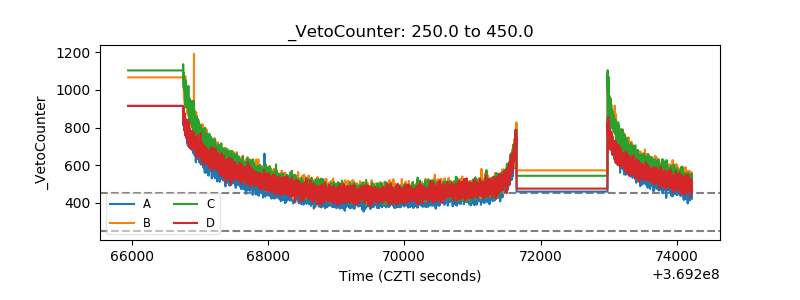 |