| Param | Original file | Final file |
|---|---|---|
| Filename | modeM0/AS1T04_054T01_9000004694_32237cztM0_level2.evt | modeM0/AS1T04_054T01_9000004694_32237cztM0_level2_quad_clean.evt |
| Size (bytes) | 648,953,280 | 95,984,640 |
| Size | 618.9 MB | 91.5 MB |
| Events in quadrant A | 3,270,122 | 649,358 |
| Events in quadrant B | 6,200,253 | 625,664 |
| Events in quadrant C | 3,861,992 | 613,544 |
| Events in quadrant D | 5,898,152 | 580,156 |
| Mode SS | |||
|---|---|---|---|
| Quadrant | BADHDUFLAG | Total packets | Discarded packets |
| A | 0 | 128 | 0 |
| B | 0 | 128 | 0 |
| C | 0 | 128 | 0 |
| D | 0 | 128 | 0 |
| Mode M0 | |||
|---|---|---|---|
| Quadrant | BADHDUFLAG | Total packets | Discarded packets |
| A | 0 | 13493 | 2 |
| B | 0 | 22538 | 2 |
| C | 0 | 15417 | 2 |
| D | 0 | 22055 | 2 |
| Mode M9 | |||
|---|---|---|---|
| Quadrant | BADHDUFLAG | Total packets | Discarded packets |
| A | 0 | 17 | 0 |
| B | 0 | 18 | 0 |
| C | 0 | 18 | 0 |
| D | 0 | 18 | 0 |
| Quadrant | Total seconds | Saturated seconds | Saturation percentage |
|---|---|---|---|
| A | 6269 | 30 | 0.478545% |
| B | 6269 | 598 | 9.539001% |
| C | 6269 | 249 | 3.971925% |
| D | 6268 | 153 | 2.440970% |
Noise dominated data is calculated using 1-second bins in cleaned event files. If a bin has >2000 counts, and if more than 50% of those come from <1% of pixels, then it is considered to be noise-dominated and hence unusable.
| Quadrant | # 1 sec bins | Bins with >0 counts | Bins with >2000 counts | High rate bins dominated by noise | Noise dominated (total time) | Noise dominated (detector-on time) | Marked lightcurve |
|---|---|---|---|---|---|---|---|
| A | 7605 | 6271 | 2 | 2 | 0.03% | 0.03% | 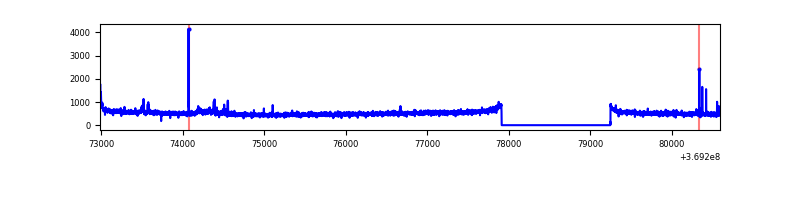 |
| B | 7605 | 6271 | 258 | 258 | 3.39% | 4.11% | 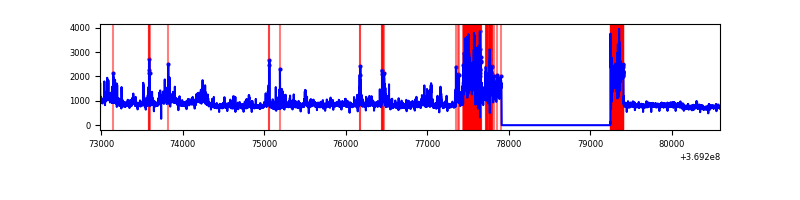 |
| C | 7605 | 6271 | 81 | 81 | 1.07% | 1.29% |  |
| D | 7604 | 6270 | 79 | 79 | 1.04% | 1.26% | 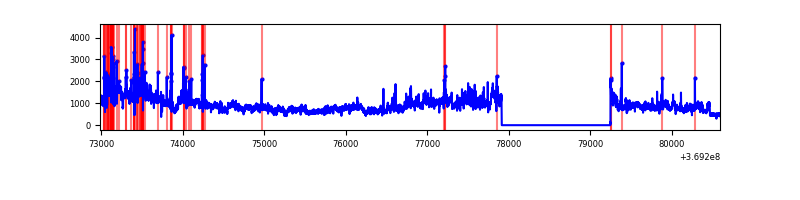 |
Top three noisy pixels from each quadrant. If the there are fewer than three noisy pixels in the level2.evt file, extra rows are filled as -1
| Pixel properties | Quadrant properties | ||||||
|---|---|---|---|---|---|---|---|
| Quadrant | DetID | PixID | Counts | Sigma | Mean | Median | Sigma |
| A | 15 | 174 | 55142 | 335.33 | 820 | 806 | 162.0 |
| A | 13 | 6 | 21667 | 128.74 | 820 | 806 | 162.0 |
| A | 12 | 96 | 21094 | 125.21 | 820 | 806 | 162.0 |
| B | 6 | 159 | 1705871 | 11489.19 | 795 | 776 | 148.4 |
| B | 4 | 80 | 1255411 | 8453.92 | 795 | 776 | 148.4 |
| B | 5 | 172 | 67536 | 449.84 | 795 | 776 | 148.4 |
| C | 0 | 10 | 405427 | 2236.33 | 780 | 788 | 180.9 |
| C | 3 | 233 | 191437 | 1053.67 | 780 | 788 | 180.9 |
| C | 14 | 238 | 143714 | 789.91 | 780 | 788 | 180.9 |
| D | 8 | 195 | 2638713 | 14171.22 | 778 | 757 | 186.1 |
| D | 12 | 233 | 176355 | 943.32 | 778 | 757 | 186.1 |
| D | 13 | 249 | 69974 | 371.84 | 778 | 757 | 186.1 |
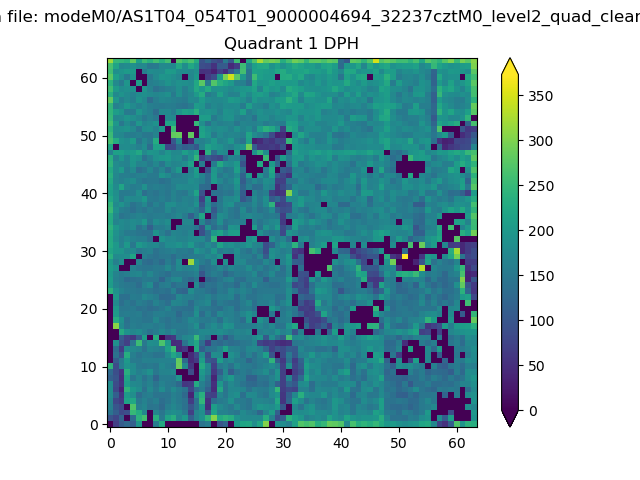
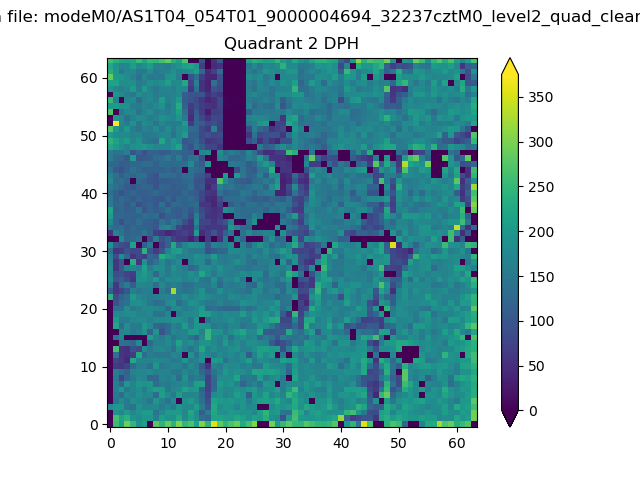
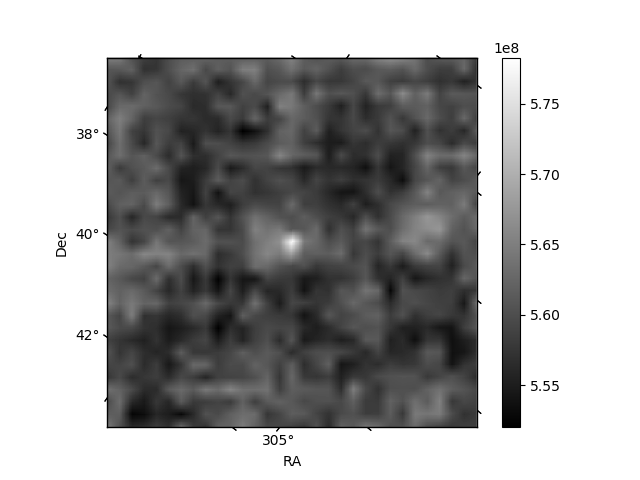
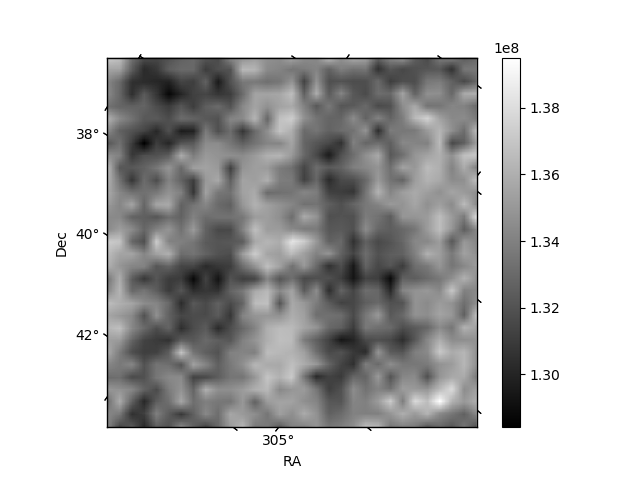
Histogram calculated using DETX and DETY for each event in the final _common_clean file
| Quadrant A | 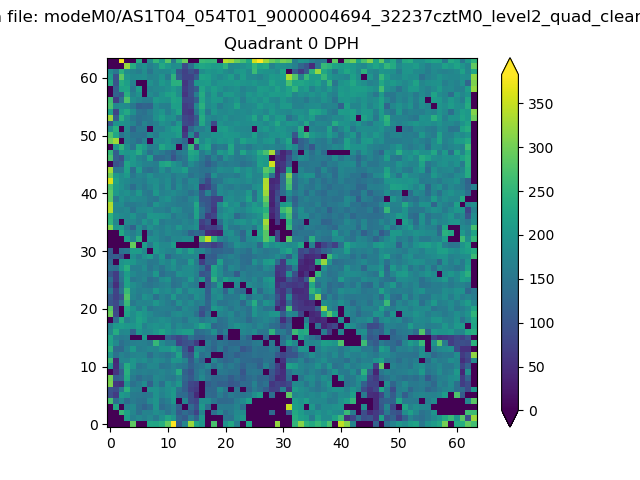 |
 |
Quadrant B |
|---|---|---|---|
| Quadrant D | 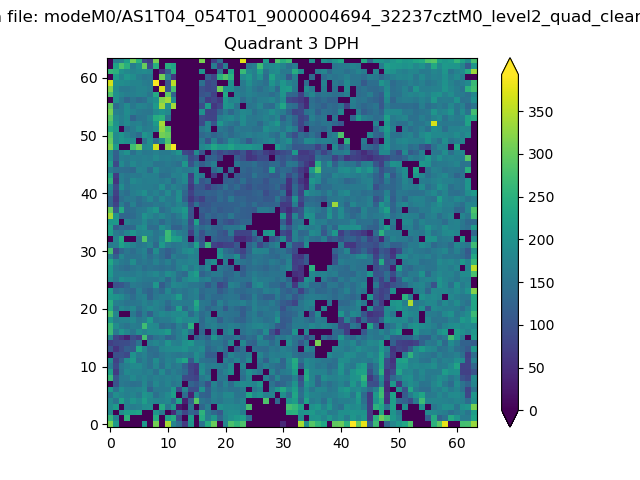 |
 |
Quadrant C |
| Plot type | Count rate plots | Images |
|---|---|---|
| Comparison with Poisson distribution Blue bars denote a histogram of data divided into 1 sec bins. Red curve is a Poisson curve with rate = median count rate of data. |
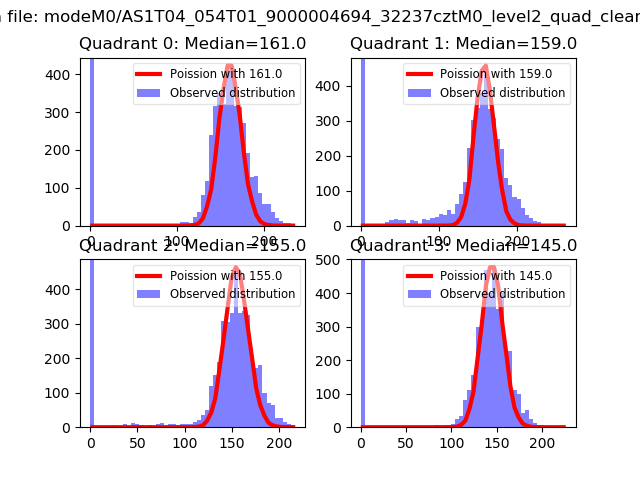 |
 |
| Quadrant-wise count rates Data is divided into 100 sec bins |
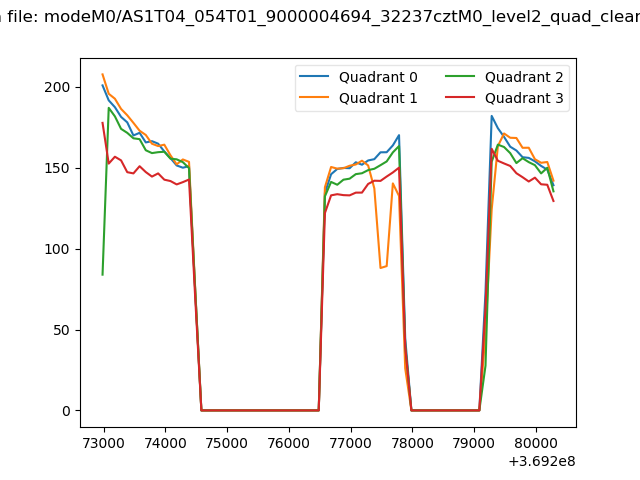 |
|
| Module-wise count rates for Quadrant A Data is divided into 100 sec bins |
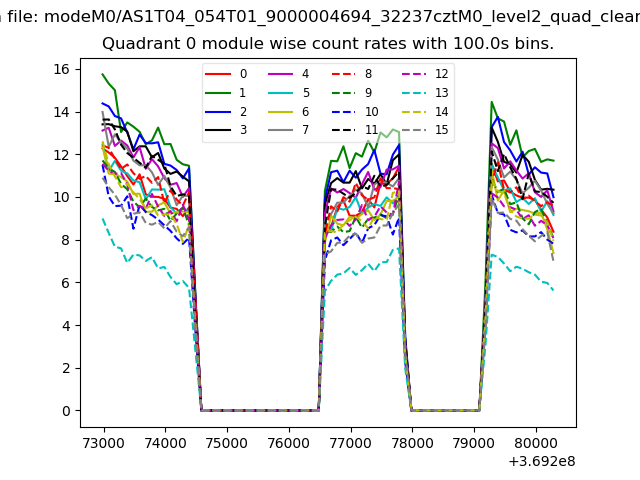 |
 |
| Module-wise count rates for Quadrant B Data is divided into 100 sec bins |
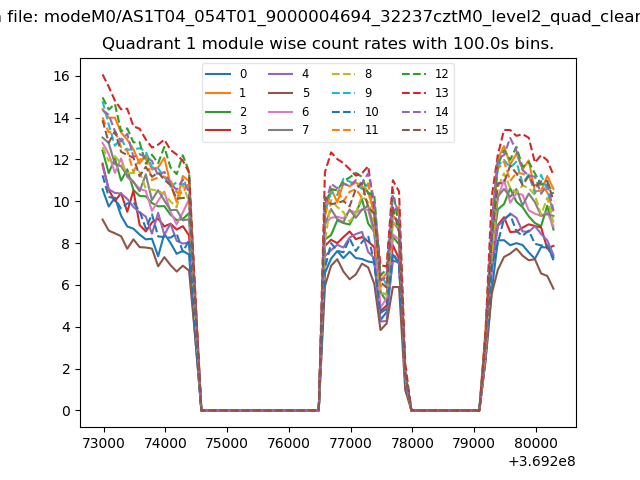 |
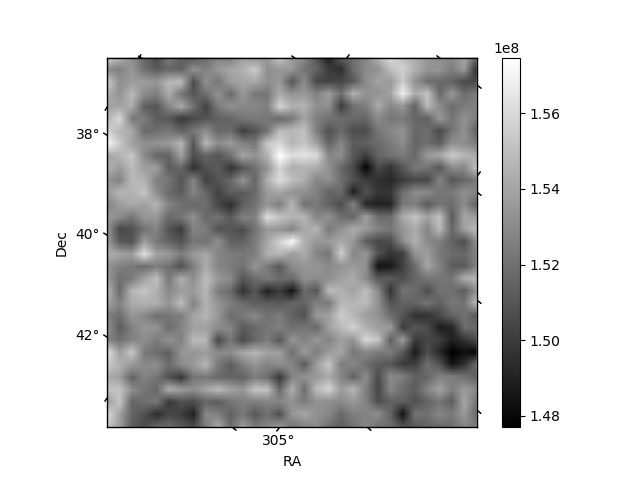 |
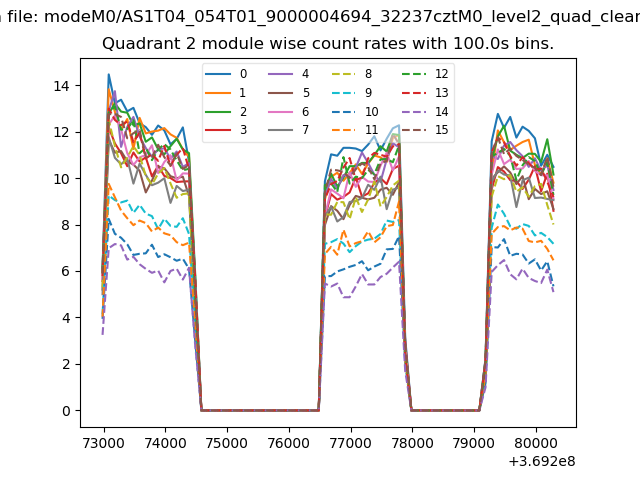
| Module-wise count rates for Quadrant C Data is divided into 100 sec bins |
 |
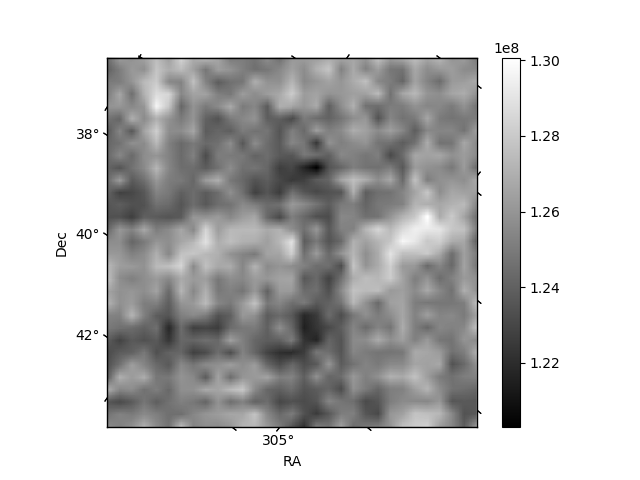 |
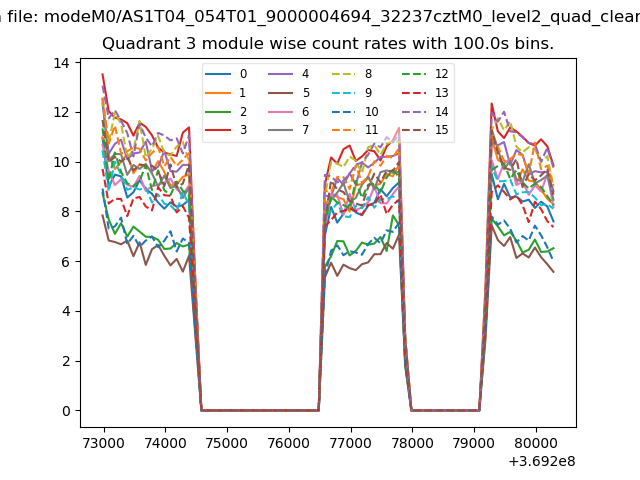
| Module-wise count rates for Quadrant D Data is divided into 100 sec bins |
 |
 |
| Parameter | Plot |
|---|---|
| CZT HV Monitor | 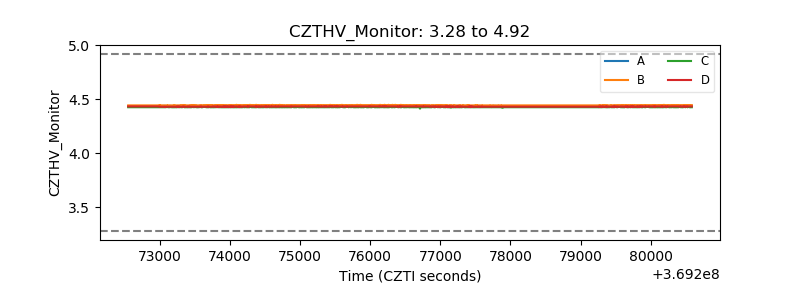 |
| D_VDD | 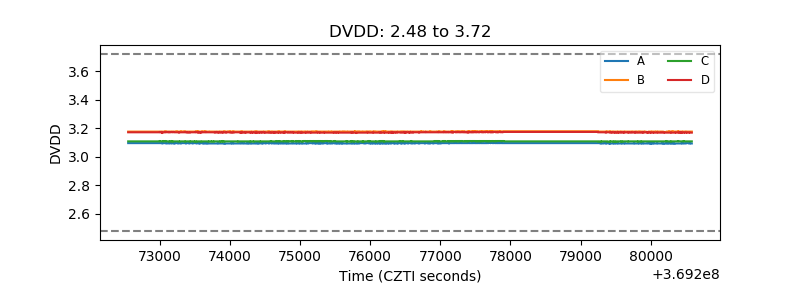 |
| Temperature 1 | 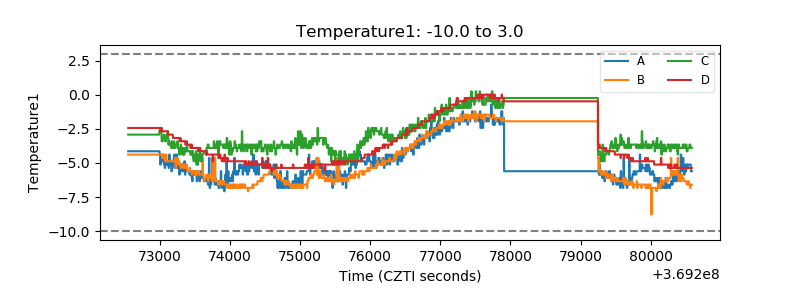 |
| Veto HV Monitor | 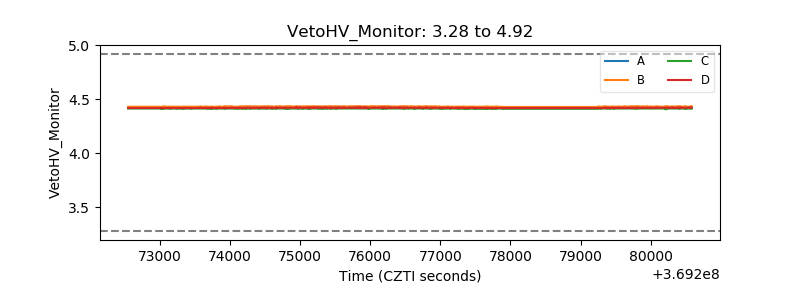 |
| Veto LLD | 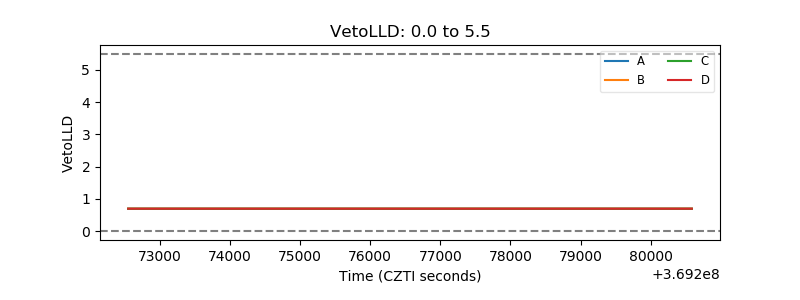 |
| Alpha Counter | 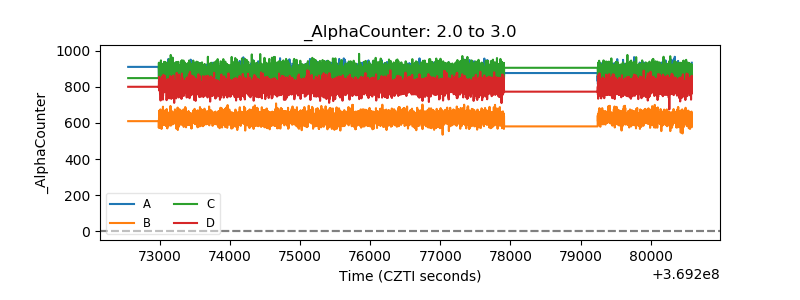 |
| _CPM_Rate | 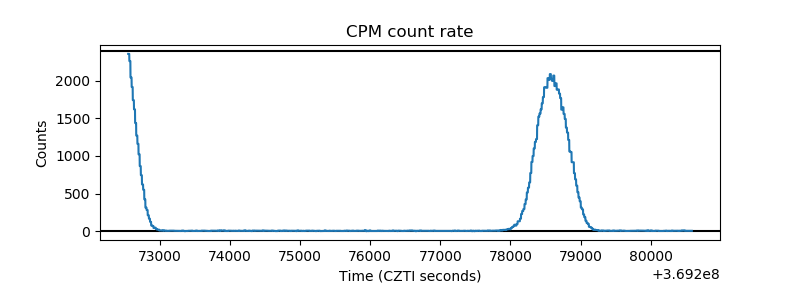 |
| CZT Counter | 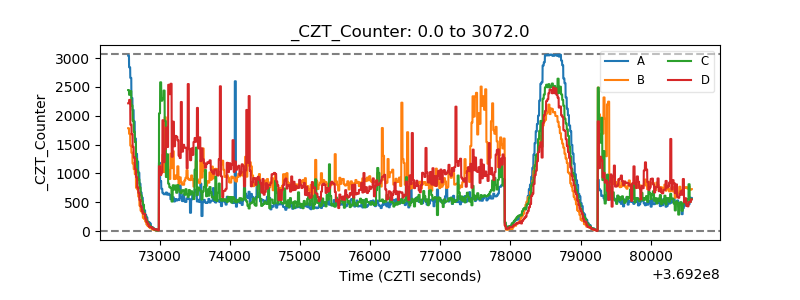 |
| +2.5 Volts monitor |  |
| +5 Volts monitor |  |
| _ROLL_ROT | 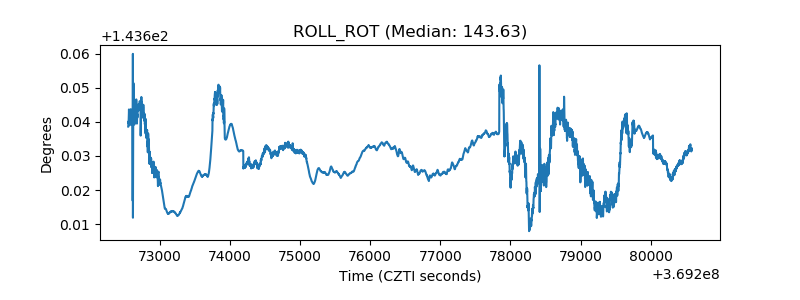 |
| _Roll_DEC |  |
| _Roll_RA | 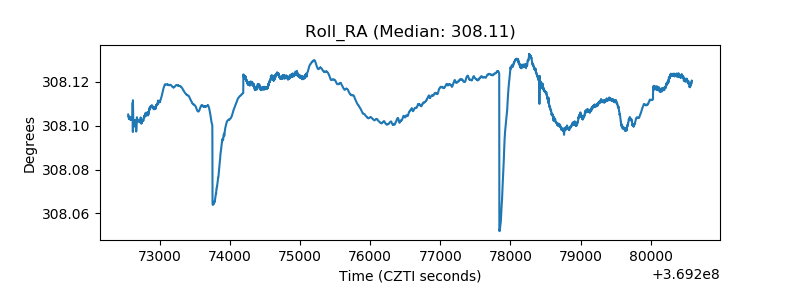 |
| Veto Counter | 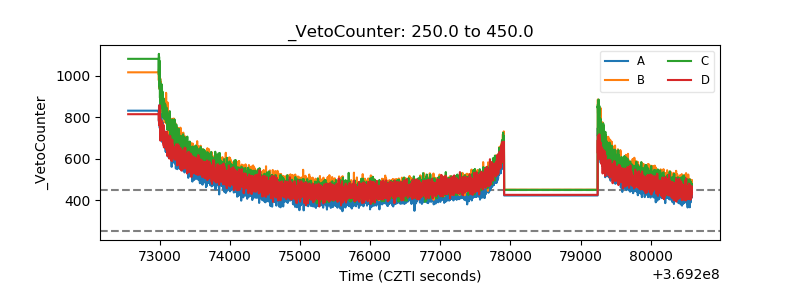 |