| Param | Original file | Final file |
|---|---|---|
| Filename | modeM0/AS1T04_054T01_9000004694_32238cztM0_level2.evt | modeM0/AS1T04_054T01_9000004694_32238cztM0_level2_quad_clean.evt |
| Size (bytes) | 552,404,160 | 86,613,120 |
| Size | 526.8 MB | 82.6 MB |
| Events in quadrant A | 3,121,140 | 563,293 |
| Events in quadrant B | 5,042,142 | 565,082 |
| Events in quadrant C | 3,600,138 | 541,012 |
| Events in quadrant D | 4,543,589 | 517,468 |
| Mode SS | |||
|---|---|---|---|
| Quadrant | BADHDUFLAG | Total packets | Discarded packets |
| A | 0 | 126 | 0 |
| B | 0 | 126 | 0 |
| C | 0 | 126 | 0 |
| D | 0 | 126 | 0 |
| Mode M0 | |||
|---|---|---|---|
| Quadrant | BADHDUFLAG | Total packets | Discarded packets |
| A | 0 | 13051 | 2 |
| B | 0 | 19485 | 1 |
| C | 0 | 14517 | 1 |
| D | 0 | 17743 | 1 |
| Mode M9 | |||
|---|---|---|---|
| Quadrant | BADHDUFLAG | Total packets | Discarded packets |
| A | 0 | 12 | 0 |
| B | 0 | 12 | 0 |
| C | 0 | 12 | 0 |
| D | 0 | 12 | 0 |
| Quadrant | Total seconds | Saturated seconds | Saturation percentage |
|---|---|---|---|
| A | 6248 | 29 | 0.464149% |
| B | 6248 | 179 | 2.864917% |
| C | 6248 | 167 | 2.672855% |
| D | 6248 | 89 | 1.424456% |
Noise dominated data is calculated using 1-second bins in cleaned event files. If a bin has >2000 counts, and if more than 50% of those come from <1% of pixels, then it is considered to be noise-dominated and hence unusable.
| Quadrant | # 1 sec bins | Bins with >0 counts | Bins with >2000 counts | High rate bins dominated by noise | Noise dominated (total time) | Noise dominated (detector-on time) | Marked lightcurve |
|---|---|---|---|---|---|---|---|
| A | 7403 | 6249 | 3 | 3 | 0.04% | 0.05% |  |
| B | 7403 | 6249 | 62 | 62 | 0.84% | 0.99% | 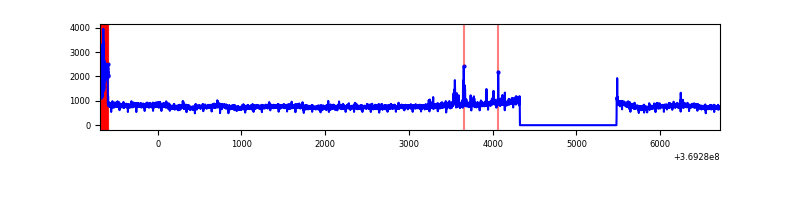 |
| C | 7403 | 6249 | 28 | 28 | 0.38% | 0.45% | 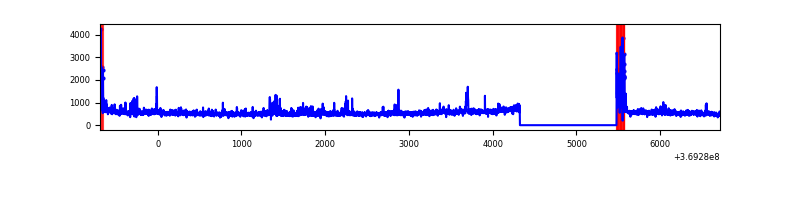 |
| D | 7403 | 6249 | 25 | 25 | 0.34% | 0.40% | 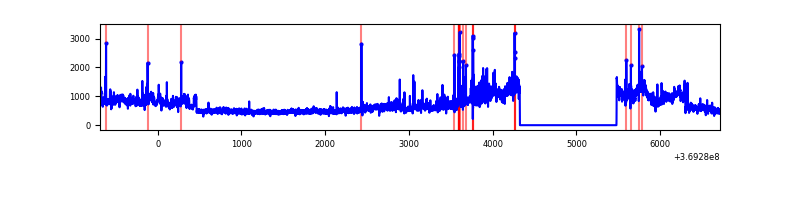 |
Top three noisy pixels from each quadrant. If the there are fewer than three noisy pixels in the level2.evt file, extra rows are filled as -1
| Pixel properties | Quadrant properties | ||||||
|---|---|---|---|---|---|---|---|
| Quadrant | DetID | PixID | Counts | Sigma | Mean | Median | Sigma |
| A | 12 | 96 | 49618 | 310.18 | 793 | 781 | 157.4 |
| A | 13 | 6 | 11363 | 67.21 | 793 | 781 | 157.4 |
| A | 13 | 254 | 10989 | 64.83 | 793 | 781 | 157.4 |
| B | 6 | 159 | 1699981 | 11399.3 | 789 | 769 | 149.1 |
| B | 4 | 80 | 143499 | 957.52 | 789 | 769 | 149.1 |
| B | 0 | 229 | 46002 | 303.45 | 789 | 769 | 149.1 |
| C | 3 | 233 | 286221 | 1616.79 | 761 | 770 | 176.6 |
| C | 0 | 10 | 173882 | 980.5 | 761 | 770 | 176.6 |
| C | 14 | 238 | 133906 | 754.08 | 761 | 770 | 176.6 |
| D | 8 | 195 | 1470751 | 8156.52 | 757 | 738 | 180.2 |
| D | 12 | 233 | 66759 | 366.32 | 757 | 738 | 180.2 |
| D | 12 | 218 | 63034 | 345.66 | 757 | 738 | 180.2 |
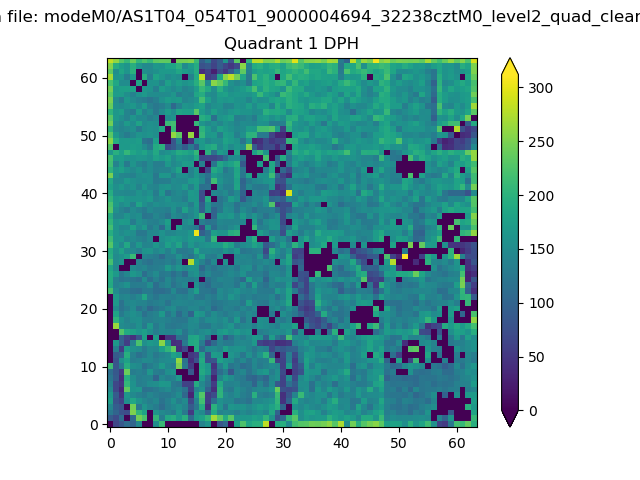
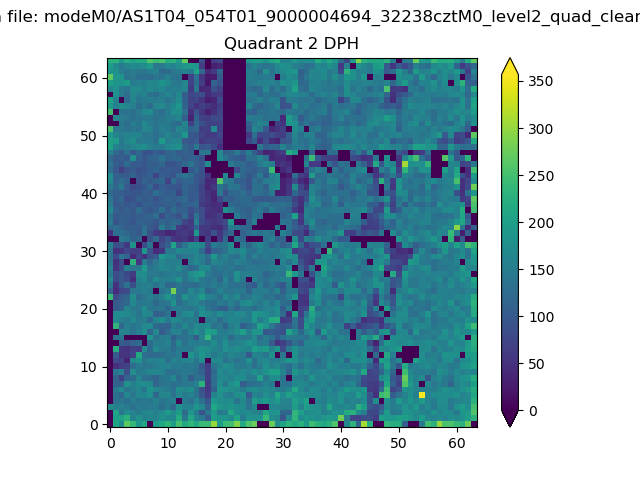
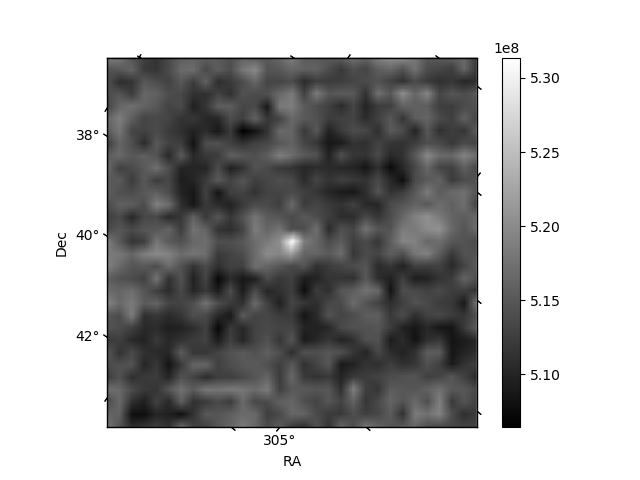
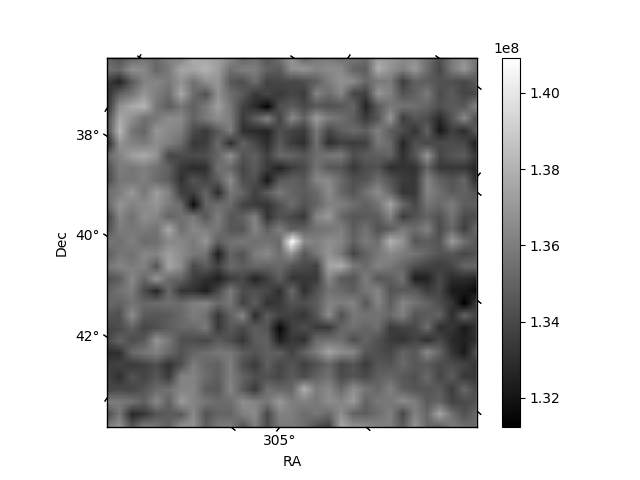
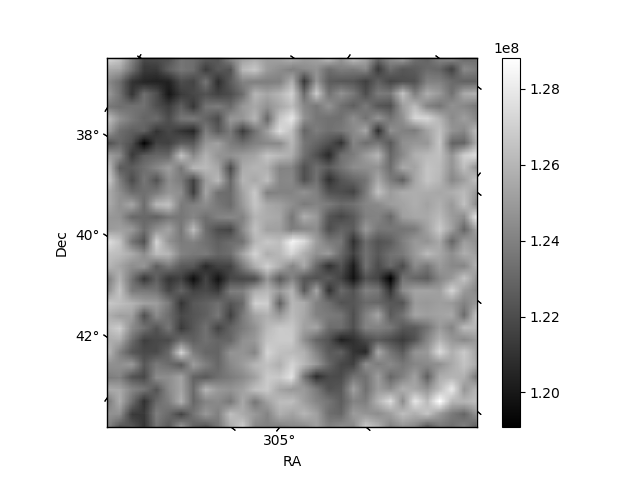
Histogram calculated using DETX and DETY for each event in the final _common_clean file
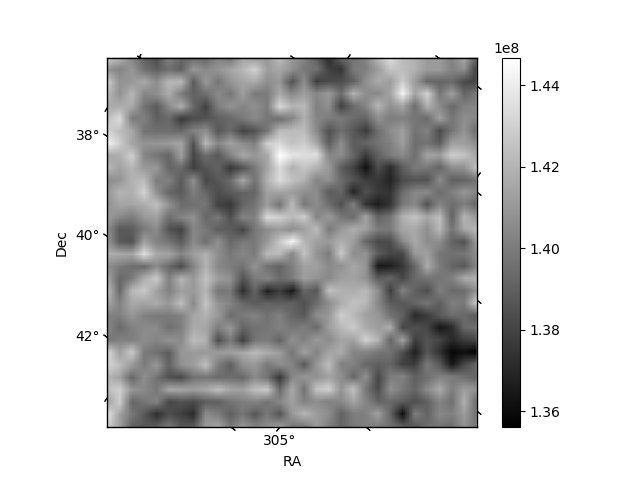
| Quadrant A | 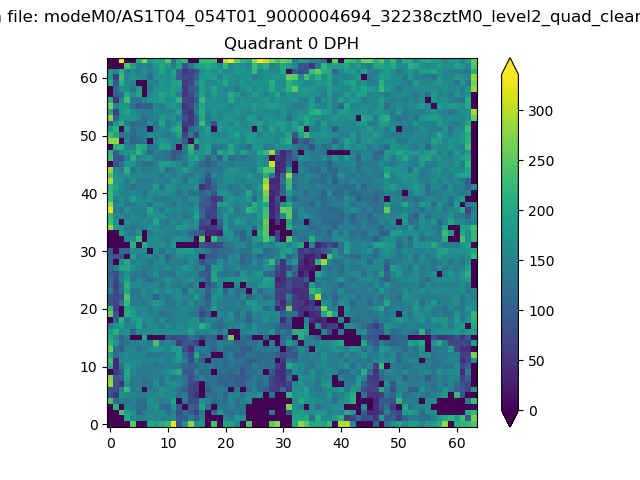 |
 |
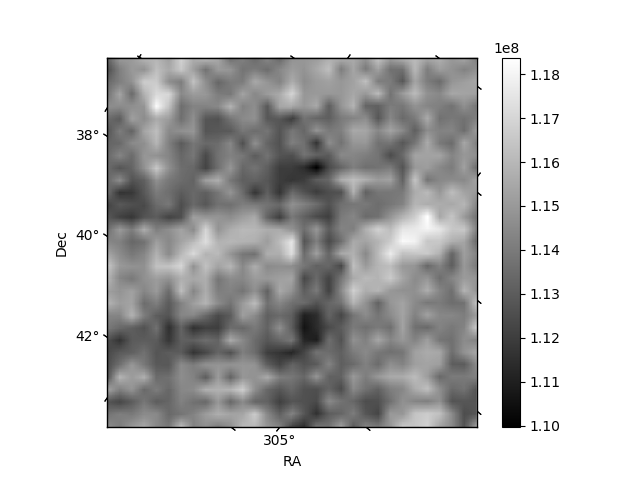
Quadrant B |
|---|---|---|---|
| Quadrant D | 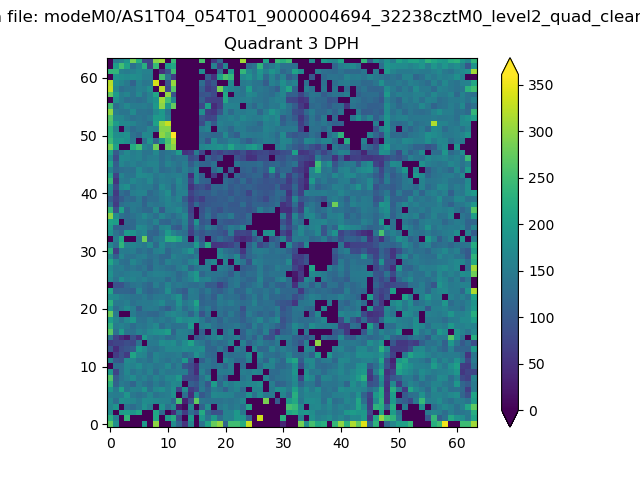 |
 |
Quadrant C |
| Plot type | Count rate plots | Images |
|---|---|---|
| Comparison with Poisson distribution Blue bars denote a histogram of data divided into 1 sec bins. Red curve is a Poisson curve with rate = median count rate of data. |
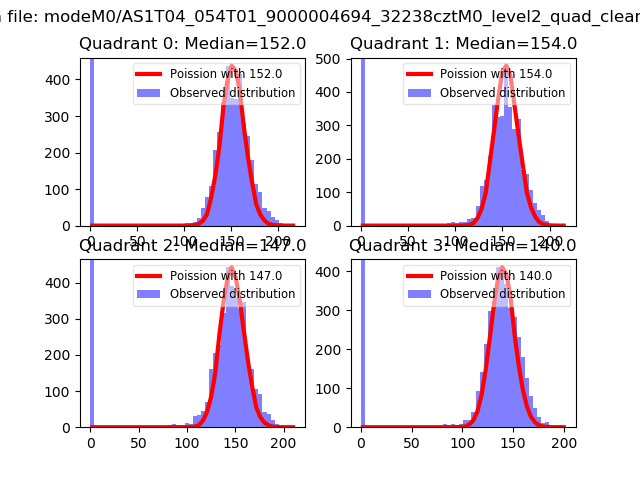 |
 |
| Quadrant-wise count rates Data is divided into 100 sec bins |
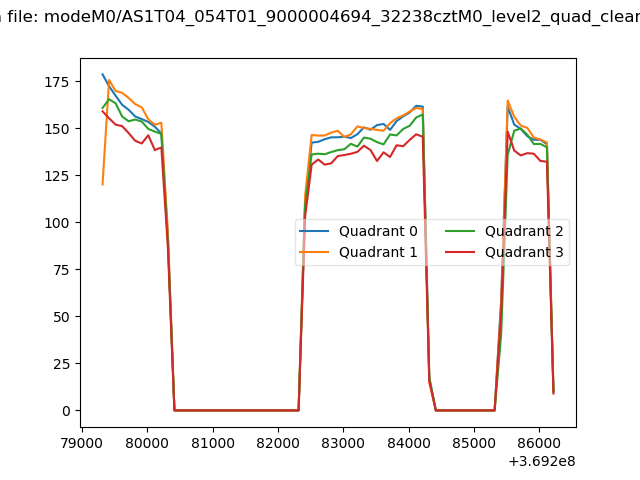 |
|
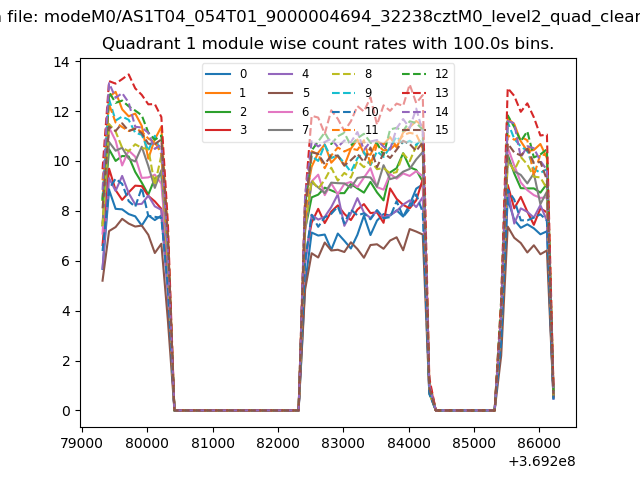
| Module-wise count rates for Quadrant A Data is divided into 100 sec bins |
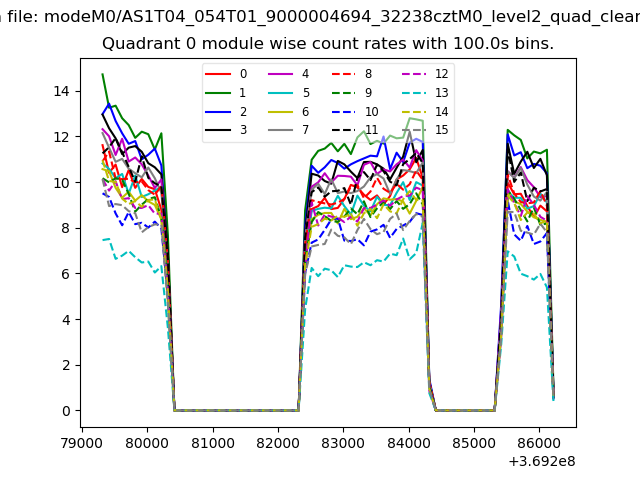 |
 |
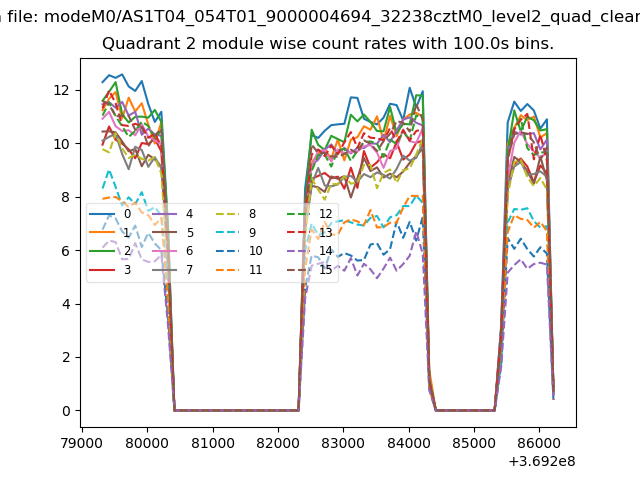
| Module-wise count rates for Quadrant B Data is divided into 100 sec bins |
 |
 |
| Module-wise count rates for Quadrant C Data is divided into 100 sec bins |
 |
 |
| Module-wise count rates for Quadrant D Data is divided into 100 sec bins |
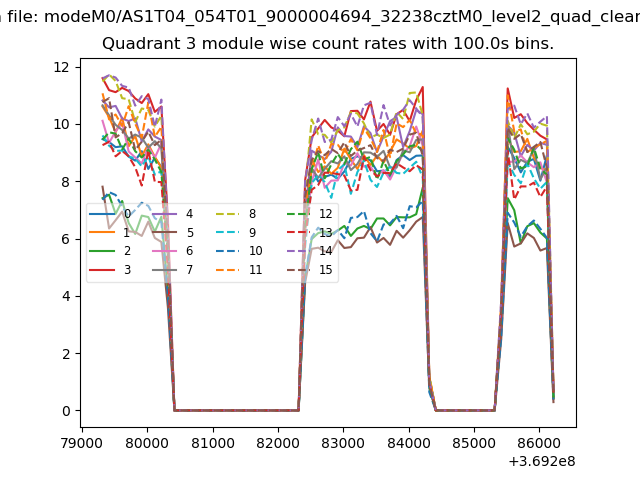 |
 |
| Parameter | Plot |
|---|---|
| CZT HV Monitor | 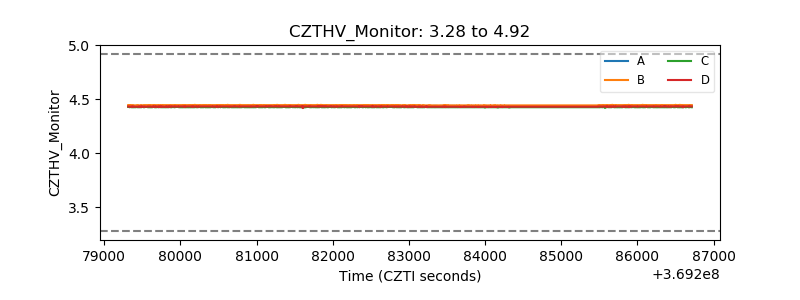 |
| D_VDD |  |
| Temperature 1 | 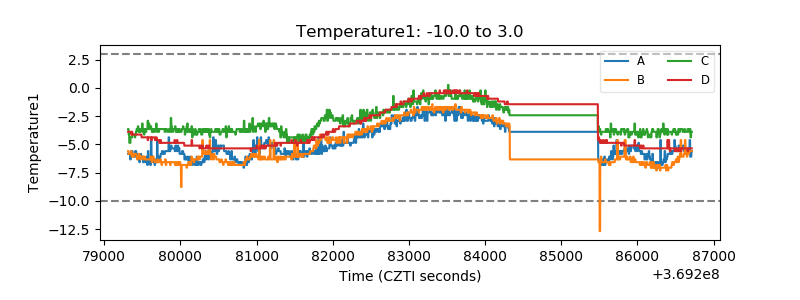 |
| Veto HV Monitor |  |
| Veto LLD | 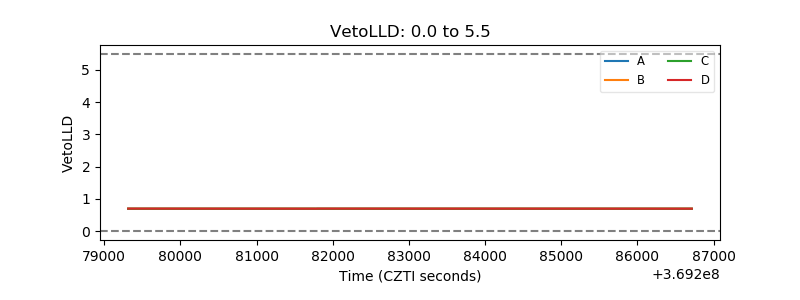 |
| Alpha Counter | 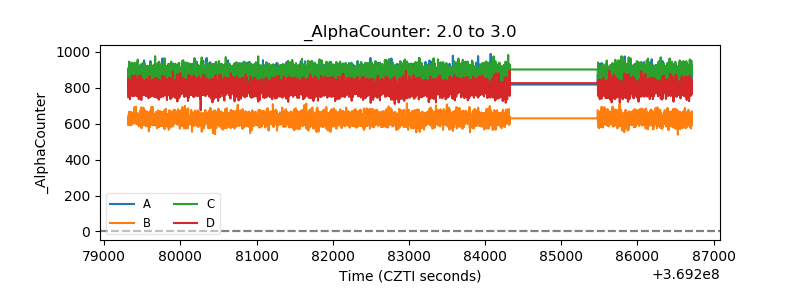 |
| _CPM_Rate | 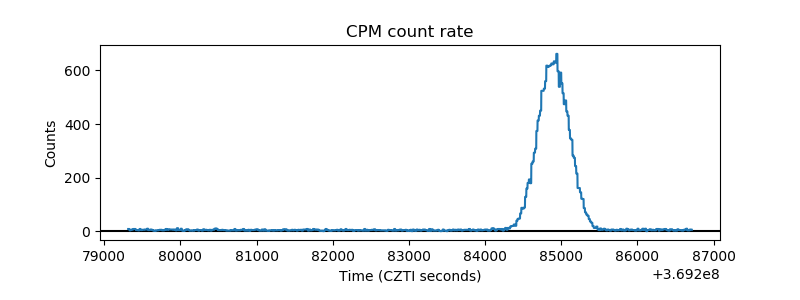 |
| CZT Counter | 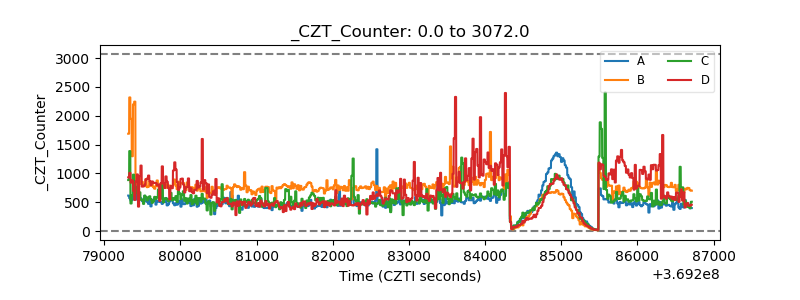 |
| +2.5 Volts monitor |  |
| +5 Volts monitor |  |
| _ROLL_ROT | 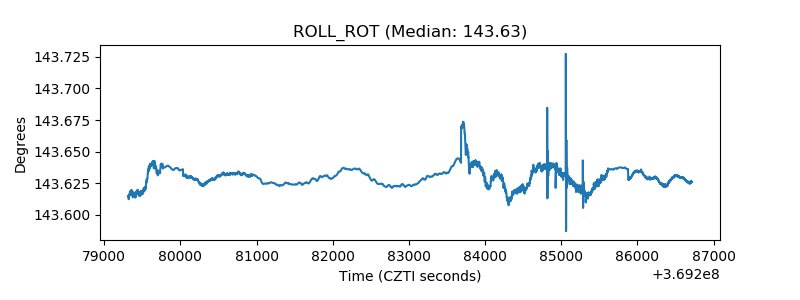 |
| _Roll_DEC | 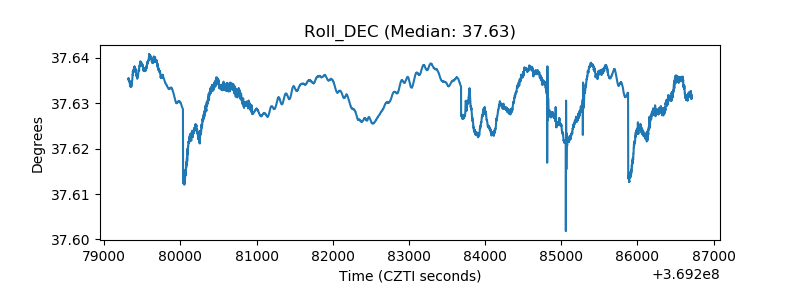 |
| _Roll_RA | 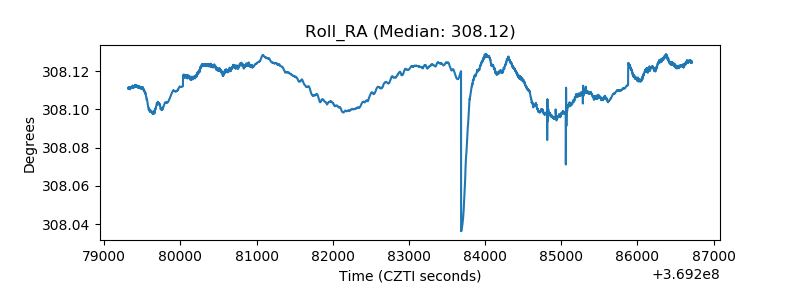 |
| Veto Counter | 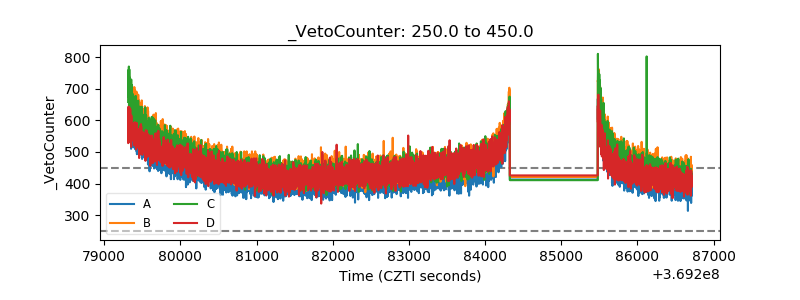 |