| Param | Original file | Final file |
|---|---|---|
| Filename | modeM0/AS1T04_054T01_9000004694_32240cztM0_level2.evt | modeM0/AS1T04_054T01_9000004694_32240cztM0_level2_quad_clean.evt |
| Size (bytes) | 675,866,880 | 89,660,160 |
| Size | 644.6 MB | 85.5 MB |
| Events in quadrant A | 3,747,426 | 565,790 |
| Events in quadrant B | 5,976,042 | 560,088 |
| Events in quadrant C | 4,367,108 | 544,533 |
| Events in quadrant D | 5,859,771 | 511,057 |
| Mode SS | |||
|---|---|---|---|
| Quadrant | BADHDUFLAG | Total packets | Discarded packets |
| A | 0 | 158 | 0 |
| B | 0 | 158 | 0 |
| C | 0 | 158 | 0 |
| D | 0 | 158 | 0 |
| Mode M0 | |||
|---|---|---|---|
| Quadrant | BADHDUFLAG | Total packets | Discarded packets |
| A | 0 | 15989 | 3 |
| B | 0 | 23569 | 2 |
| C | 0 | 17589 | 2 |
| D | 0 | 22758 | 2 |
| Mode M9 | |||
|---|---|---|---|
| Quadrant | BADHDUFLAG | Total packets | Discarded packets |
| A | 0 | 10 | 0 |
| B | 0 | 10 | 0 |
| C | 0 | 10 | 0 |
| D | 0 | 10 | 0 |
| Quadrant | Total seconds | Saturated seconds | Saturation percentage |
|---|---|---|---|
| A | 7659 | 220 | 2.872438% |
| B | 7659 | 416 | 5.431518% |
| C | 7659 | 389 | 5.078992% |
| D | 7659 | 519 | 6.776342% |
Noise dominated data is calculated using 1-second bins in cleaned event files. If a bin has >2000 counts, and if more than 50% of those come from <1% of pixels, then it is considered to be noise-dominated and hence unusable.
| Quadrant | # 1 sec bins | Bins with >0 counts | Bins with >2000 counts | High rate bins dominated by noise | Noise dominated (total time) | Noise dominated (detector-on time) | Marked lightcurve |
|---|---|---|---|---|---|---|---|
| A | 8694 | 7661 | 0 | 0 | 0.00% | 0.00% | 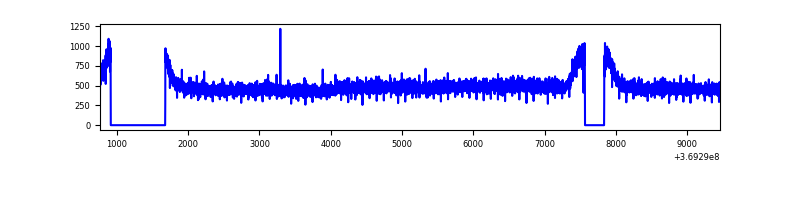 |
| B | 8694 | 7661 | 26 | 26 | 0.30% | 0.34% | 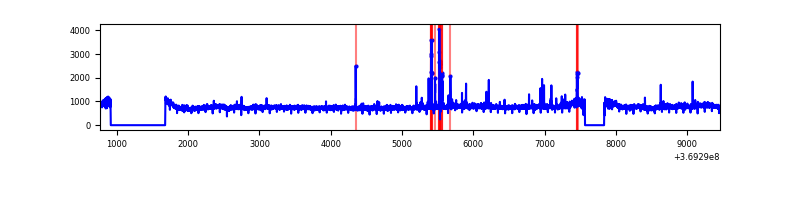 |
| C | 8694 | 7661 | 18 | 18 | 0.21% | 0.23% |  |
| D | 8694 | 7661 | 193 | 193 | 2.22% | 2.52% | 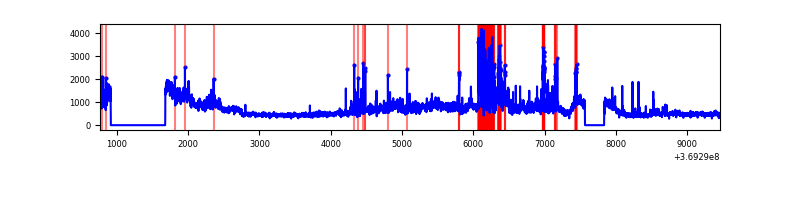 |
Top three noisy pixels from each quadrant. If the there are fewer than three noisy pixels in the level2.evt file, extra rows are filled as -1
| Pixel properties | Quadrant properties | ||||||
|---|---|---|---|---|---|---|---|
| Quadrant | DetID | PixID | Counts | Sigma | Mean | Median | Sigma |
| A | 13 | 6 | 18956 | 92.24 | 965 | 945 | 195.3 |
| A | 13 | 254 | 15806 | 76.11 | 965 | 945 | 195.3 |
| A | 3 | 137 | 10084 | 46.8 | 965 | 945 | 195.3 |
| B | 6 | 159 | 2021990 | 10920.98 | 951 | 925 | 185.1 |
| B | 5 | 172 | 80029 | 427.44 | 951 | 925 | 185.1 |
| B | 0 | 229 | 54323 | 288.54 | 951 | 925 | 185.1 |
| C | 3 | 233 | 346956 | 1577.76 | 924 | 927 | 219.3 |
| C | 14 | 238 | 170007 | 770.94 | 924 | 927 | 219.3 |
| C | 0 | 10 | 113467 | 513.14 | 924 | 927 | 219.3 |
| D | 8 | 195 | 1517046 | 6900.45 | 917 | 890 | 219.7 |
| D | 12 | 233 | 675268 | 3069.28 | 917 | 890 | 219.7 |
| D | 12 | 79 | 122347 | 552.78 | 917 | 890 | 219.7 |
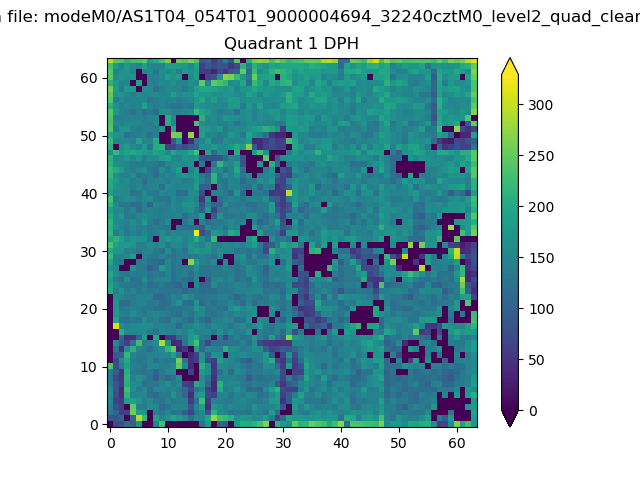
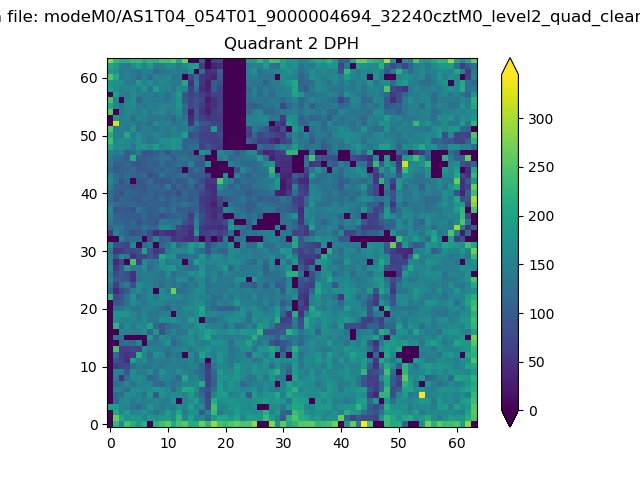
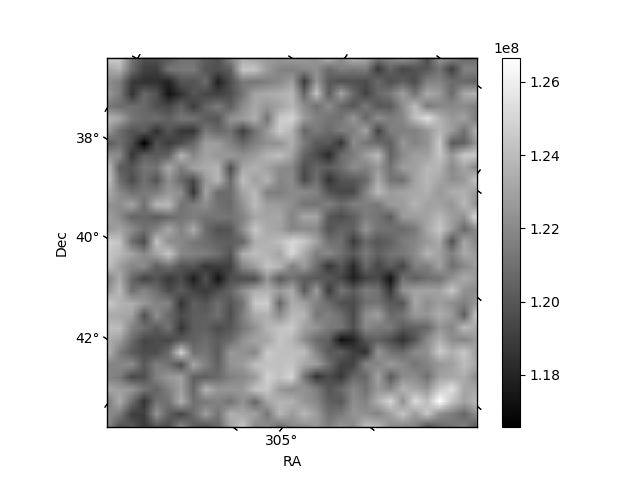
Histogram calculated using DETX and DETY for each event in the final _common_clean file
| Quadrant A | 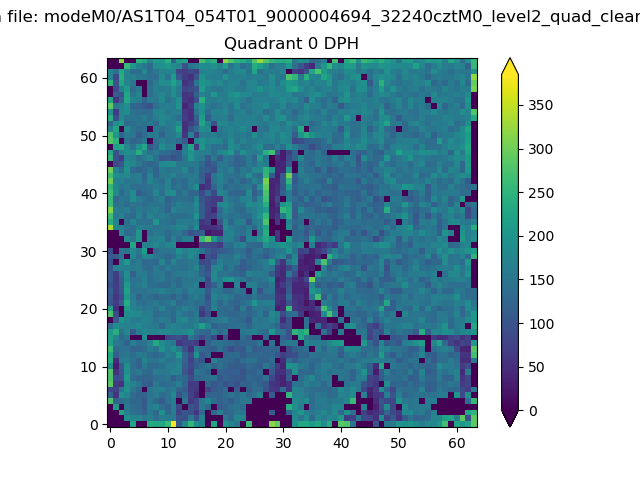 |
 |
Quadrant B |
|---|---|---|---|
| Quadrant D | 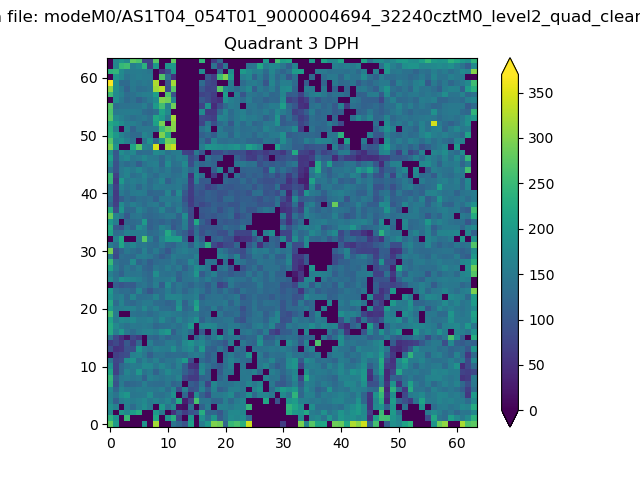 |
 |
Quadrant C |
| Plot type | Count rate plots | Images |
|---|---|---|
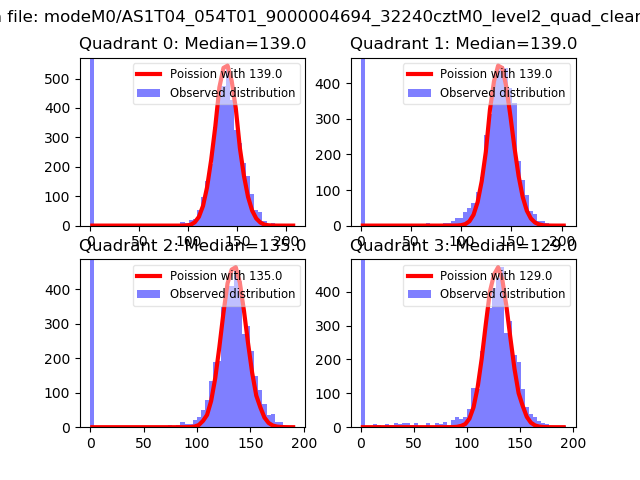
| Comparison with Poisson distribution Blue bars denote a histogram of data divided into 1 sec bins. Red curve is a Poisson curve with rate = median count rate of data. |
 |
 |
| Quadrant-wise count rates Data is divided into 100 sec bins |
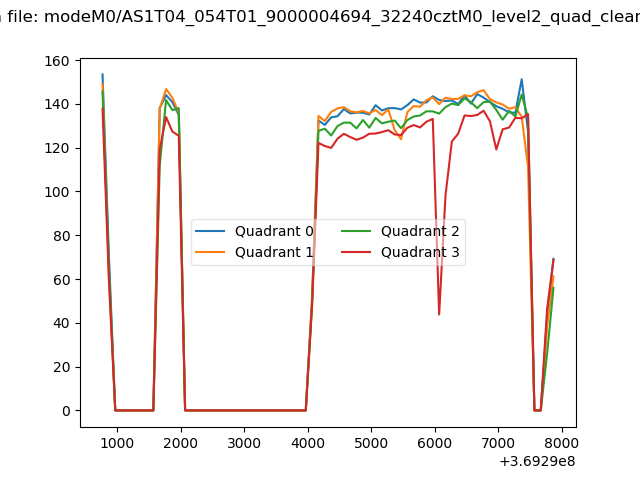 |
|
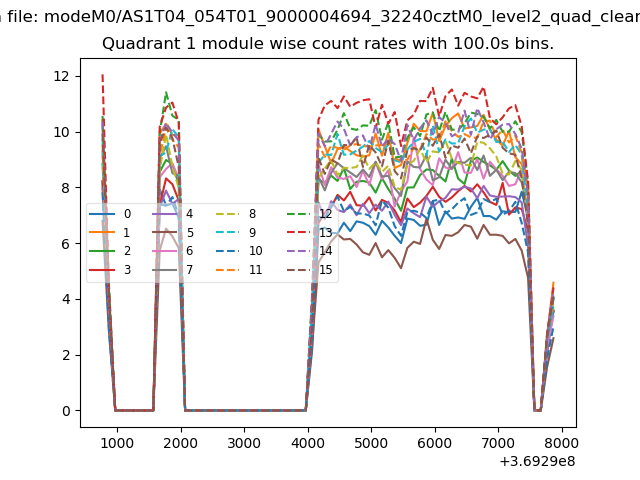
| Module-wise count rates for Quadrant A Data is divided into 100 sec bins |
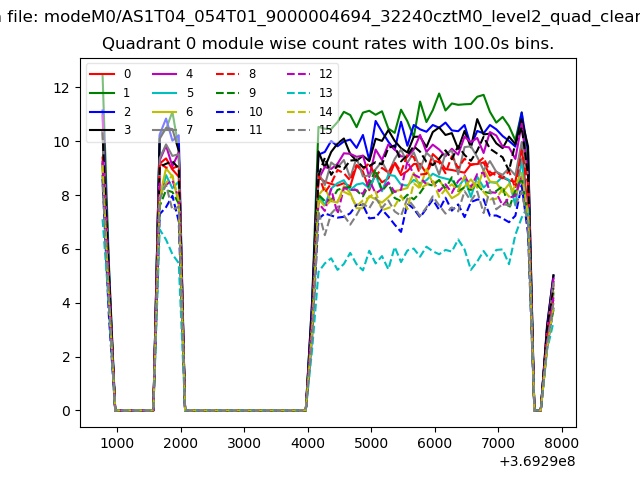 |
 |
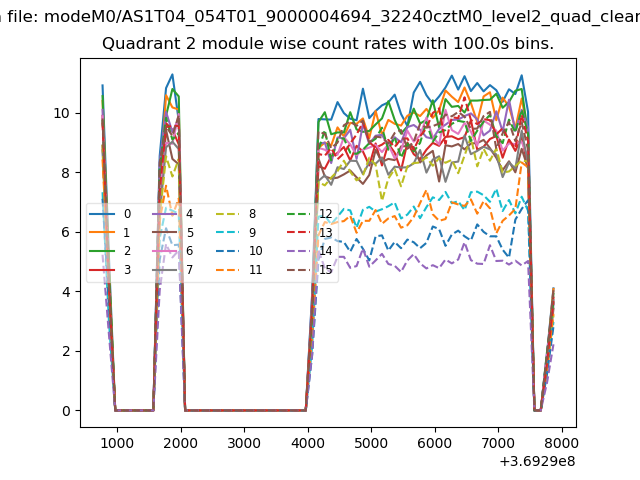
| Module-wise count rates for Quadrant B Data is divided into 100 sec bins |
 |
 |
| Module-wise count rates for Quadrant C Data is divided into 100 sec bins |
 |
 |
| Module-wise count rates for Quadrant D Data is divided into 100 sec bins |
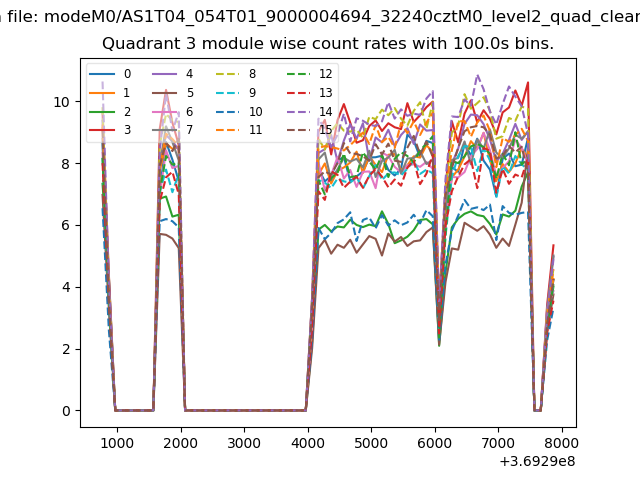 |
 |
| Parameter | Plot |
|---|---|
| CZT HV Monitor | 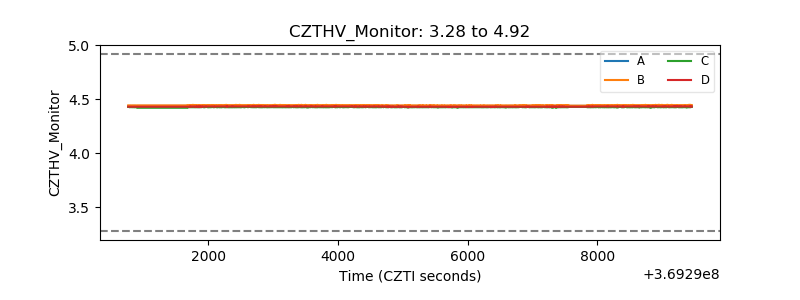 |
| D_VDD | 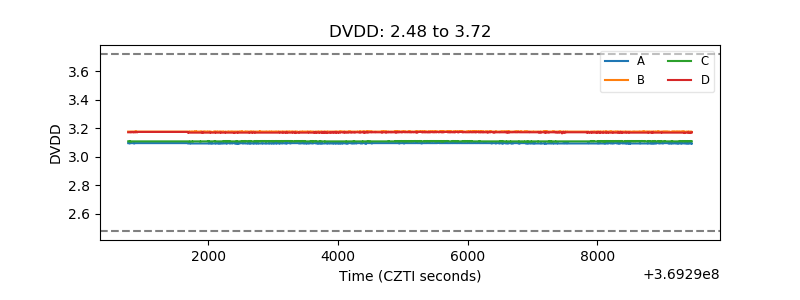 |
| Temperature 1 | 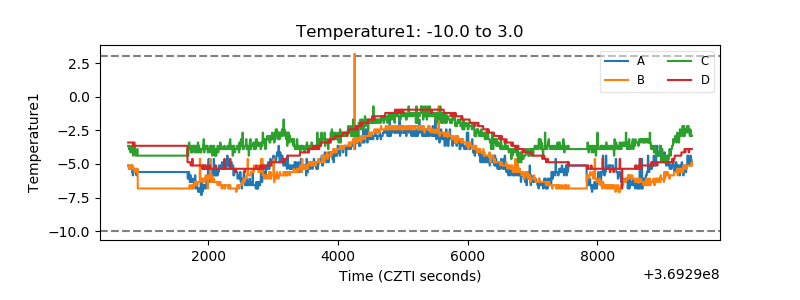 |
| Veto HV Monitor | 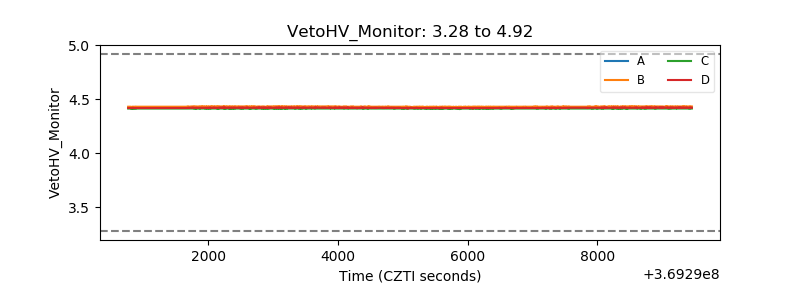 |
| Veto LLD | 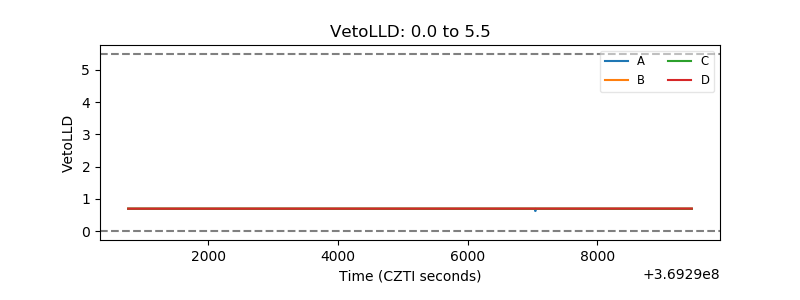 |
| Alpha Counter | 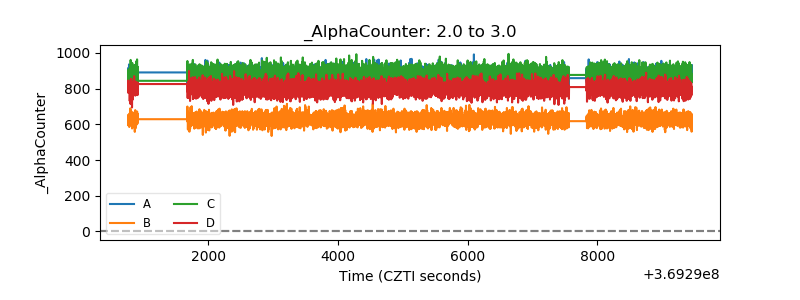 |
| _CPM_Rate | 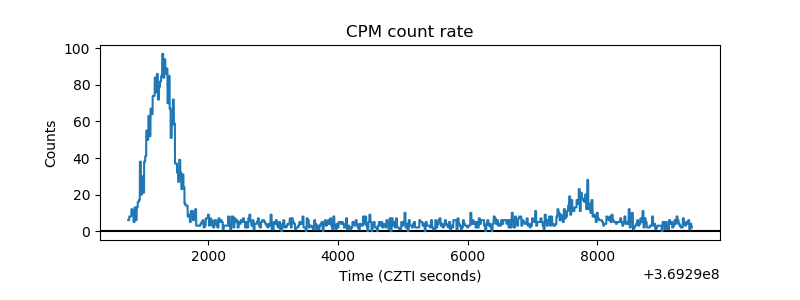 |
| CZT Counter | 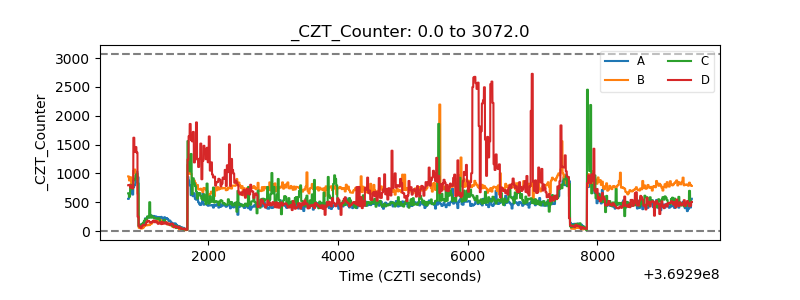 |
| +2.5 Volts monitor |  |
| +5 Volts monitor |  |
| _ROLL_ROT | 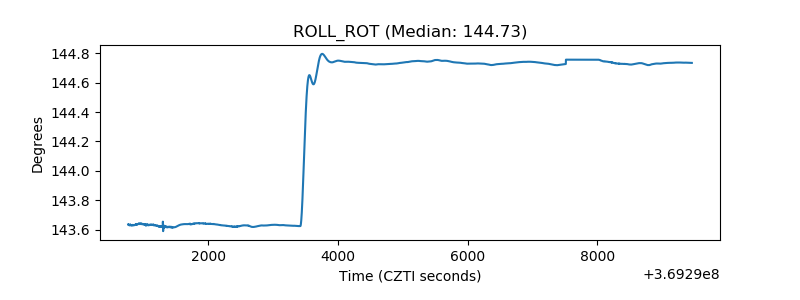 |
| _Roll_DEC |  |
| _Roll_RA | 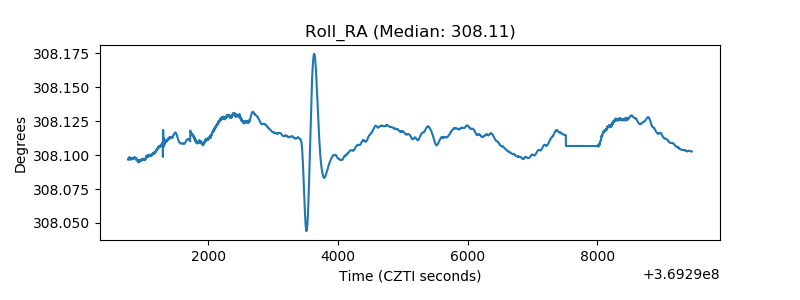 |
| Veto Counter | 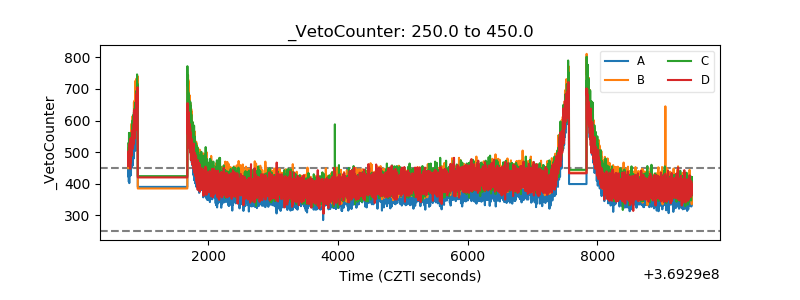 |