| Param | Original file | Final file |
|---|---|---|
| Filename | modeM0/AS1T04_054T01_9000004694_32241cztM0_level2.evt | modeM0/AS1T04_054T01_9000004694_32241cztM0_level2_quad_clean.evt |
| Size (bytes) | 626,639,040 | 83,692,800 |
| Size | 597.6 MB | 79.8 MB |
| Events in quadrant A | 3,714,099 | 512,315 |
| Events in quadrant B | 6,090,153 | 511,155 |
| Events in quadrant C | 4,202,336 | 491,906 |
| Events in quadrant D | 4,446,427 | 480,210 |
| Mode SS | |||
|---|---|---|---|
| Quadrant | BADHDUFLAG | Total packets | Discarded packets |
| A | 0 | 156 | 0 |
| B | 0 | 156 | 0 |
| C | 0 | 156 | 0 |
| D | 0 | 156 | 0 |
| Mode M0 | |||
|---|---|---|---|
| Quadrant | BADHDUFLAG | Total packets | Discarded packets |
| A | 0 | 15995 | 2 |
| B | 0 | 23888 | 1 |
| C | 0 | 17108 | 1 |
| D | 0 | 17984 | 1 |
| Quadrant | Total seconds | Saturated seconds | Saturation percentage |
|---|---|---|---|
| A | 7743 | 284 | 3.667829% |
| B | 7743 | 429 | 5.540488% |
| C | 7743 | 463 | 5.979594% |
| D | 7743 | 260 | 3.357872% |
Noise dominated data is calculated using 1-second bins in cleaned event files. If a bin has >2000 counts, and if more than 50% of those come from <1% of pixels, then it is considered to be noise-dominated and hence unusable.
| Quadrant | # 1 sec bins | Bins with >0 counts | Bins with >2000 counts | High rate bins dominated by noise | Noise dominated (total time) | Noise dominated (detector-on time) | Marked lightcurve |
|---|---|---|---|---|---|---|---|
| A | 7768 | 7744 | 0 | 0 | 0.00% | 0.00% | 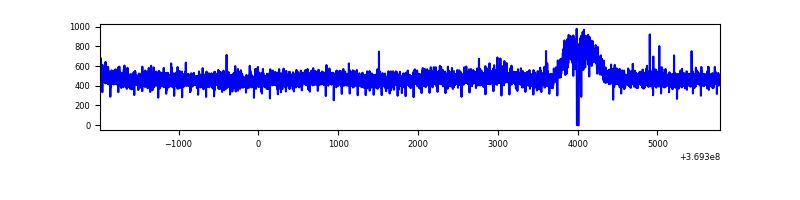 |
| B | 7768 | 7744 | 44 | 44 | 0.57% | 0.57% | 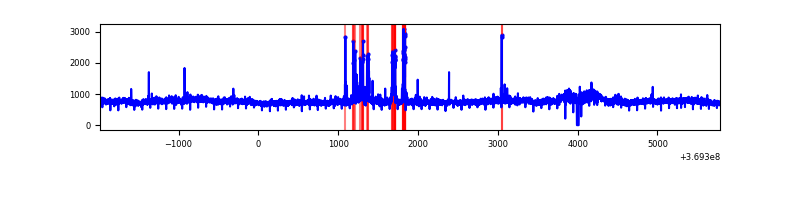 |
| C | 7768 | 7744 | 7 | 7 | 0.09% | 0.09% | 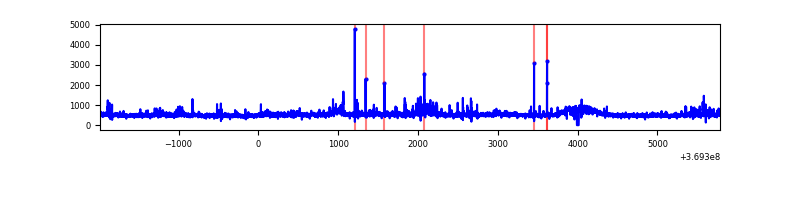 |
| D | 7768 | 7744 | 52 | 52 | 0.67% | 0.67% | 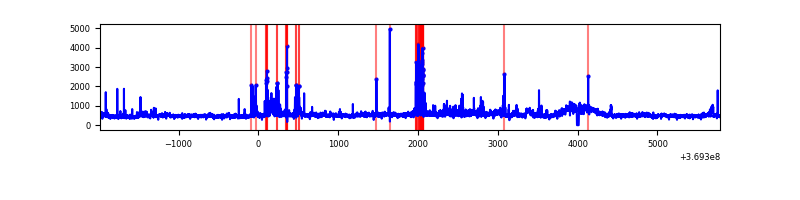 |
Top three noisy pixels from each quadrant. If the there are fewer than three noisy pixels in the level2.evt file, extra rows are filled as -1
| Pixel properties | Quadrant properties | ||||||
|---|---|---|---|---|---|---|---|
| Quadrant | DetID | PixID | Counts | Sigma | Mean | Median | Sigma |
| A | 13 | 254 | 15037 | 72.03 | 958 | 935 | 195.8 |
| A | 13 | 6 | 11541 | 54.17 | 958 | 935 | 195.8 |
| A | 3 | 137 | 10222 | 47.43 | 958 | 935 | 195.8 |
| B | 6 | 159 | 2070594 | 11281.34 | 944 | 918 | 183.5 |
| B | 5 | 172 | 142914 | 773.99 | 944 | 918 | 183.5 |
| B | 0 | 229 | 77266 | 416.16 | 944 | 918 | 183.5 |
| C | 3 | 233 | 251636 | 1165.67 | 917 | 924 | 215.1 |
| C | 14 | 238 | 205503 | 951.18 | 917 | 924 | 215.1 |
| C | 14 | 254 | 81034 | 372.47 | 917 | 924 | 215.1 |
| D | 8 | 195 | 543911 | 2430.86 | 926 | 899 | 223.4 |
| D | 2 | 120 | 99717 | 442.37 | 926 | 899 | 223.4 |
| D | 12 | 233 | 92454 | 409.86 | 926 | 899 | 223.4 |
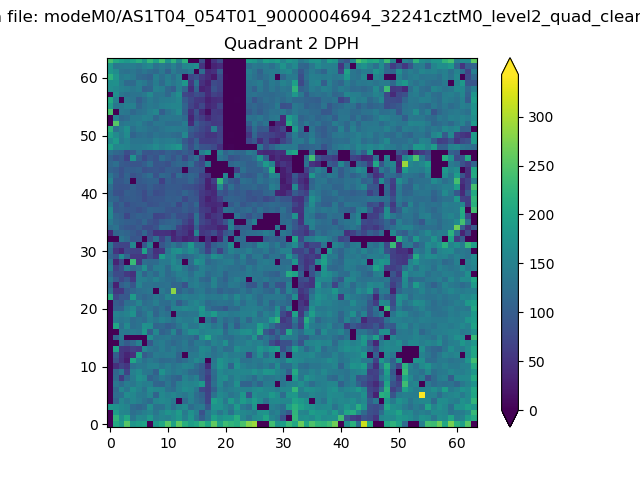
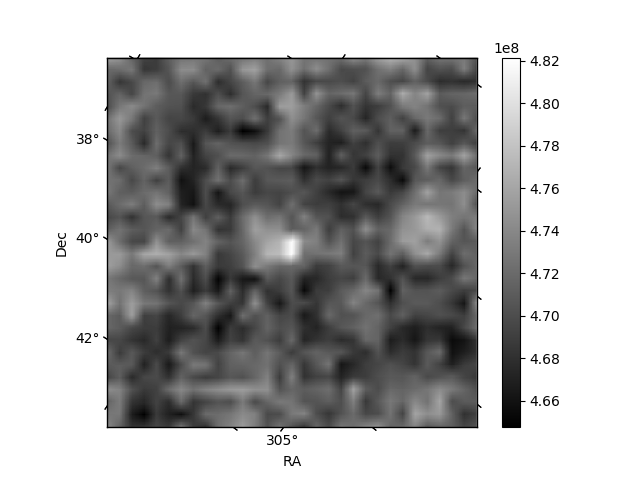
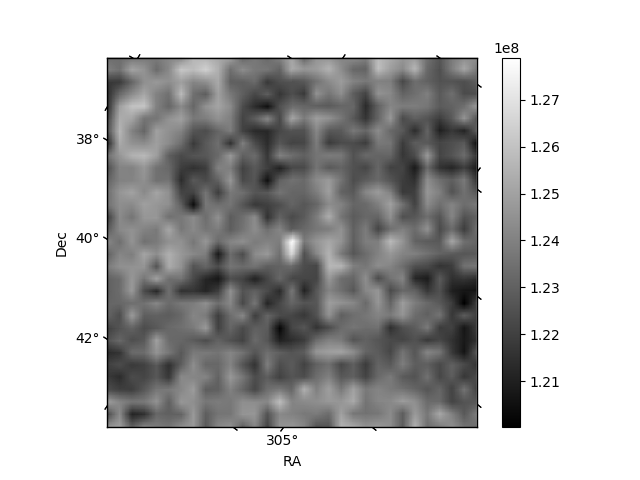
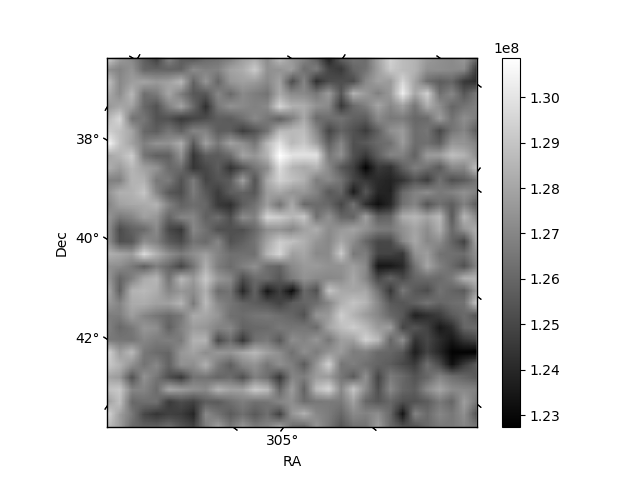
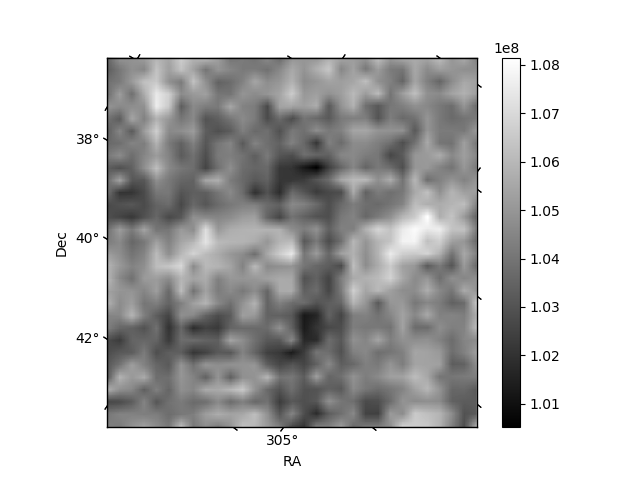
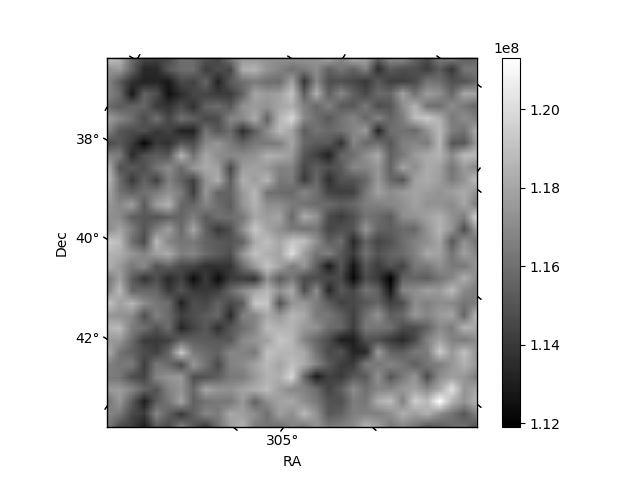
Histogram calculated using DETX and DETY for each event in the final _common_clean file
| Quadrant A | 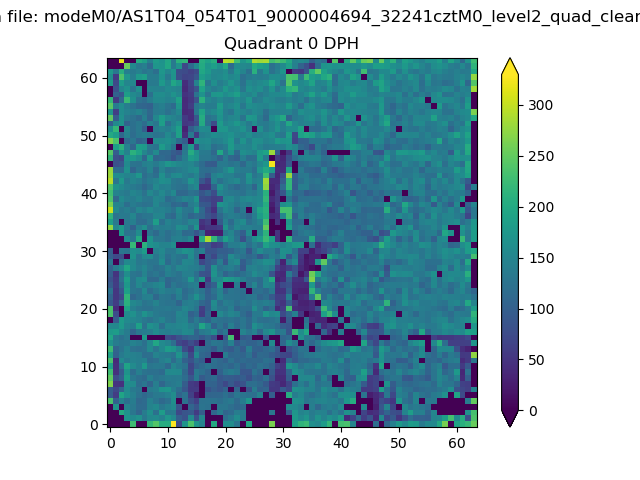 |
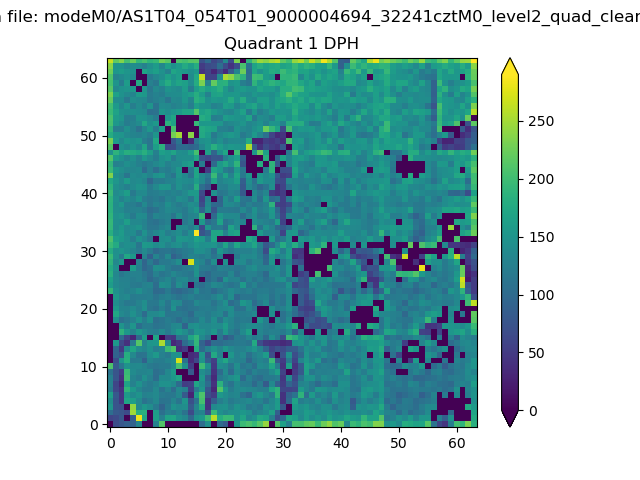 |
Quadrant B |
|---|---|---|---|
| Quadrant D | 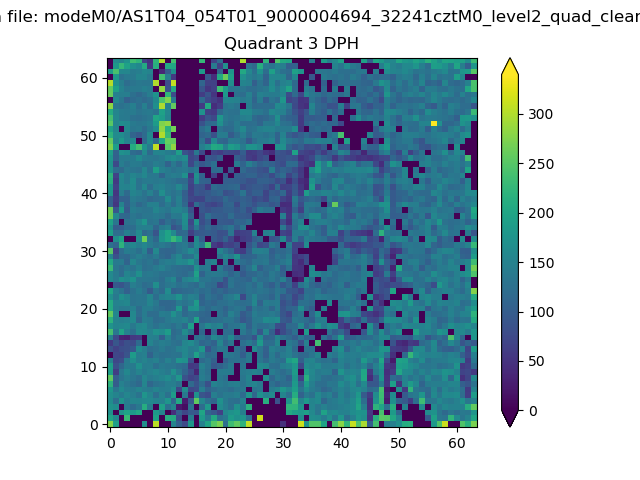 |
 |
Quadrant C |
| Plot type | Count rate plots | Images |
|---|---|---|
| Comparison with Poisson distribution Blue bars denote a histogram of data divided into 1 sec bins. Red curve is a Poisson curve with rate = median count rate of data. |
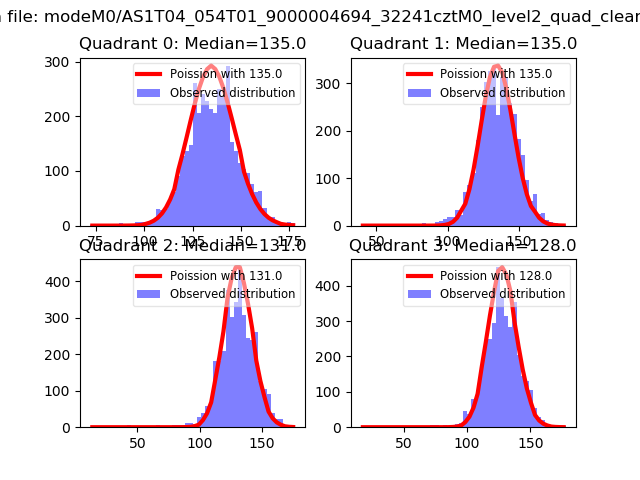 |
 |
| Quadrant-wise count rates Data is divided into 100 sec bins |
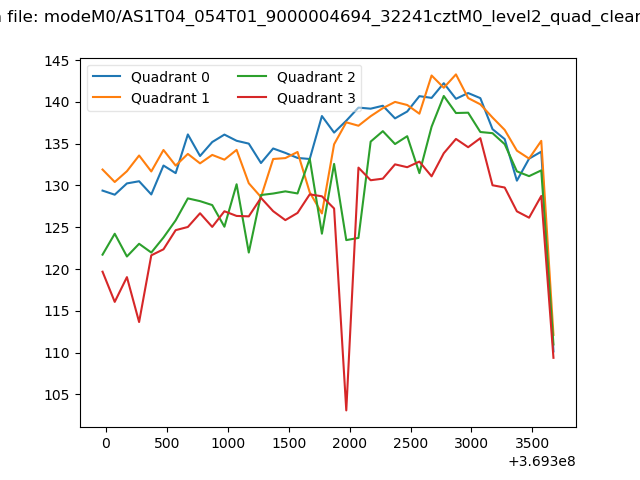 |
|
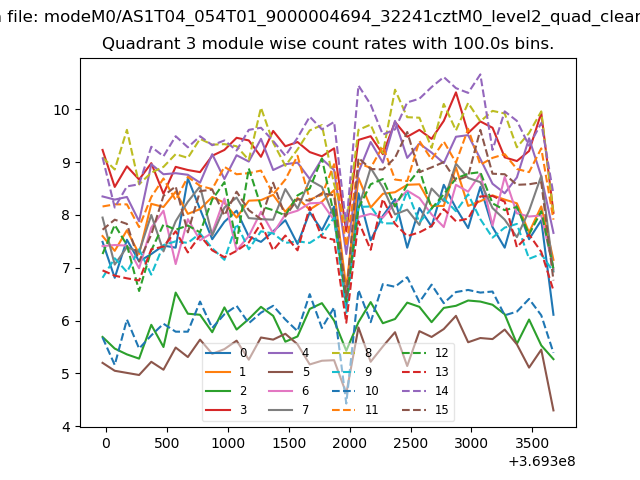
| Module-wise count rates for Quadrant A Data is divided into 100 sec bins |
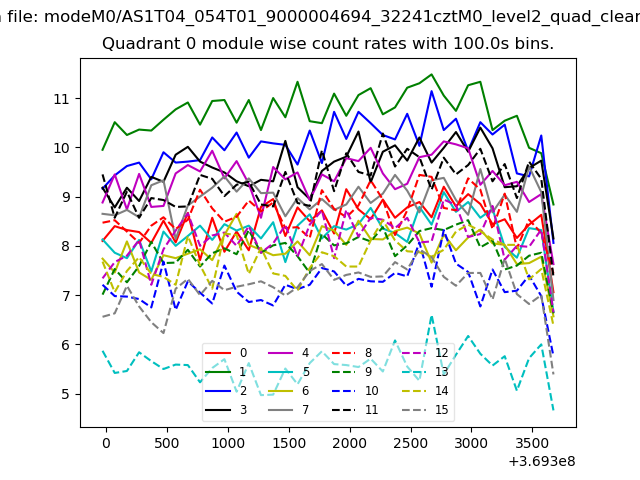 |
 |
| Module-wise count rates for Quadrant B Data is divided into 100 sec bins |
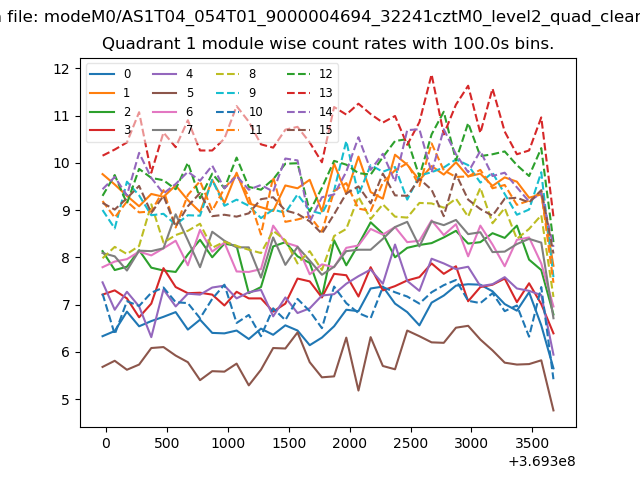 |
 |
| Module-wise count rates for Quadrant C Data is divided into 100 sec bins |
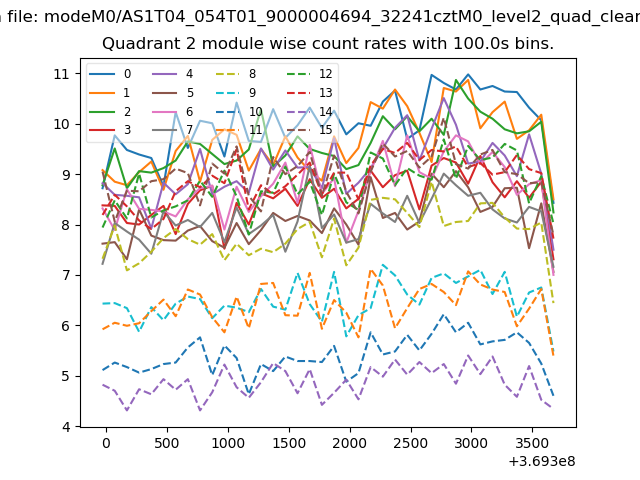 |
 |
| Module-wise count rates for Quadrant D Data is divided into 100 sec bins |
 |
 |
| Parameter | Plot |
|---|---|
| CZT HV Monitor | 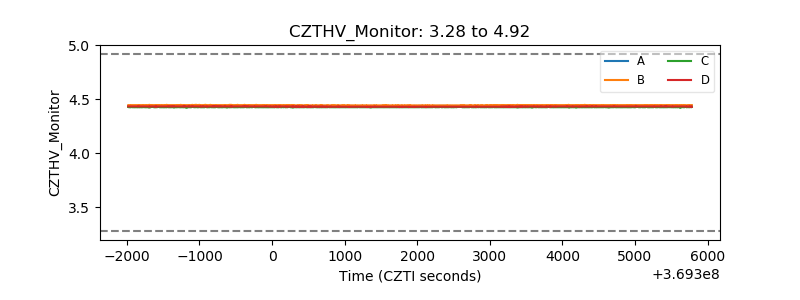 |
| D_VDD |  |
| Temperature 1 | 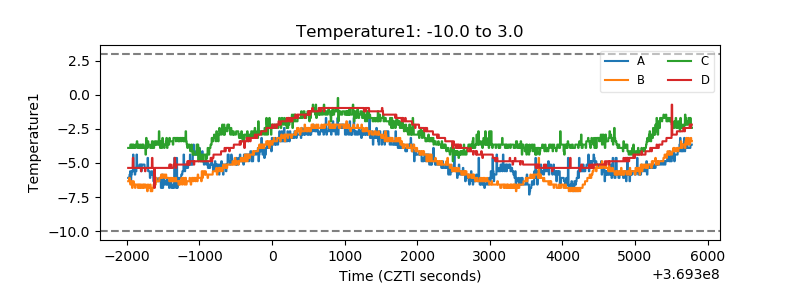 |
| Veto HV Monitor |  |
| Veto LLD | 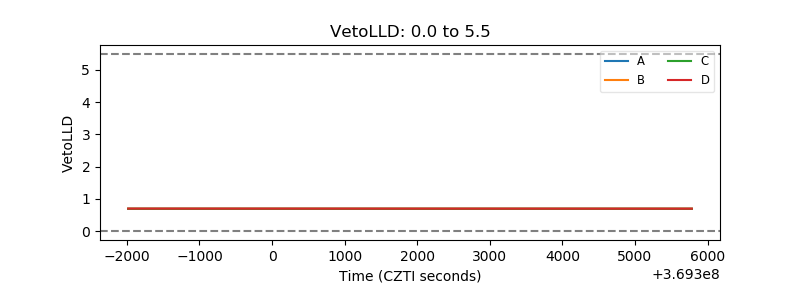 |
| Alpha Counter | 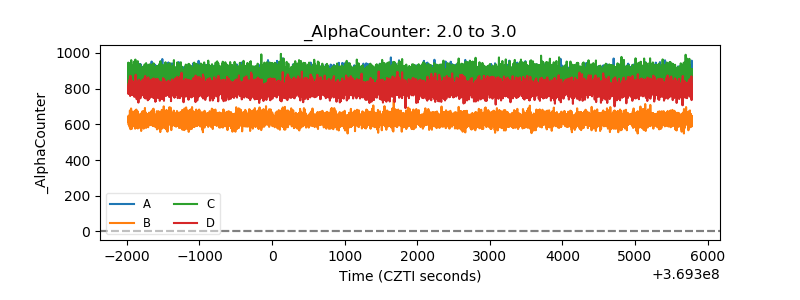 |
| _CPM_Rate | 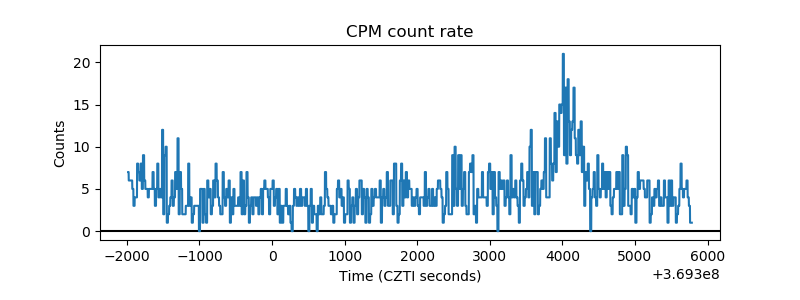 |
| CZT Counter | 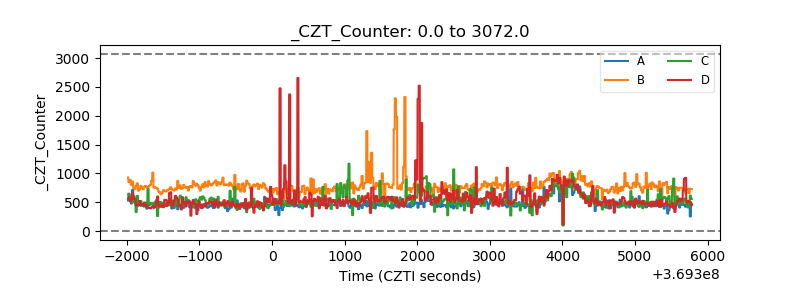 |
| +2.5 Volts monitor |  |
| +5 Volts monitor |  |
| _ROLL_ROT | 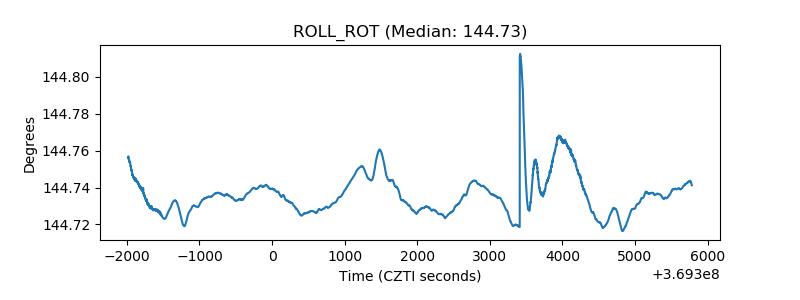 |
| _Roll_DEC |  |
| _Roll_RA | 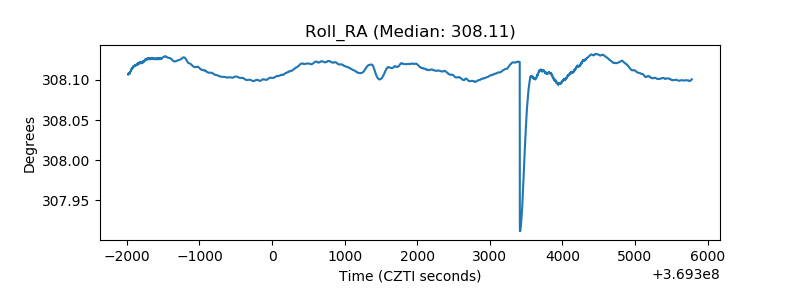 |
| Veto Counter | 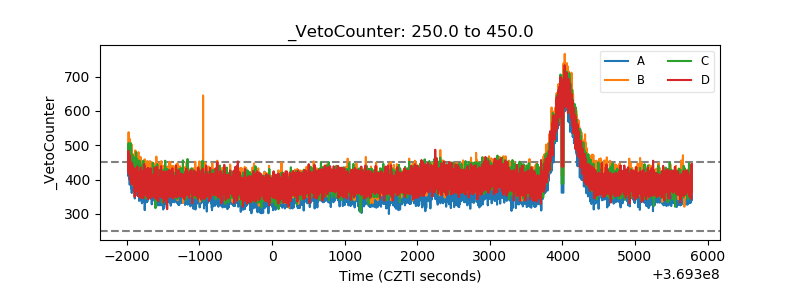 |