| Param | Original file | Final file |
|---|---|---|
| Filename | modeM0/AS1T04_054T01_9000004694_32242cztM0_level2.evt | modeM0/AS1T04_054T01_9000004694_32242cztM0_level2_quad_clean.evt |
| Size (bytes) | 745,395,840 | 93,142,080 |
| Size | 710.9 MB | 88.8 MB |
| Events in quadrant A | 4,022,709 | 584,982 |
| Events in quadrant B | 7,884,161 | 564,234 |
| Events in quadrant C | 4,526,463 | 557,611 |
| Events in quadrant D | 5,587,006 | 544,272 |
| Mode SS | |||
|---|---|---|---|
| Quadrant | BADHDUFLAG | Total packets | Discarded packets |
| A | 0 | 168 | 0 |
| B | 0 | 168 | 0 |
| C | 0 | 168 | 0 |
| D | 0 | 168 | 0 |
| Mode M0 | |||
|---|---|---|---|
| Quadrant | BADHDUFLAG | Total packets | Discarded packets |
| A | 0 | 17130 | 3 |
| B | 0 | 29320 | 2 |
| C | 0 | 18341 | 2 |
| D | 0 | 21860 | 2 |
| Mode M9 | |||
|---|---|---|---|
| Quadrant | BADHDUFLAG | Total packets | Discarded packets |
| A | 0 | 3 | 0 |
| B | 0 | 3 | 0 |
| C | 0 | 3 | 0 |
| D | 0 | 3 | 0 |
| Quadrant | Total seconds | Saturated seconds | Saturation percentage |
|---|---|---|---|
| A | 8184 | 400 | 4.887586% |
| B | 8184 | 928 | 11.339198% |
| C | 8184 | 699 | 8.541056% |
| D | 8184 | 352 | 4.301075% |
Noise dominated data is calculated using 1-second bins in cleaned event files. If a bin has >2000 counts, and if more than 50% of those come from <1% of pixels, then it is considered to be noise-dominated and hence unusable.
| Quadrant | # 1 sec bins | Bins with >0 counts | Bins with >2000 counts | High rate bins dominated by noise | Noise dominated (total time) | Noise dominated (detector-on time) | Marked lightcurve |
|---|---|---|---|---|---|---|---|
| A | 8518 | 8185 | 1 | 1 | 0.01% | 0.01% | 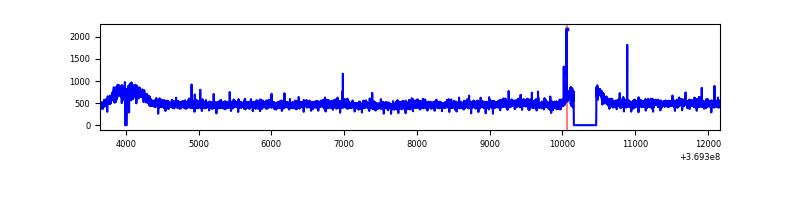 |
| B | 8519 | 8186 | 297 | 297 | 3.49% | 3.63% | 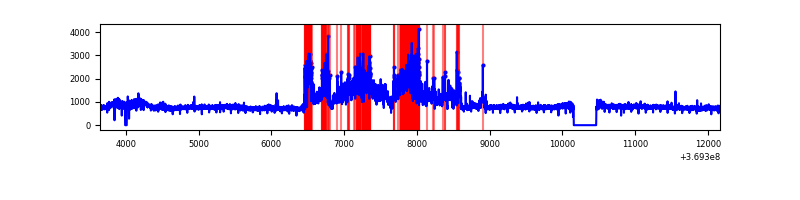 |
| C | 8518 | 8185 | 0 | 0 | 0.00% | 0.00% | 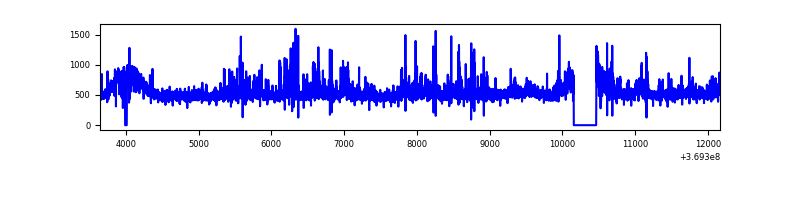 |
| D | 8519 | 8186 | 61 | 61 | 0.72% | 0.75% | 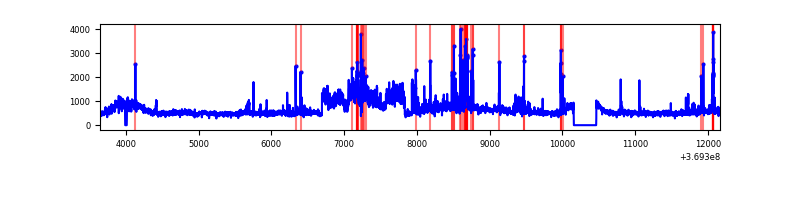 |
Top three noisy pixels from each quadrant. If the there are fewer than three noisy pixels in the level2.evt file, extra rows are filled as -1
| Pixel properties | Quadrant properties | ||||||
|---|---|---|---|---|---|---|---|
| Quadrant | DetID | PixID | Counts | Sigma | Mean | Median | Sigma |
| A | 12 | 96 | 20234 | 91.45 | 1029 | 1002 | 210.3 |
| A | 13 | 6 | 19781 | 89.3 | 1029 | 1002 | 210.3 |
| A | 13 | 254 | 15498 | 68.93 | 1029 | 1002 | 210.3 |
| B | 6 | 159 | 2155982 | 11054.38 | 1003 | 973 | 194.9 |
| B | 0 | 168 | 1556789 | 7980.75 | 1003 | 973 | 194.9 |
| B | 5 | 172 | 119894 | 610.02 | 1003 | 973 | 194.9 |
| C | 14 | 238 | 264696 | 1147.24 | 978 | 981 | 229.9 |
| C | 3 | 233 | 238272 | 1032.29 | 978 | 981 | 229.9 |
| C | 14 | 254 | 148770 | 642.93 | 978 | 981 | 229.9 |
| D | 8 | 195 | 1364265 | 5699.26 | 997 | 967 | 239.2 |
| D | 12 | 233 | 291703 | 1215.42 | 997 | 967 | 239.2 |
| D | 12 | 79 | 68333 | 281.62 | 997 | 967 | 239.2 |
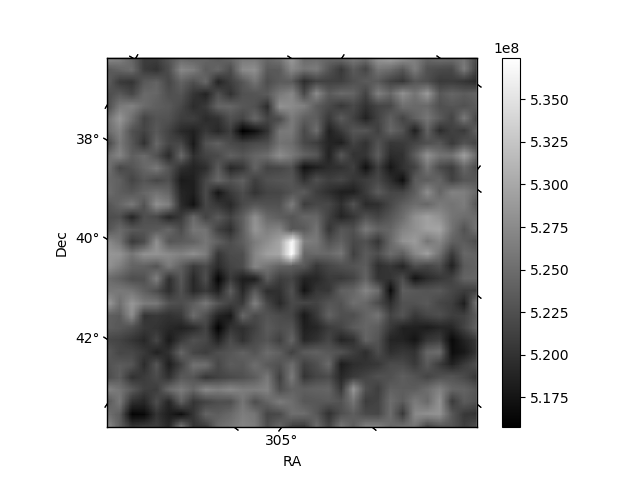
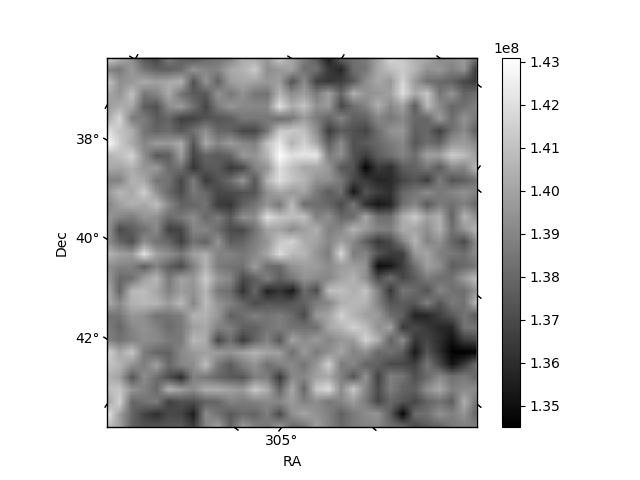
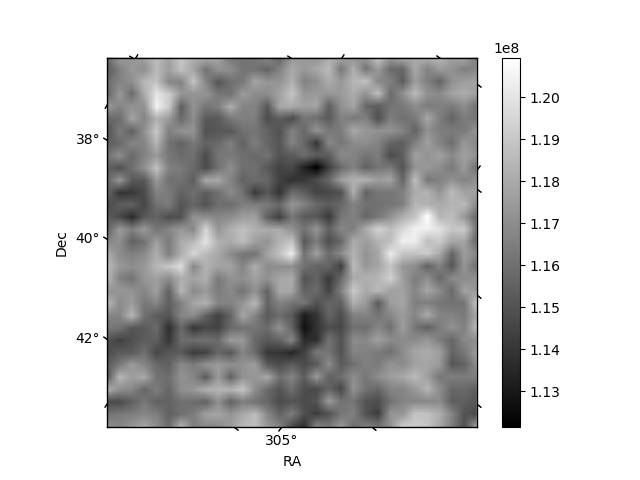
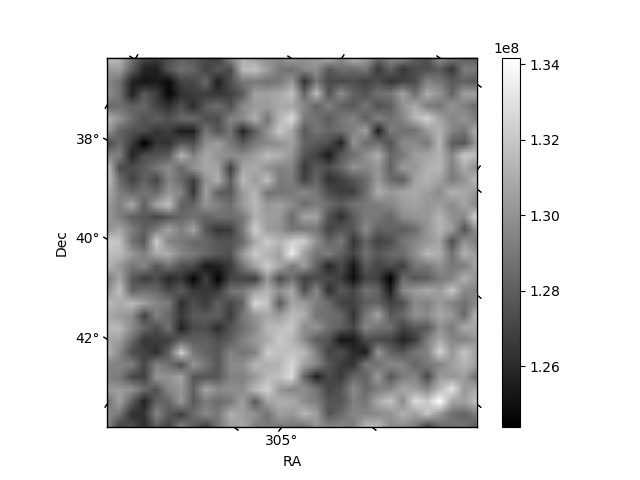
Histogram calculated using DETX and DETY for each event in the final _common_clean file
| Quadrant A | 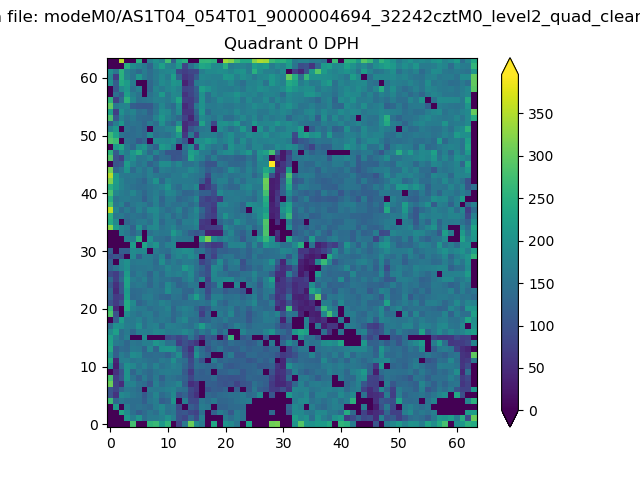 |
 |
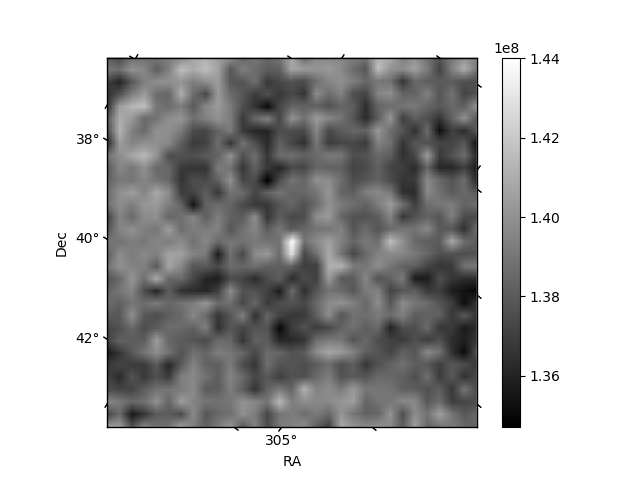
Quadrant B |
|---|---|---|---|
| Quadrant D | 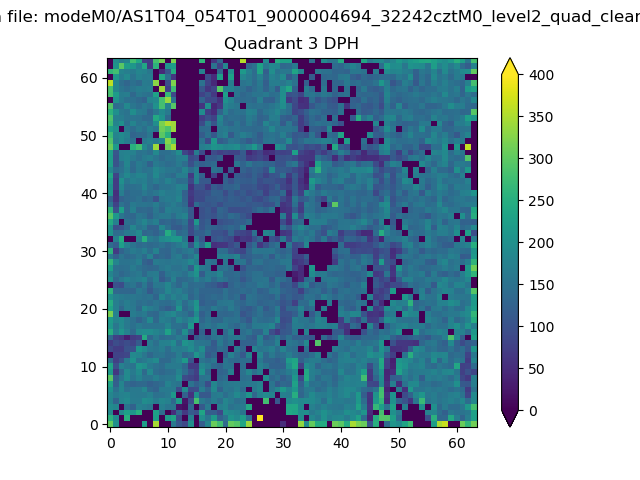 |
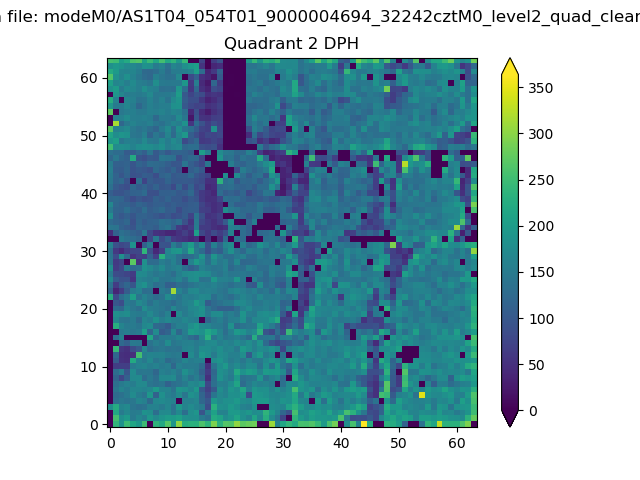 |
Quadrant C |
| Plot type | Count rate plots | Images |
|---|---|---|
| Comparison with Poisson distribution Blue bars denote a histogram of data divided into 1 sec bins. Red curve is a Poisson curve with rate = median count rate of data. |
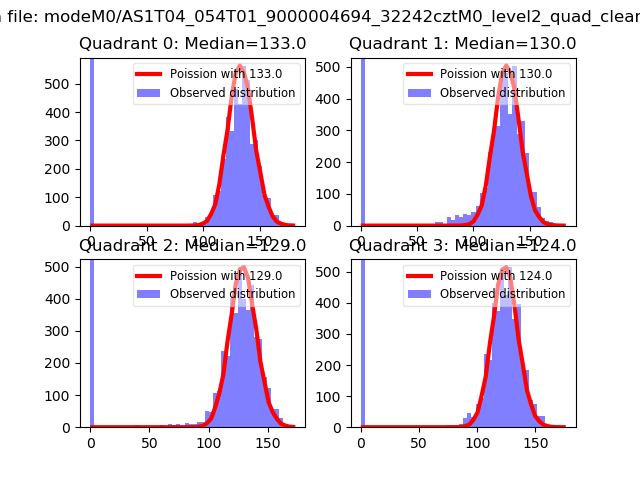 |
 |
| Quadrant-wise count rates Data is divided into 100 sec bins |
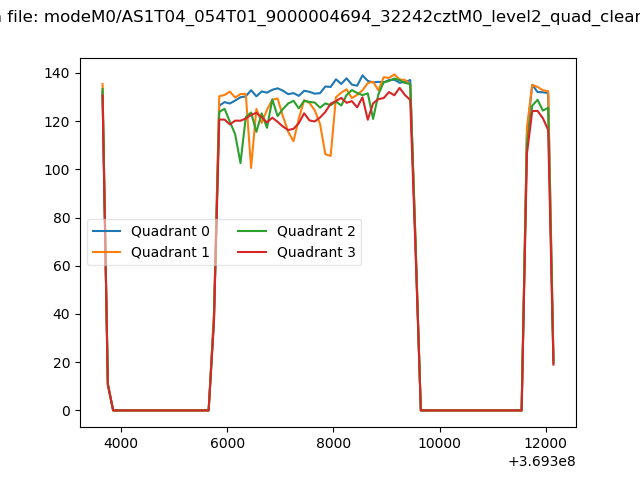 |
|
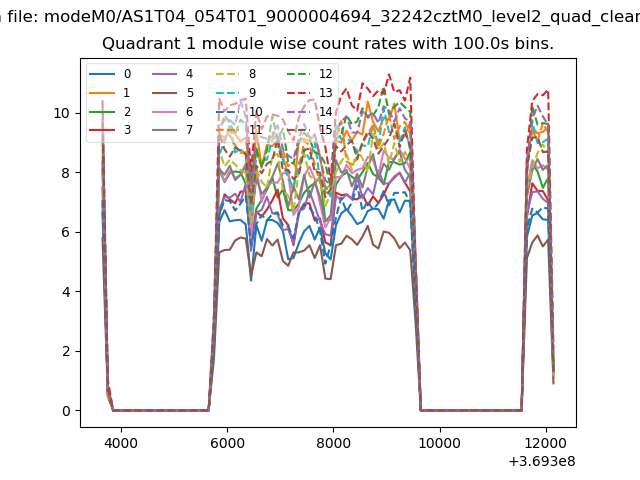
| Module-wise count rates for Quadrant A Data is divided into 100 sec bins |
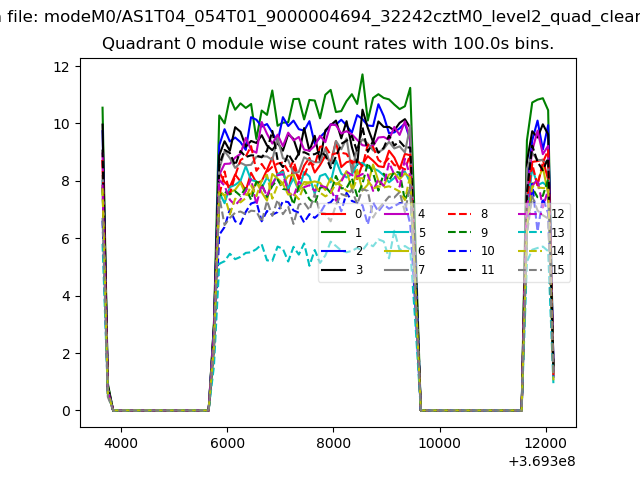 |
 |
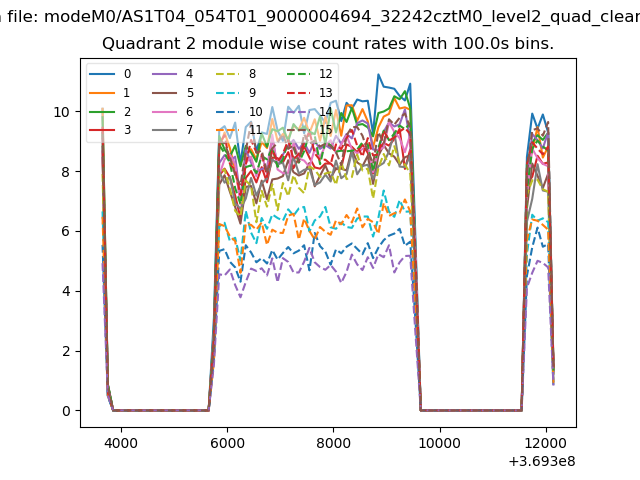
| Module-wise count rates for Quadrant B Data is divided into 100 sec bins |
 |
 |
| Module-wise count rates for Quadrant C Data is divided into 100 sec bins |
 |
 |
| Module-wise count rates for Quadrant D Data is divided into 100 sec bins |
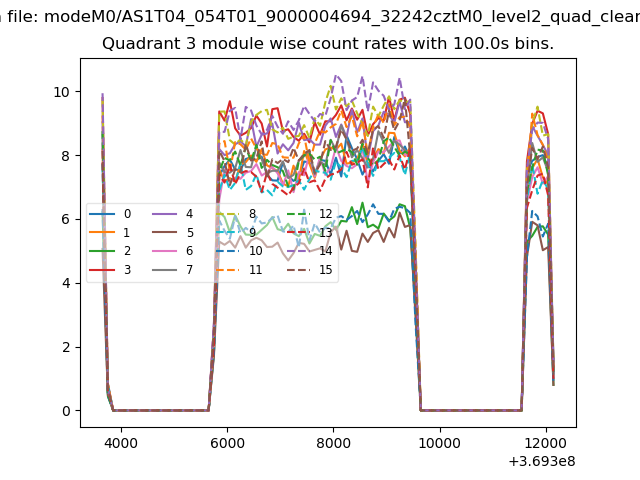 |
 |
| Parameter | Plot |
|---|---|
| CZT HV Monitor | 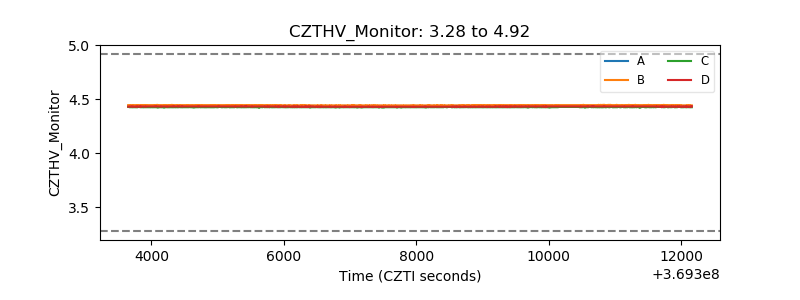 |
| D_VDD |  |
| Temperature 1 | 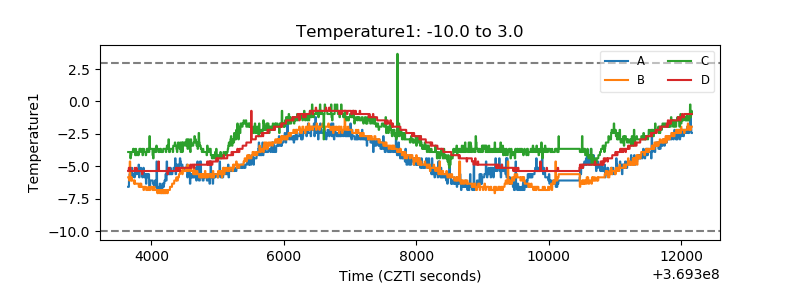 |
| Veto HV Monitor | 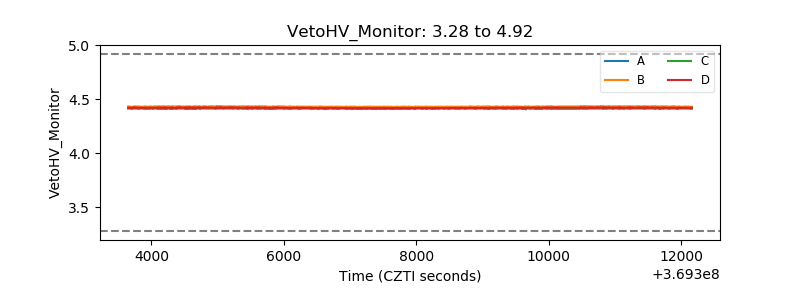 |
| Veto LLD | 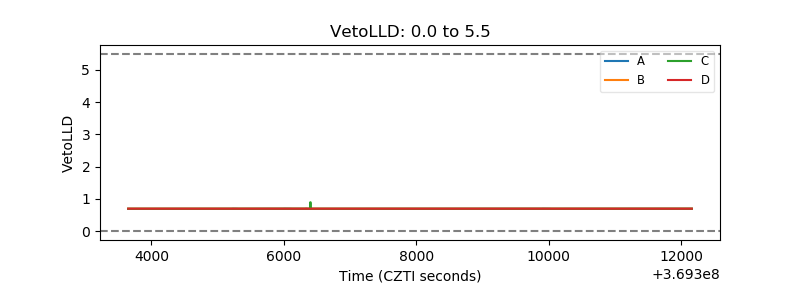 |
| Alpha Counter | 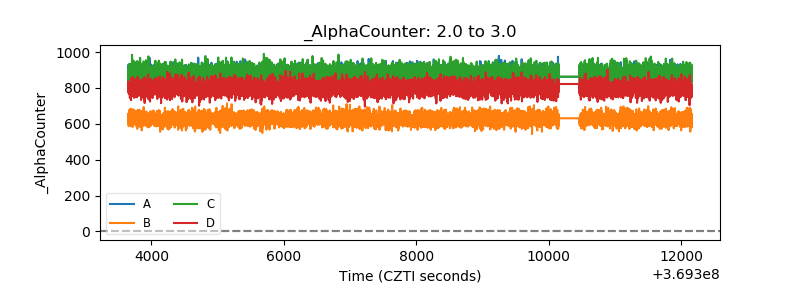 |
| _CPM_Rate | 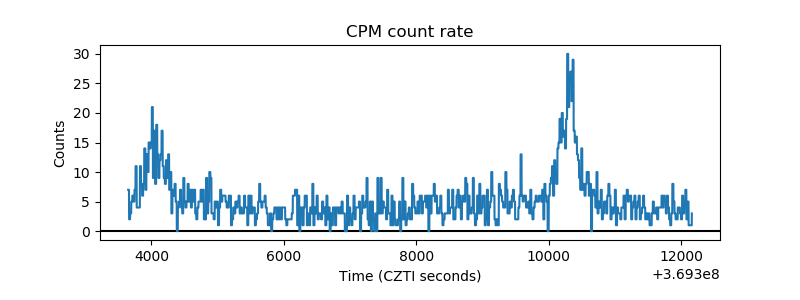 |
| CZT Counter | 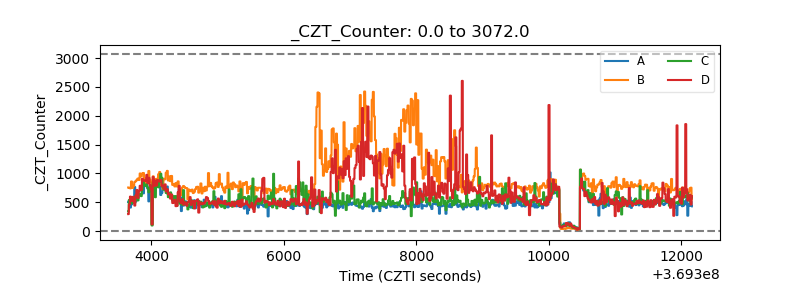 |
| +2.5 Volts monitor |  |
| +5 Volts monitor |  |
| _ROLL_ROT | 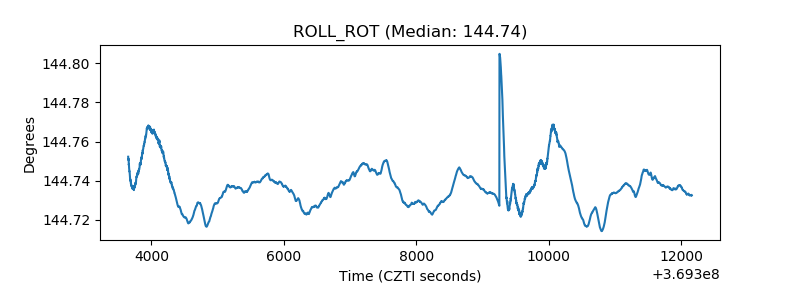 |
| _Roll_DEC | 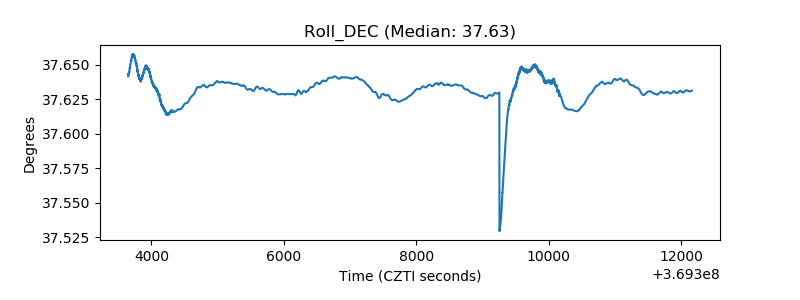 |
| _Roll_RA | 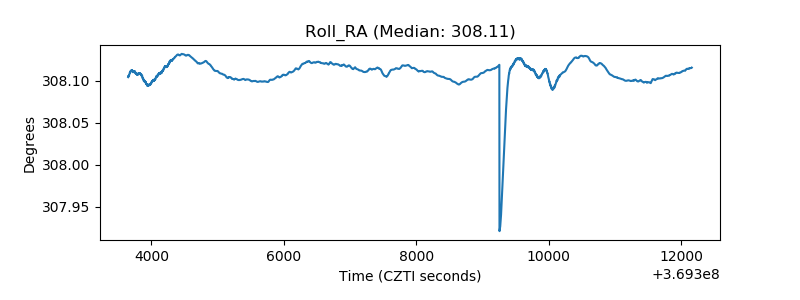 |
| Veto Counter | 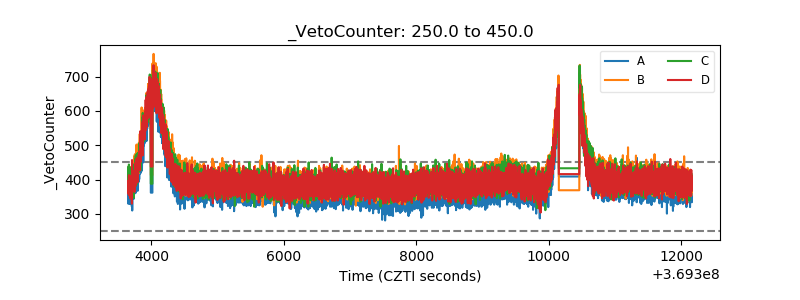 |