| Param | Original file | Final file |
|---|---|---|
| Filename | modeM0/AS1T04_054T01_9000004694_32245cztM0_level2.evt | modeM0/AS1T04_054T01_9000004694_32245cztM0_level2_quad_clean.evt |
| Size (bytes) | 625,608,000 | 105,575,040 |
| Size | 596.6 MB | 100.7 MB |
| Events in quadrant A | 3,261,137 | 710,011 |
| Events in quadrant B | 5,376,933 | 704,136 |
| Events in quadrant C | 4,722,504 | 661,015 |
| Events in quadrant D | 5,130,197 | 653,097 |
| Mode SS | |||
|---|---|---|---|
| Quadrant | BADHDUFLAG | Total packets | Discarded packets |
| A | 0 | 138 | 0 |
| B | 0 | 138 | 0 |
| C | 0 | 138 | 0 |
| D | 0 | 138 | 0 |
| Mode M0 | |||
|---|---|---|---|
| Quadrant | BADHDUFLAG | Total packets | Discarded packets |
| A | 0 | 13996 | 2 |
| B | 0 | 20796 | 1 |
| C | 0 | 18869 | 1 |
| D | 0 | 19737 | 1 |
| Mode M9 | |||
|---|---|---|---|
| Quadrant | BADHDUFLAG | Total packets | Discarded packets |
| A | 0 | 8 | 0 |
| B | 0 | 8 | 0 |
| C | 0 | 8 | 0 |
| D | 0 | 8 | 0 |
| Quadrant | Total seconds | Saturated seconds | Saturation percentage |
|---|---|---|---|
| A | 6723 | 57 | 0.847836% |
| B | 6723 | 142 | 2.112152% |
| C | 6723 | 1524 | 22.668452% |
| D | 6723 | 194 | 2.885617% |
Noise dominated data is calculated using 1-second bins in cleaned event files. If a bin has >2000 counts, and if more than 50% of those come from <1% of pixels, then it is considered to be noise-dominated and hence unusable.
| Quadrant | # 1 sec bins | Bins with >0 counts | Bins with >2000 counts | High rate bins dominated by noise | Noise dominated (total time) | Noise dominated (detector-on time) | Marked lightcurve |
|---|---|---|---|---|---|---|---|
| A | 7583 | 6724 | 0 | 0 | 0.00% | 0.00% | 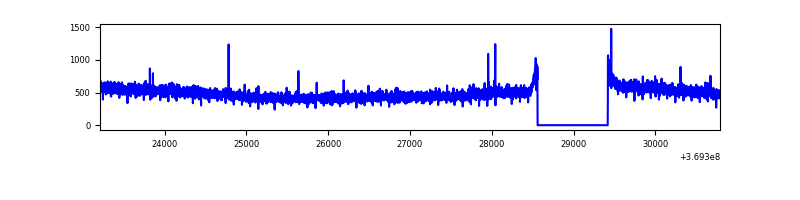 |
| B | 7583 | 6724 | 33 | 33 | 0.44% | 0.49% | 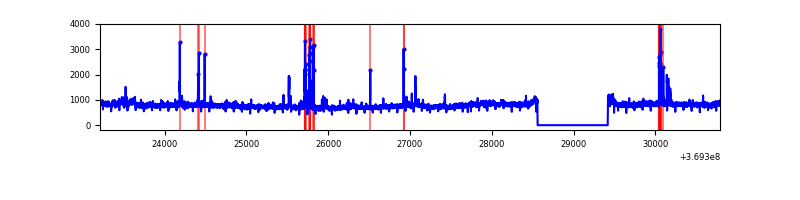 |
| C | 7583 | 6723 | 31 | 31 | 0.41% | 0.46% | 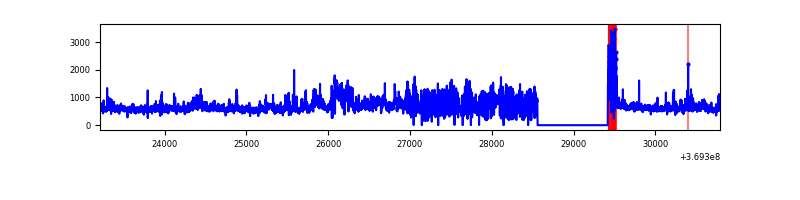 |
| D | 7583 | 6724 | 85 | 85 | 1.12% | 1.26% | 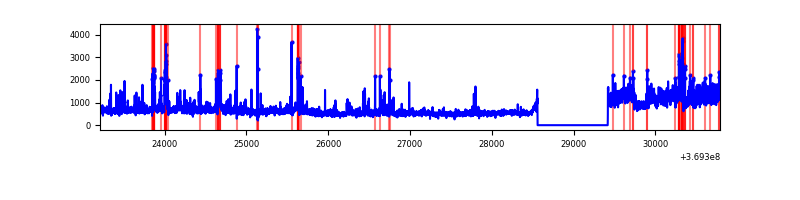 |
Top three noisy pixels from each quadrant. If the there are fewer than three noisy pixels in the level2.evt file, extra rows are filled as -1
| Pixel properties | Quadrant properties | ||||||
|---|---|---|---|---|---|---|---|
| Quadrant | DetID | PixID | Counts | Sigma | Mean | Median | Sigma |
| A | 13 | 254 | 13575 | 75.71 | 839 | 822 | 168.4 |
| A | 13 | 6 | 13175 | 73.34 | 839 | 822 | 168.4 |
| A | 3 | 137 | 8708 | 46.82 | 839 | 822 | 168.4 |
| B | 6 | 159 | 1845133 | 11611.97 | 824 | 803 | 158.8 |
| B | 5 | 172 | 126125 | 789.03 | 824 | 803 | 158.8 |
| B | 0 | 229 | 67639 | 420.8 | 824 | 803 | 158.8 |
| C | 0 | 10 | 754335 | 4650.11 | 687 | 691 | 162.1 |
| C | 14 | 254 | 443576 | 2732.67 | 687 | 691 | 162.1 |
| C | 14 | 238 | 421425 | 2596.0 | 687 | 691 | 162.1 |
| D | 8 | 195 | 1513888 | 7803.77 | 809 | 787 | 193.9 |
| D | 12 | 233 | 365630 | 1881.66 | 809 | 787 | 193.9 |
| D | 2 | 250 | 92587 | 473.46 | 809 | 787 | 193.9 |
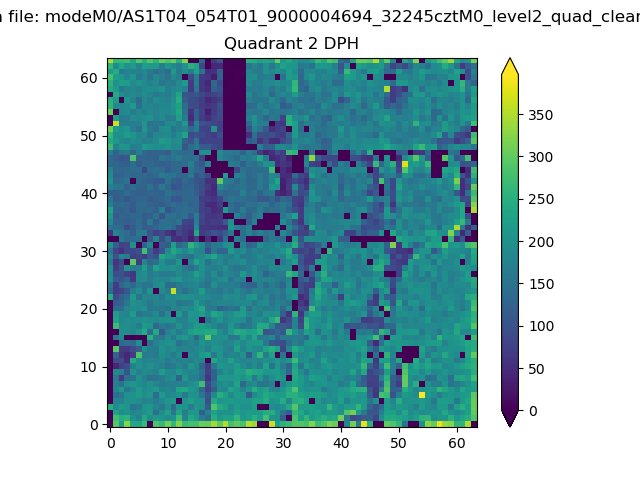
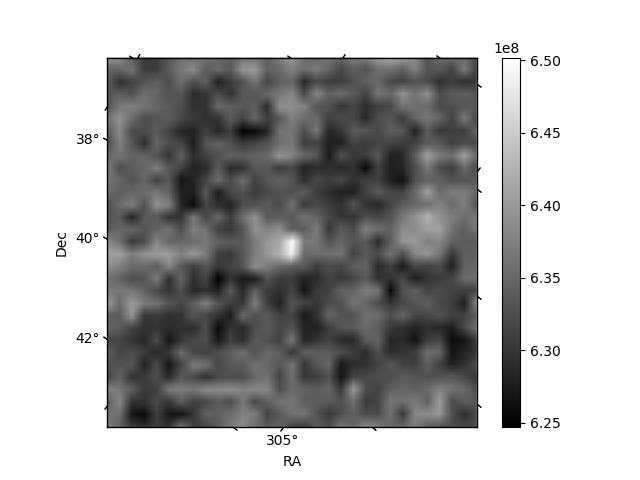
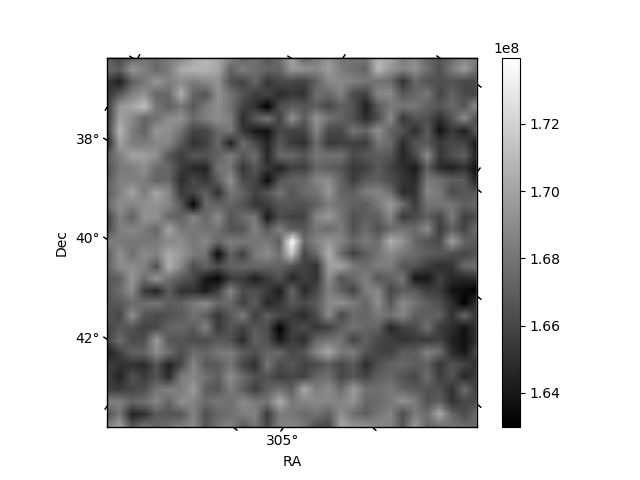
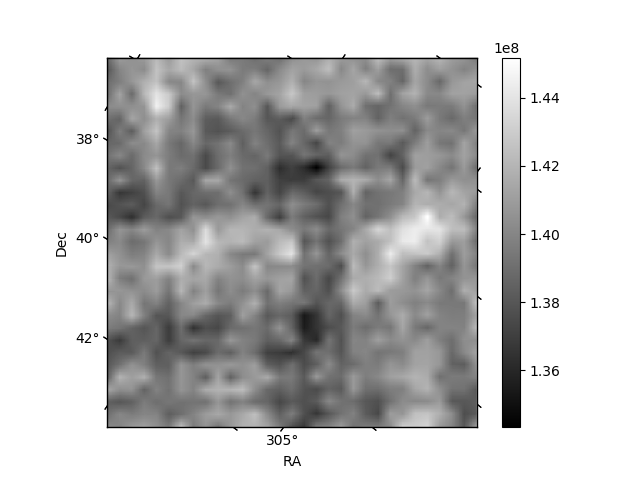
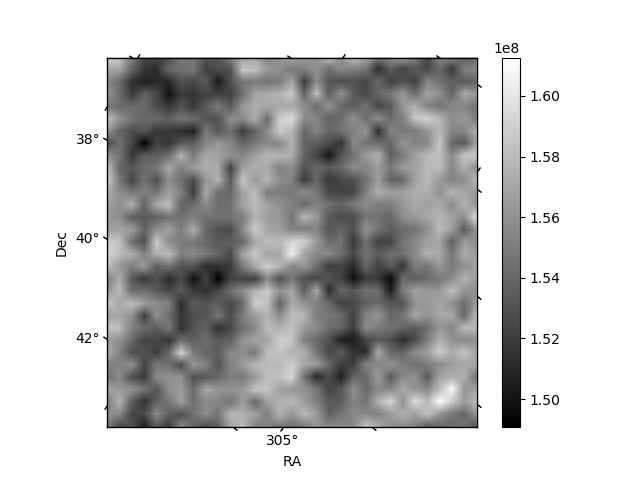
Histogram calculated using DETX and DETY for each event in the final _common_clean file
| Quadrant A | 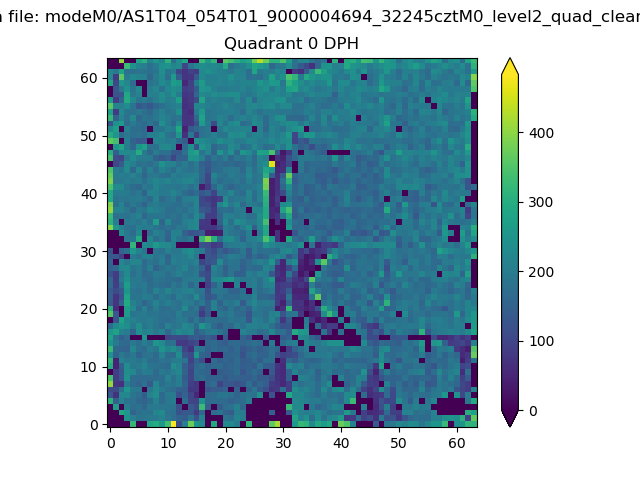 |
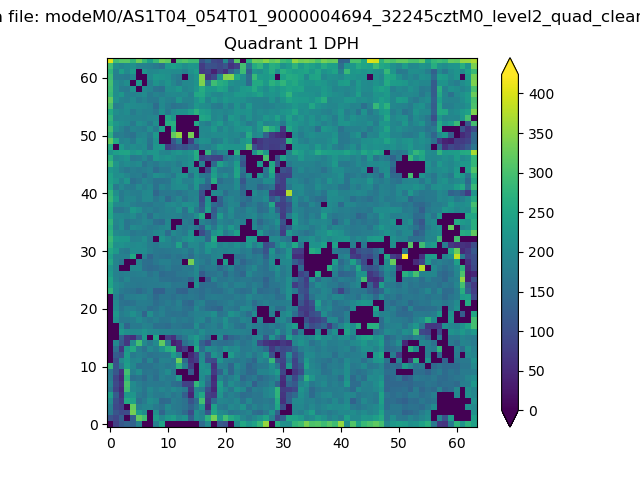 |
Quadrant B |
|---|---|---|---|
| Quadrant D | 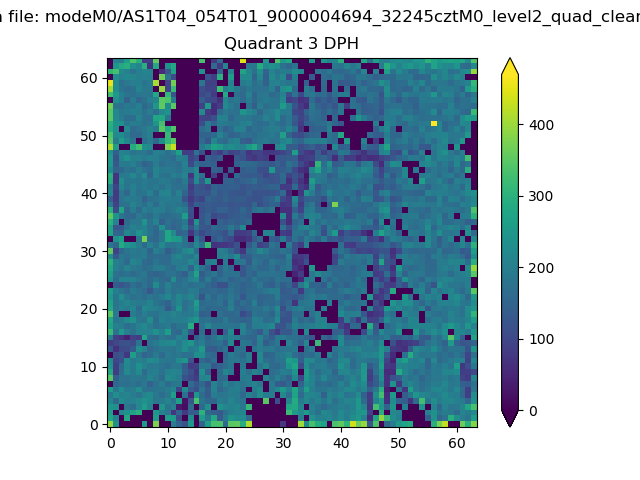 |
 |
Quadrant C |
| Plot type | Count rate plots | Images |
|---|---|---|
| Comparison with Poisson distribution Blue bars denote a histogram of data divided into 1 sec bins. Red curve is a Poisson curve with rate = median count rate of data. |
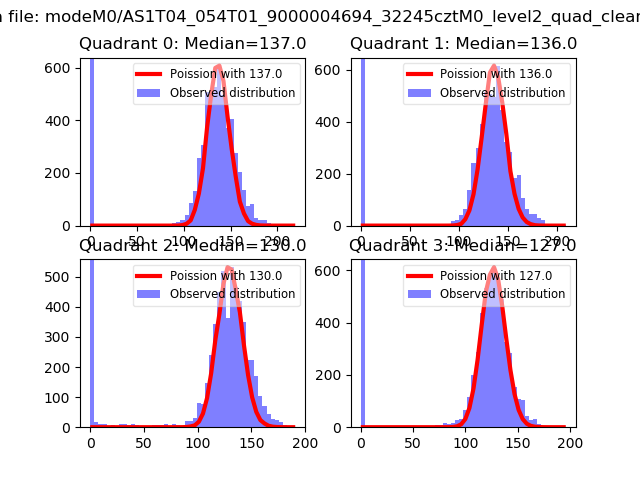 |
 |
| Quadrant-wise count rates Data is divided into 100 sec bins |
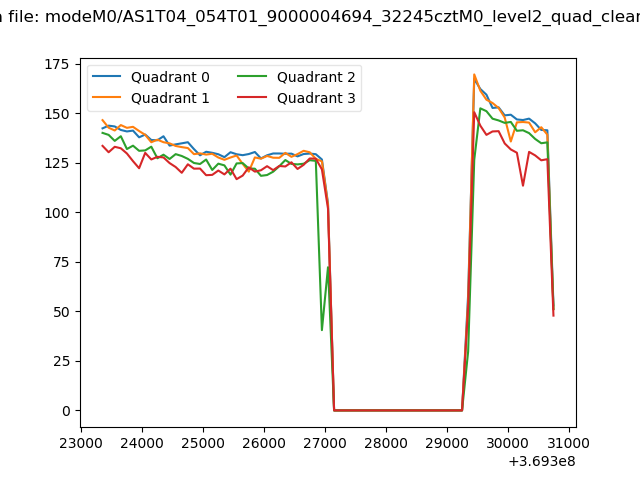 |
|
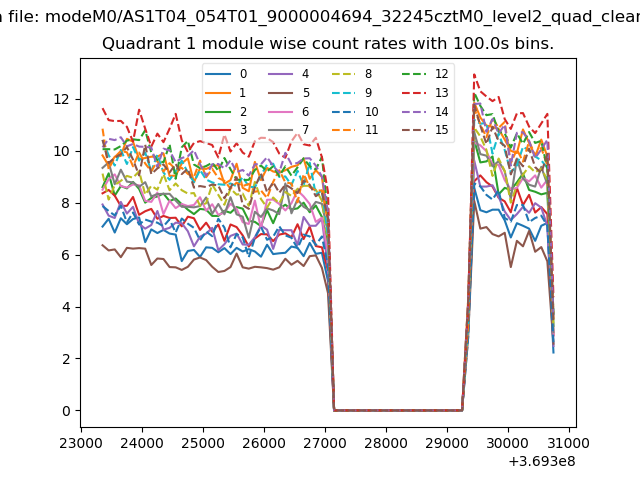
| Module-wise count rates for Quadrant A Data is divided into 100 sec bins |
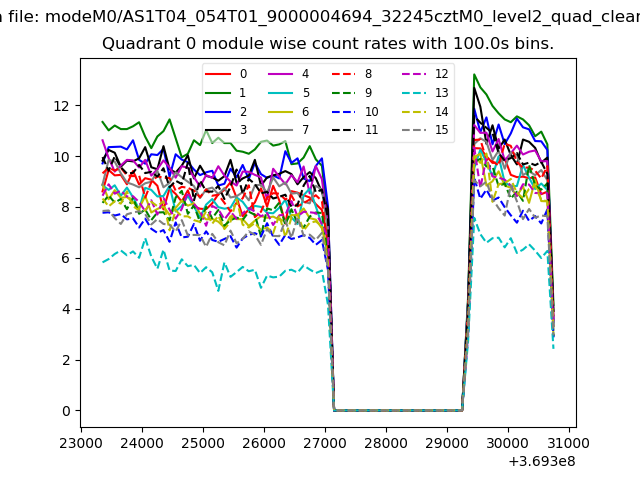 |
 |
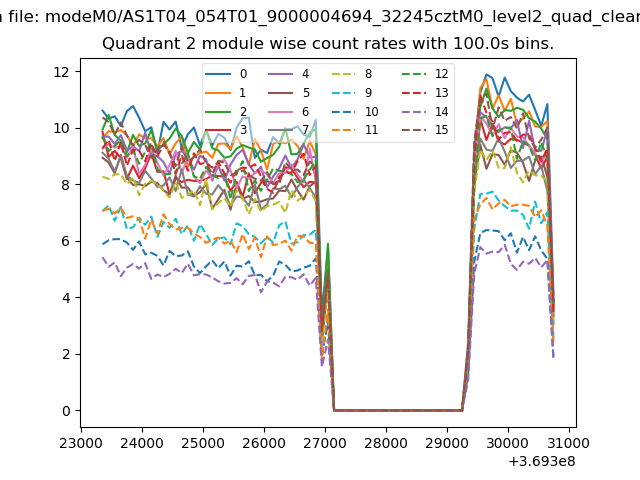
| Module-wise count rates for Quadrant B Data is divided into 100 sec bins |
 |
 |
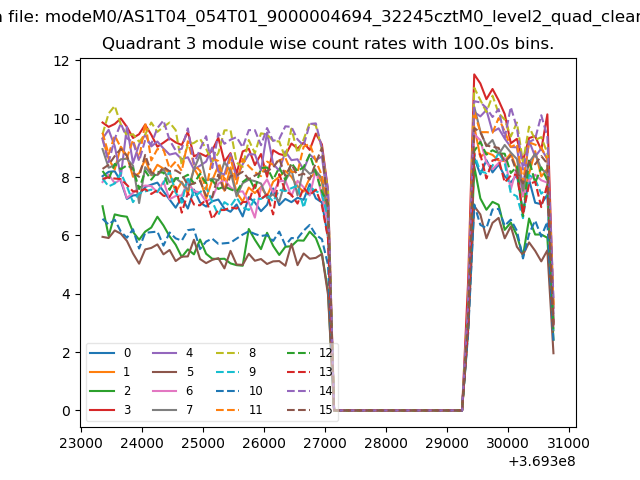
| Module-wise count rates for Quadrant C Data is divided into 100 sec bins |
 |
 |
| Module-wise count rates for Quadrant D Data is divided into 100 sec bins |
 |
 |
| Parameter | Plot |
|---|---|
| CZT HV Monitor | 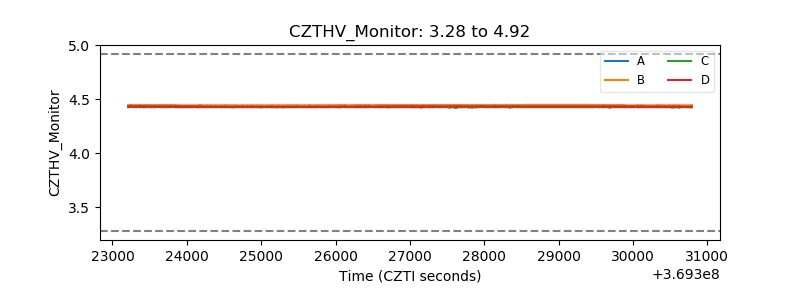 |
| D_VDD | 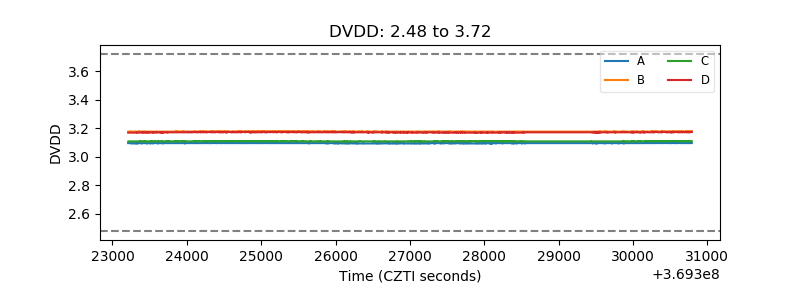 |
| Temperature 1 |  |
| Veto HV Monitor | 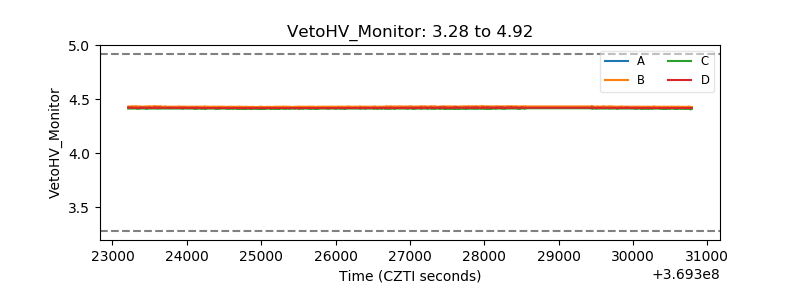 |
| Veto LLD | 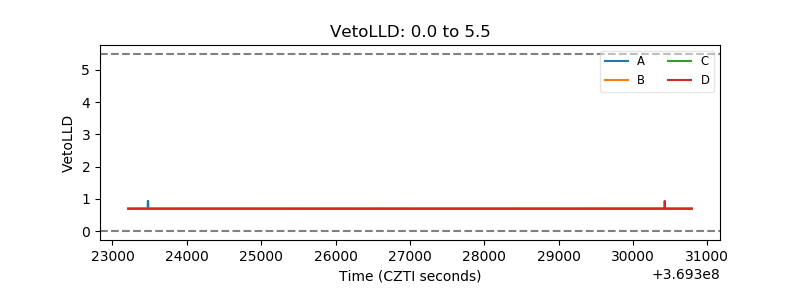 |
| Alpha Counter | 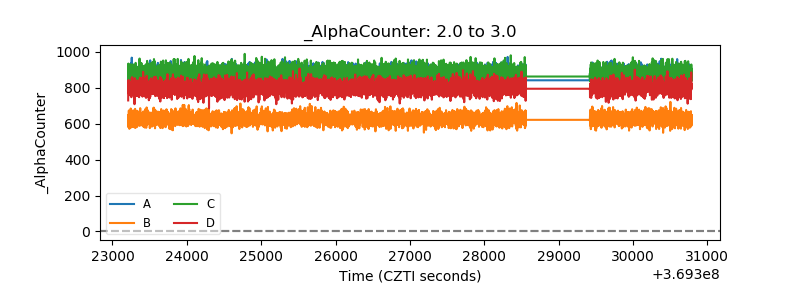 |
| _CPM_Rate | 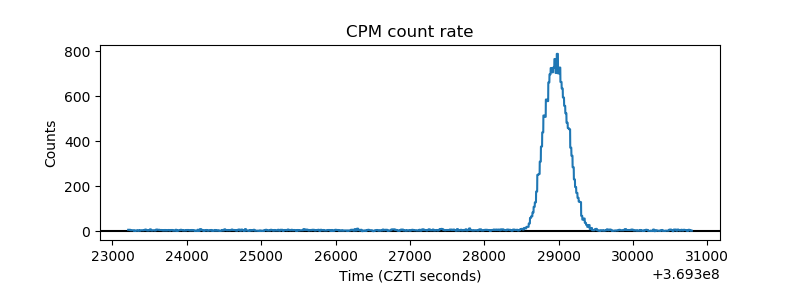 |
| CZT Counter | 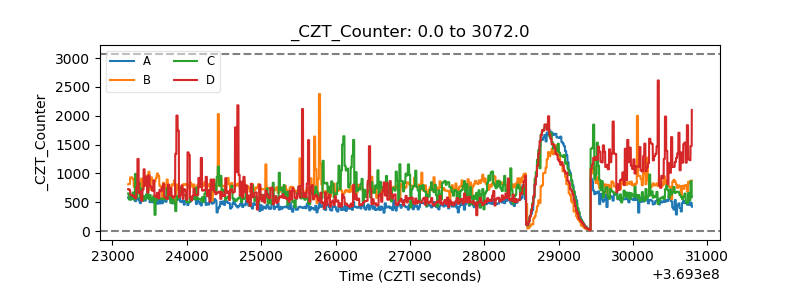 |
| +2.5 Volts monitor |  |
| +5 Volts monitor |  |
| _ROLL_ROT | 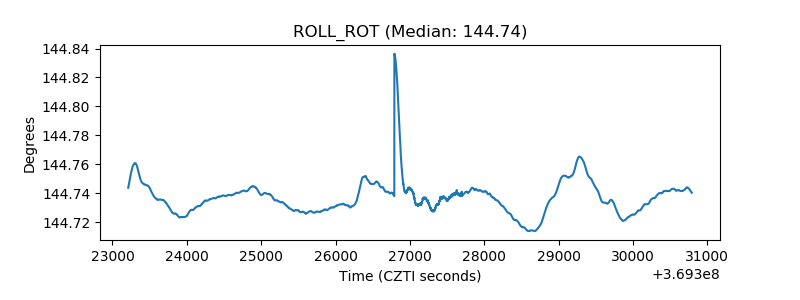 |
| _Roll_DEC | 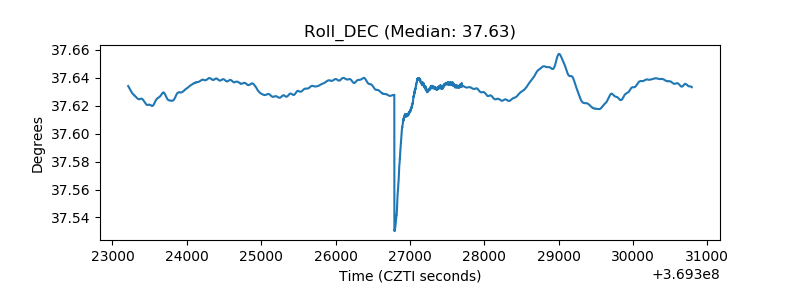 |
| _Roll_RA | 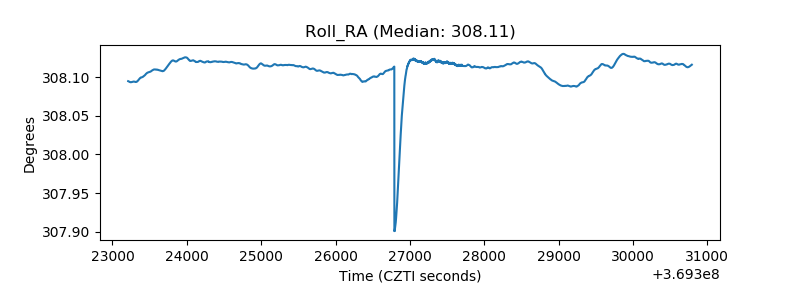 |
| Veto Counter | 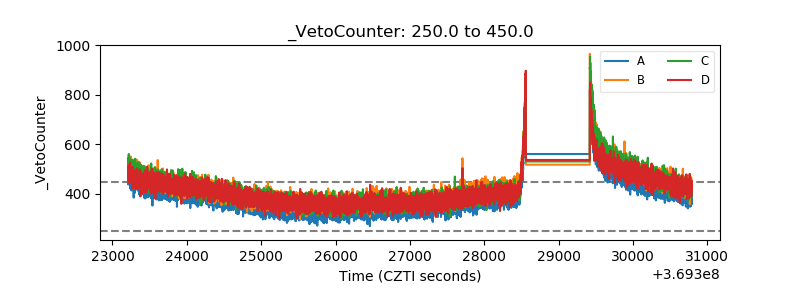 |