| Param | Original file | Final file |
|---|---|---|
| Filename | modeM0/AS1T04_054T01_9000004694_32248cztM0_level2.evt | modeM0/AS1T04_054T01_9000004694_32248cztM0_level2_quad_clean.evt |
| Size (bytes) | 663,131,520 | 100,975,680 |
| Size | 632.4 MB | 96.3 MB |
| Events in quadrant A | 3,352,129 | 679,213 |
| Events in quadrant B | 5,406,472 | 680,106 |
| Events in quadrant C | 4,002,597 | 648,291 |
| Events in quadrant D | 6,888,262 | 602,115 |
| Mode SS | |||
|---|---|---|---|
| Quadrant | BADHDUFLAG | Total packets | Discarded packets |
| A | 0 | 130 | 0 |
| B | 0 | 130 | 0 |
| C | 0 | 130 | 0 |
| D | 0 | 130 | 0 |
| Mode M0 | |||
|---|---|---|---|
| Quadrant | BADHDUFLAG | Total packets | Discarded packets |
| A | 0 | 14269 | 3 |
| B | 0 | 20399 | 2 |
| C | 0 | 16038 | 2 |
| D | 0 | 24784 | 2 |
| Mode M9 | |||
|---|---|---|---|
| Quadrant | BADHDUFLAG | Total packets | Discarded packets |
| A | 0 | 12 | 0 |
| B | 0 | 12 | 0 |
| C | 0 | 12 | 0 |
| D | 0 | 13 | 0 |
| Quadrant | Total seconds | Saturated seconds | Saturation percentage |
|---|---|---|---|
| A | 6424 | 47 | 0.731631% |
| B | 6424 | 139 | 2.163761% |
| C | 6424 | 277 | 4.311955% |
| D | 6424 | 670 | 10.429639% |
Noise dominated data is calculated using 1-second bins in cleaned event files. If a bin has >2000 counts, and if more than 50% of those come from <1% of pixels, then it is considered to be noise-dominated and hence unusable.
| Quadrant | # 1 sec bins | Bins with >0 counts | Bins with >2000 counts | High rate bins dominated by noise | Noise dominated (total time) | Noise dominated (detector-on time) | Marked lightcurve |
|---|---|---|---|---|---|---|---|
| A | 7584 | 6425 | 4 | 4 | 0.05% | 0.06% | 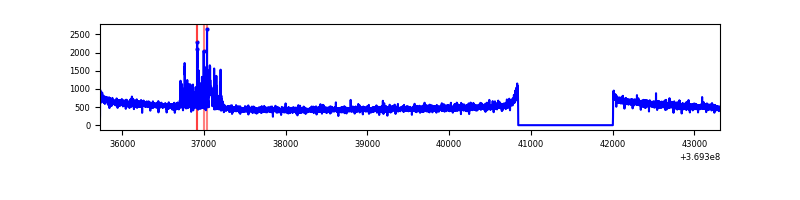 |
| B | 7584 | 6425 | 28 | 28 | 0.37% | 0.44% | 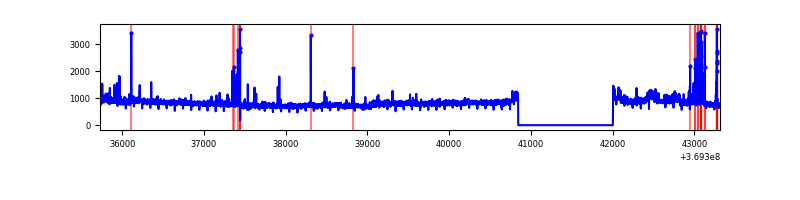 |
| C | 7584 | 6425 | 91 | 91 | 1.20% | 1.42% | 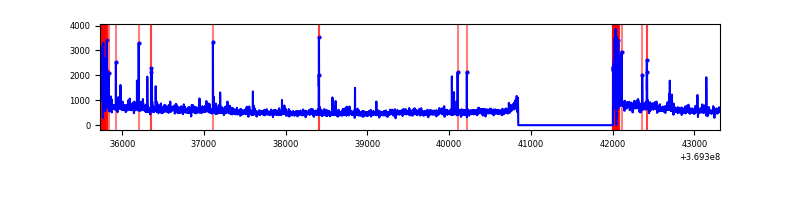 |
| D | 7584 | 6425 | 559 | 559 | 7.37% | 8.70% | 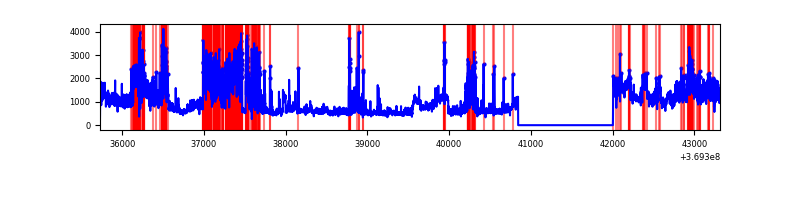 |
Top three noisy pixels from each quadrant. If the there are fewer than three noisy pixels in the level2.evt file, extra rows are filled as -1
| Pixel properties | Quadrant properties | ||||||
|---|---|---|---|---|---|---|---|
| Quadrant | DetID | PixID | Counts | Sigma | Mean | Median | Sigma |
| A | 0 | 6 | 137361 | 829.28 | 828 | 814 | 164.7 |
| A | 0 | 226 | 17924 | 103.91 | 828 | 814 | 164.7 |
| A | 13 | 254 | 13140 | 74.86 | 828 | 814 | 164.7 |
| B | 6 | 159 | 1855979 | 12043.53 | 822 | 801 | 154.0 |
| B | 5 | 172 | 147477 | 952.2 | 822 | 801 | 154.0 |
| B | 0 | 229 | 111980 | 721.76 | 822 | 801 | 154.0 |
| C | 0 | 10 | 402000 | 2171.72 | 793 | 799 | 184.7 |
| C | 3 | 233 | 323739 | 1748.09 | 793 | 799 | 184.7 |
| C | 14 | 238 | 129836 | 698.48 | 793 | 799 | 184.7 |
| D | 8 | 195 | 2405631 | 12883.0 | 786 | 767 | 186.7 |
| D | 12 | 233 | 1276997 | 6836.84 | 786 | 767 | 186.7 |
| D | 12 | 218 | 135860 | 723.7 | 786 | 767 | 186.7 |
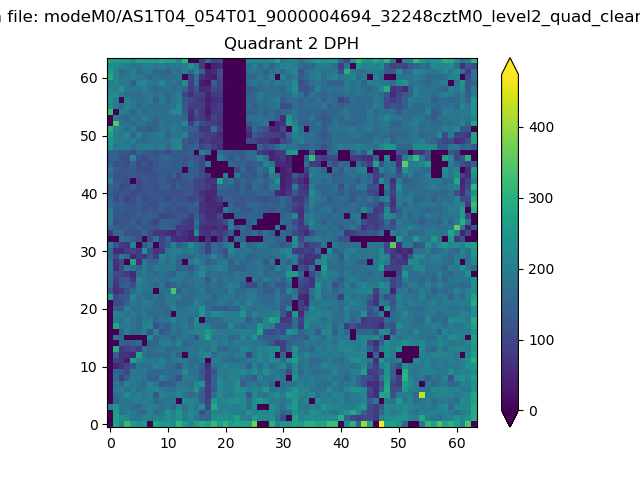
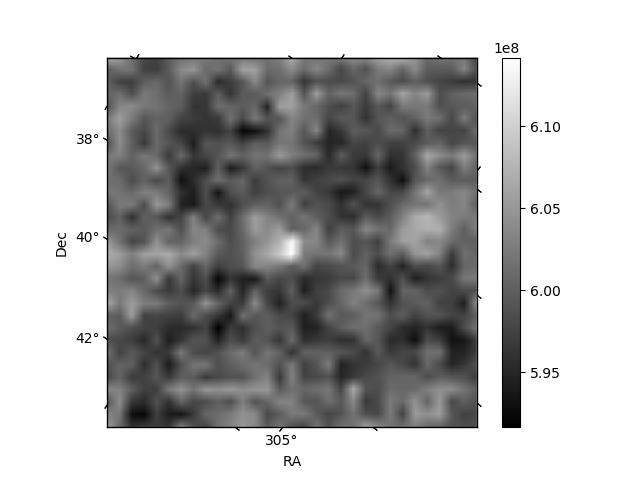
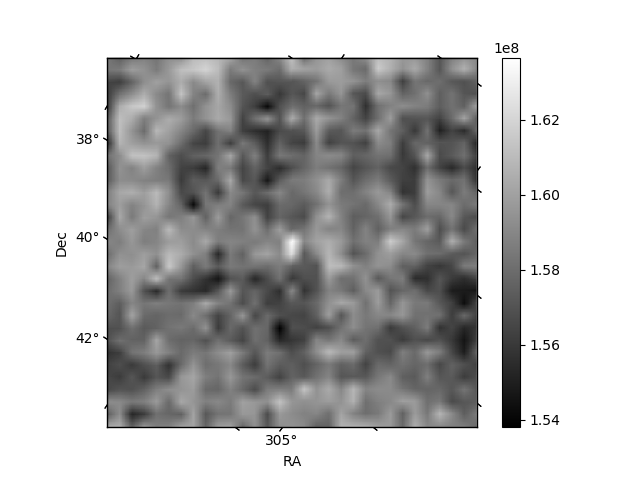
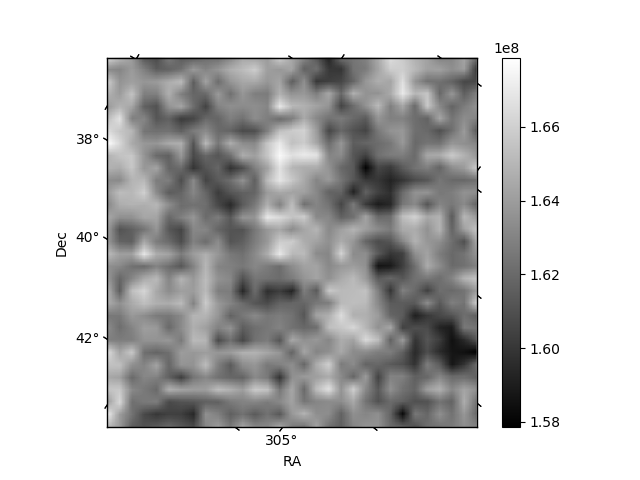
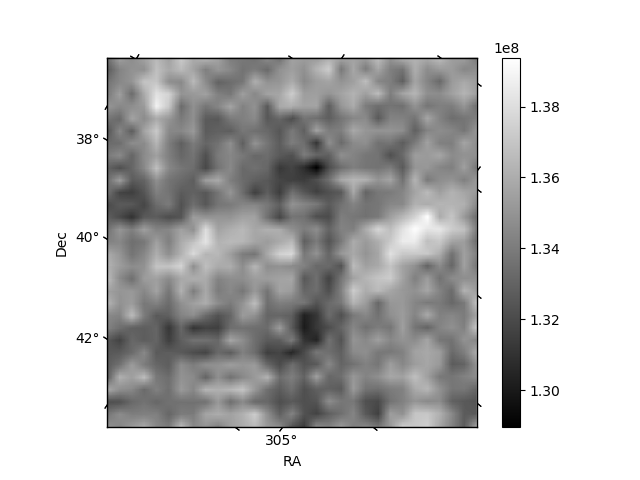
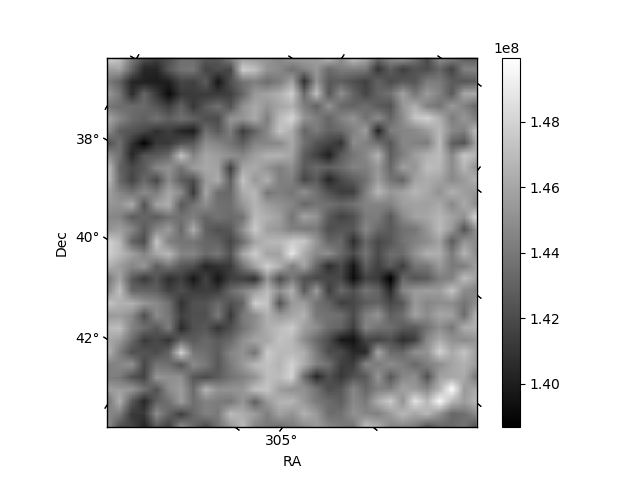
Histogram calculated using DETX and DETY for each event in the final _common_clean file
| Quadrant A | 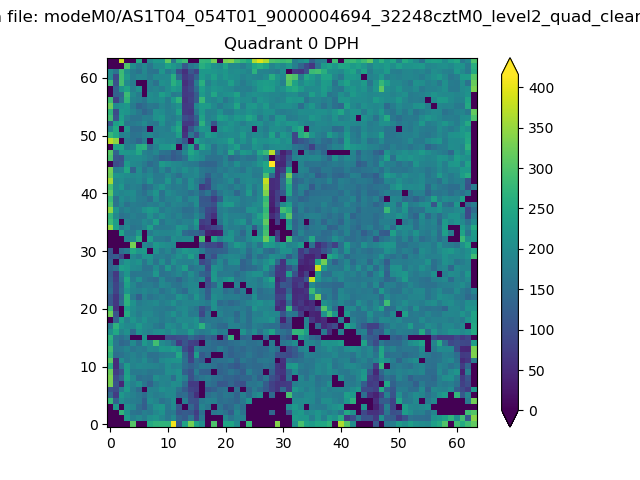 |
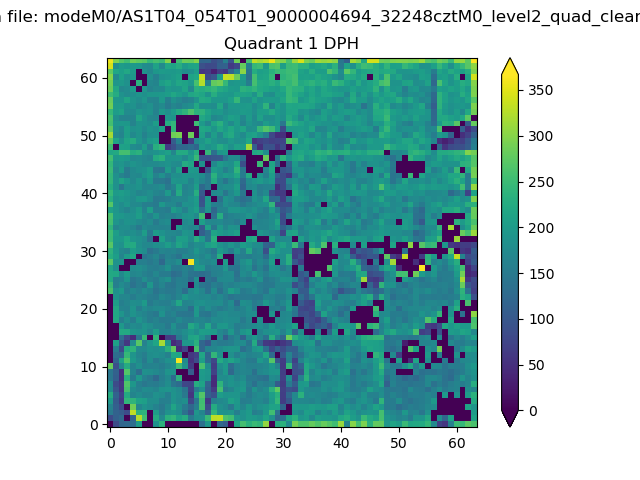 |
Quadrant B |
|---|---|---|---|
| Quadrant D | 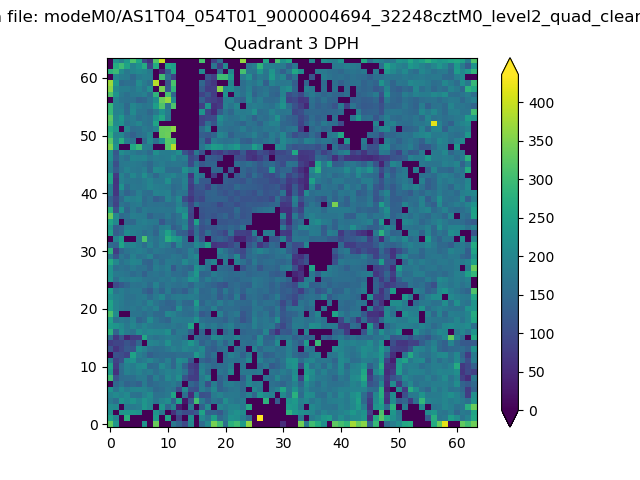 |
 |
Quadrant C |
| Plot type | Count rate plots | Images |
|---|---|---|
| Comparison with Poisson distribution Blue bars denote a histogram of data divided into 1 sec bins. Red curve is a Poisson curve with rate = median count rate of data. |
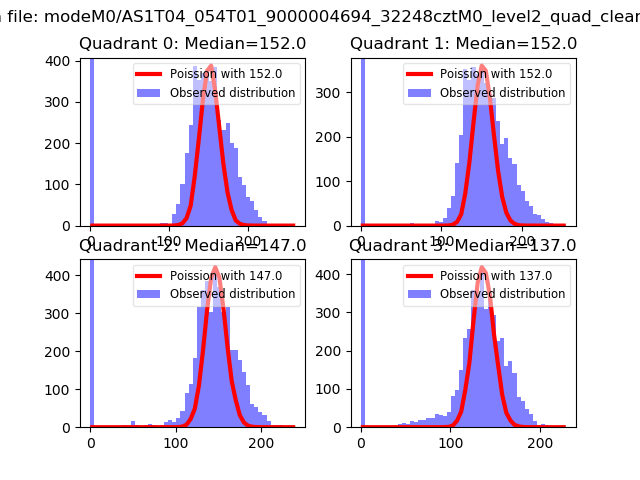 |
 |
| Quadrant-wise count rates Data is divided into 100 sec bins |
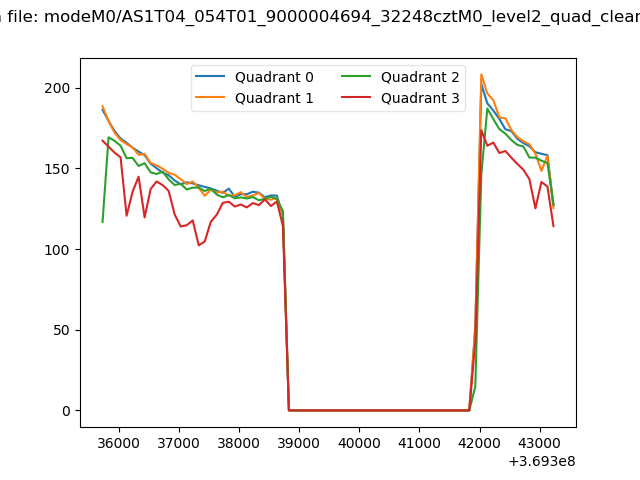 |
|
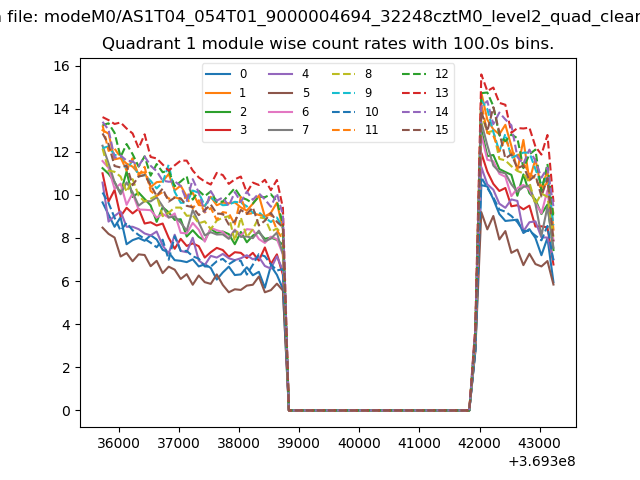
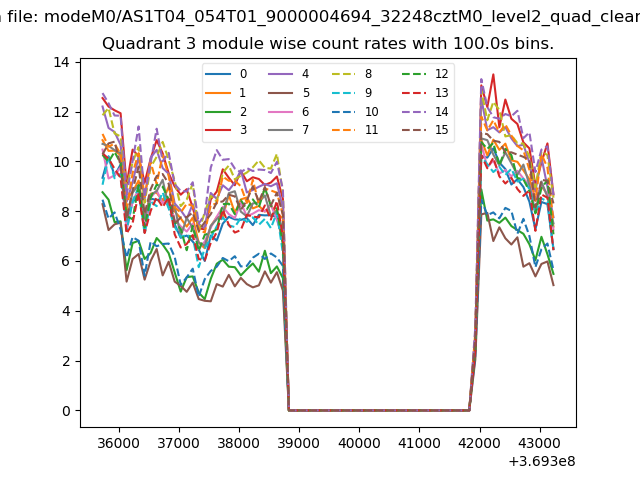
| Module-wise count rates for Quadrant A Data is divided into 100 sec bins |
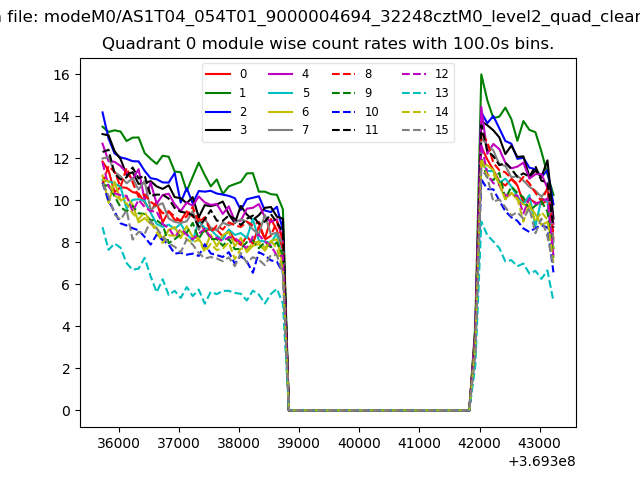 |
 |
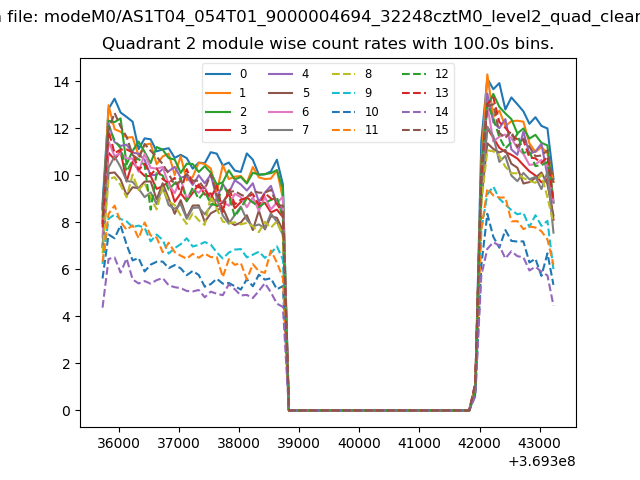
| Module-wise count rates for Quadrant B Data is divided into 100 sec bins |
 |
 |
| Module-wise count rates for Quadrant C Data is divided into 100 sec bins |
 |
 |
| Module-wise count rates for Quadrant D Data is divided into 100 sec bins |
 |
 |
| Parameter | Plot |
|---|---|
| CZT HV Monitor | 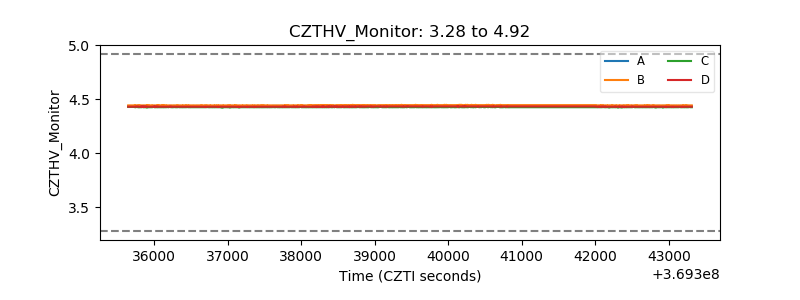 |
| D_VDD | 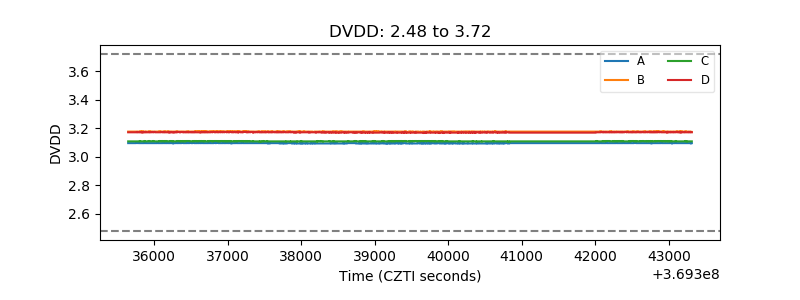 |
| Temperature 1 |  |
| Veto HV Monitor |  |
| Veto LLD | 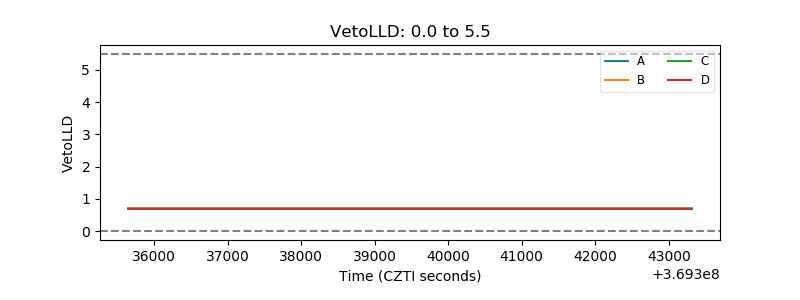 |
| Alpha Counter | 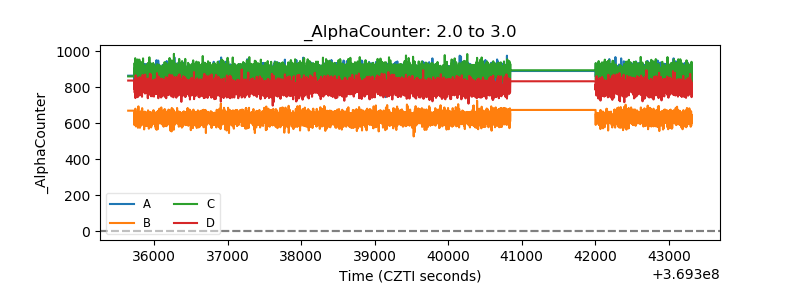 |
| _CPM_Rate | 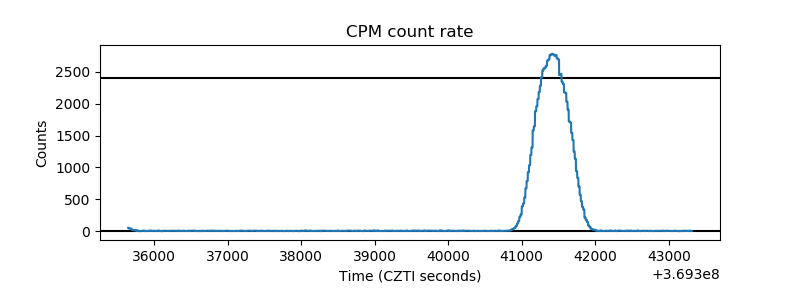 |
| CZT Counter | 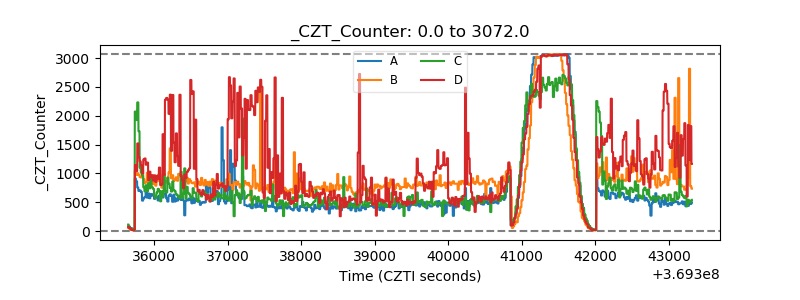 |
| +2.5 Volts monitor |  |
| +5 Volts monitor |  |
| _ROLL_ROT | 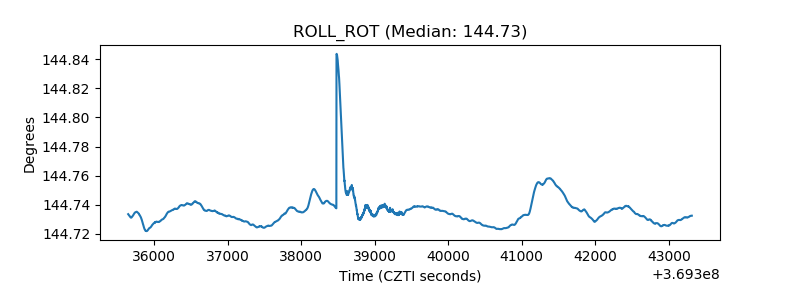 |
| _Roll_DEC | 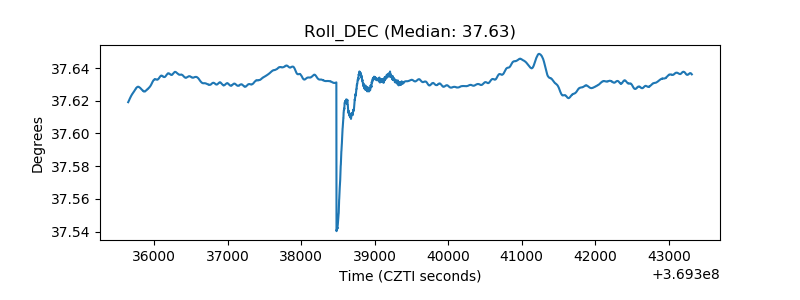 |
| _Roll_RA | 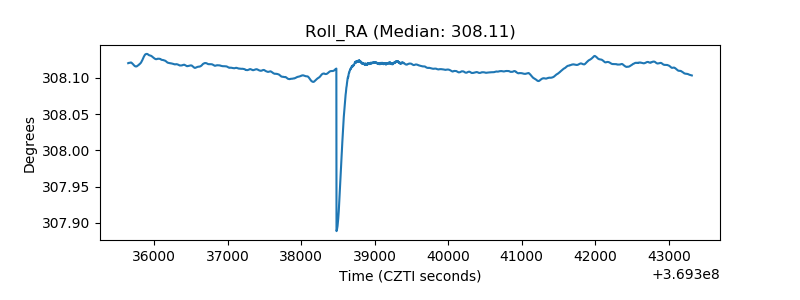 |
| Veto Counter | 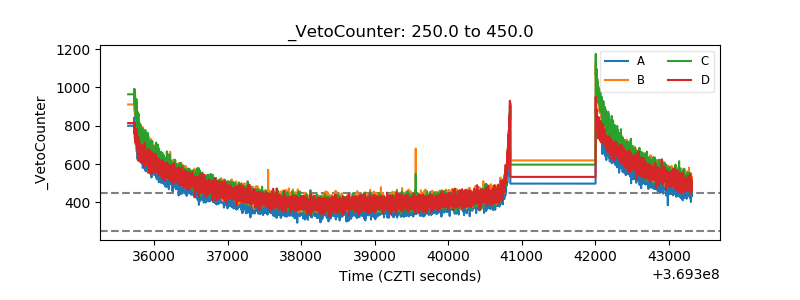 |