| Param | Original file | Final file |
|---|---|---|
| Filename | modeM0/AS1T04_054T01_9000004694_32249cztM0_level2.evt | modeM0/AS1T04_054T01_9000004694_32249cztM0_level2_quad_clean.evt |
| Size (bytes) | 627,359,040 | 102,908,160 |
| Size | 598.3 MB | 98.1 MB |
| Events in quadrant A | 3,242,487 | 695,882 |
| Events in quadrant B | 5,274,016 | 701,803 |
| Events in quadrant C | 4,118,238 | 658,091 |
| Events in quadrant D | 5,939,985 | 621,479 |
| Mode SS | |||
|---|---|---|---|
| Quadrant | BADHDUFLAG | Total packets | Discarded packets |
| A | 0 | 128 | 0 |
| B | 0 | 128 | 0 |
| C | 0 | 128 | 0 |
| D | 0 | 128 | 0 |
| Mode M0 | |||
|---|---|---|---|
| Quadrant | BADHDUFLAG | Total packets | Discarded packets |
| A | 0 | 13693 | 3 |
| B | 0 | 19992 | 2 |
| C | 0 | 16288 | 2 |
| D | 0 | 22001 | 2 |
| Mode M9 | |||
|---|---|---|---|
| Quadrant | BADHDUFLAG | Total packets | Discarded packets |
| A | 0 | 19 | 0 |
| B | 0 | 19 | 0 |
| C | 0 | 19 | 0 |
| D | 0 | 20 | 0 |
| Quadrant | Total seconds | Saturated seconds | Saturation percentage |
|---|---|---|---|
| A | 6293 | 40 | 0.635627% |
| B | 6293 | 128 | 2.034006% |
| C | 6293 | 291 | 4.624186% |
| D | 6293 | 285 | 4.528842% |
Noise dominated data is calculated using 1-second bins in cleaned event files. If a bin has >2000 counts, and if more than 50% of those come from <1% of pixels, then it is considered to be noise-dominated and hence unusable.
| Quadrant | # 1 sec bins | Bins with >0 counts | Bins with >2000 counts | High rate bins dominated by noise | Noise dominated (total time) | Noise dominated (detector-on time) | Marked lightcurve |
|---|---|---|---|---|---|---|---|
| A | 7553 | 6294 | 1 | 1 | 0.01% | 0.02% | 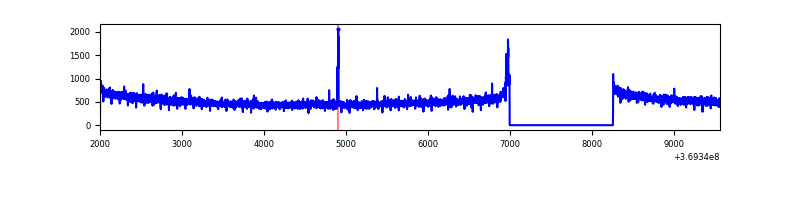 |
| B | 7553 | 6294 | 26 | 26 | 0.34% | 0.41% | 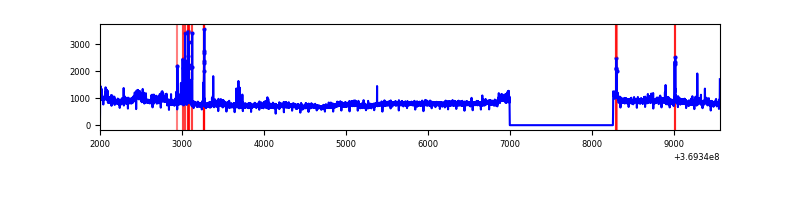 |
| C | 7553 | 6294 | 71 | 71 | 0.94% | 1.13% | 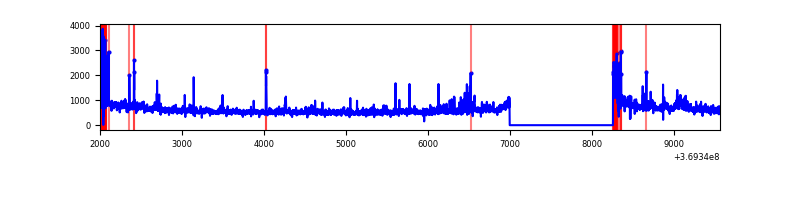 |
| D | 7553 | 6294 | 182 | 182 | 2.41% | 2.89% | 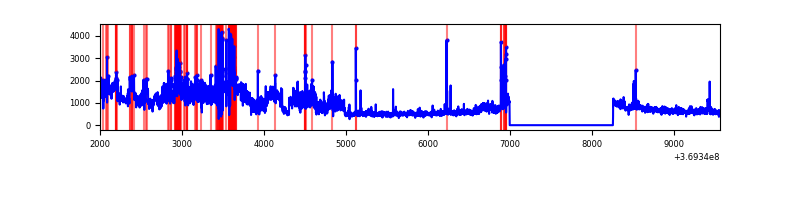 |
Top three noisy pixels from each quadrant. If the there are fewer than three noisy pixels in the level2.evt file, extra rows are filled as -1
| Pixel properties | Quadrant properties | ||||||
|---|---|---|---|---|---|---|---|
| Quadrant | DetID | PixID | Counts | Sigma | Mean | Median | Sigma |
| A | 5 | 168 | 30847 | 183.75 | 830 | 817 | 163.4 |
| A | 13 | 254 | 11850 | 67.51 | 830 | 817 | 163.4 |
| A | 13 | 6 | 8295 | 45.76 | 830 | 817 | 163.4 |
| B | 6 | 159 | 1754210 | 11445.64 | 826 | 806 | 153.2 |
| B | 5 | 172 | 106330 | 688.83 | 826 | 806 | 153.2 |
| B | 0 | 229 | 100374 | 649.95 | 826 | 806 | 153.2 |
| C | 3 | 233 | 435670 | 2345.3 | 795 | 804 | 185.4 |
| C | 0 | 10 | 366013 | 1969.63 | 795 | 804 | 185.4 |
| C | 14 | 238 | 142281 | 763.01 | 795 | 804 | 185.4 |
| D | 8 | 195 | 2547791 | 13477.24 | 794 | 775 | 189.0 |
| D | 13 | 249 | 185123 | 975.46 | 794 | 775 | 189.0 |
| D | 12 | 233 | 154676 | 814.35 | 794 | 775 | 189.0 |
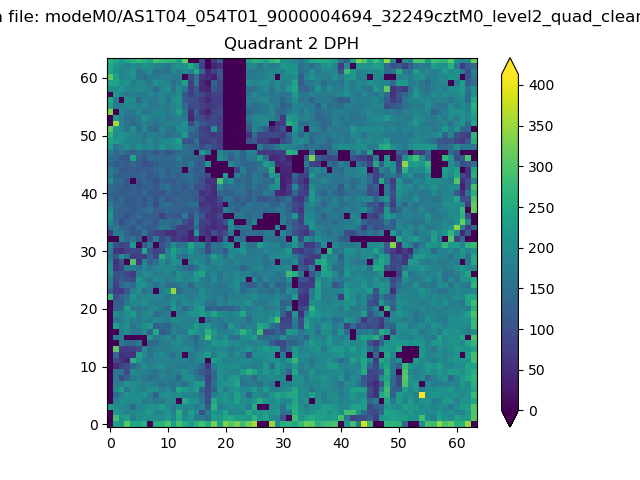
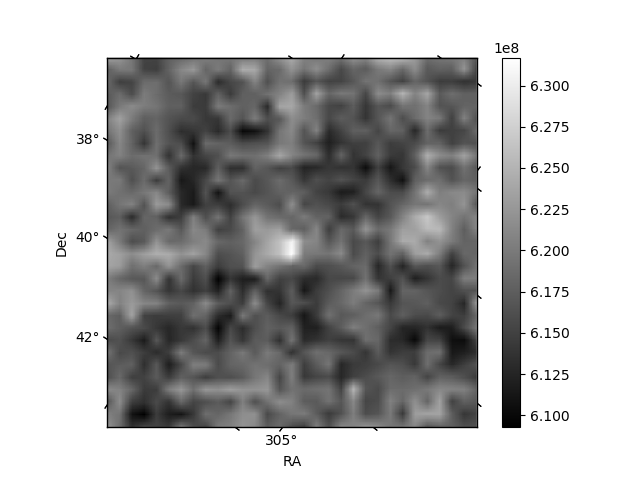
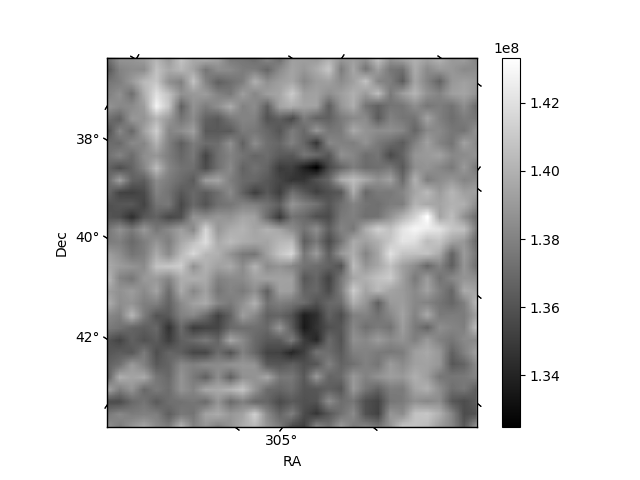
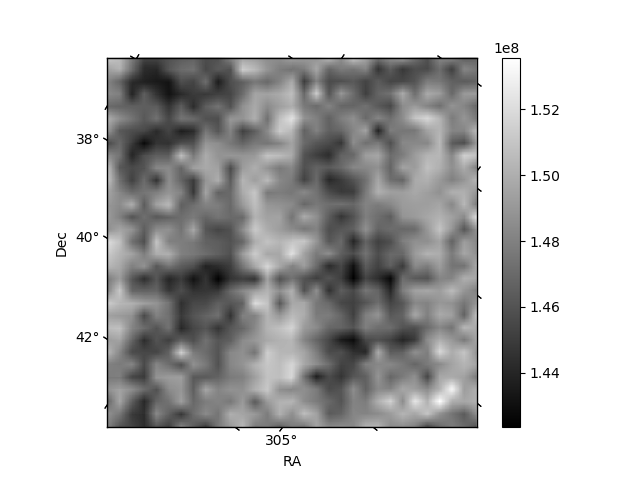
Histogram calculated using DETX and DETY for each event in the final _common_clean file
| Quadrant A | 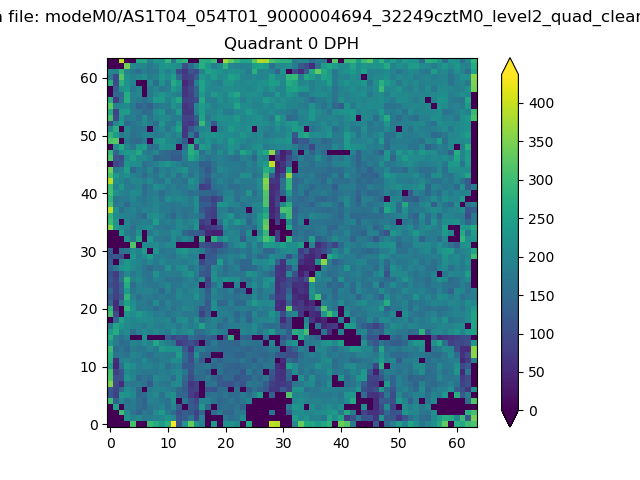 |
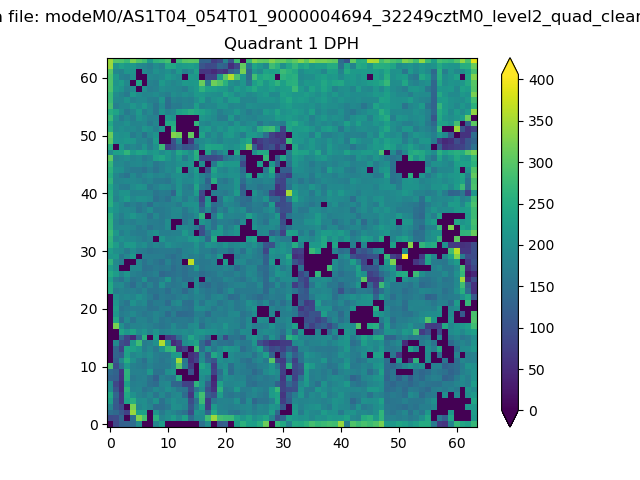 |
Quadrant B |
|---|---|---|---|
| Quadrant D | 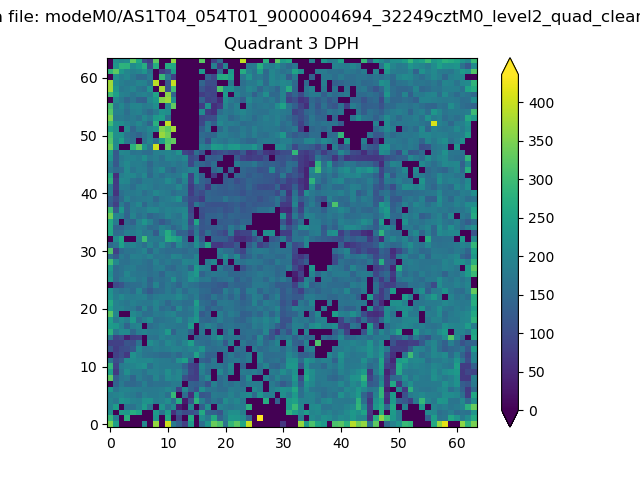 |
 |
Quadrant C |
| Plot type | Count rate plots | Images |
|---|---|---|
| Comparison with Poisson distribution Blue bars denote a histogram of data divided into 1 sec bins. Red curve is a Poisson curve with rate = median count rate of data. |
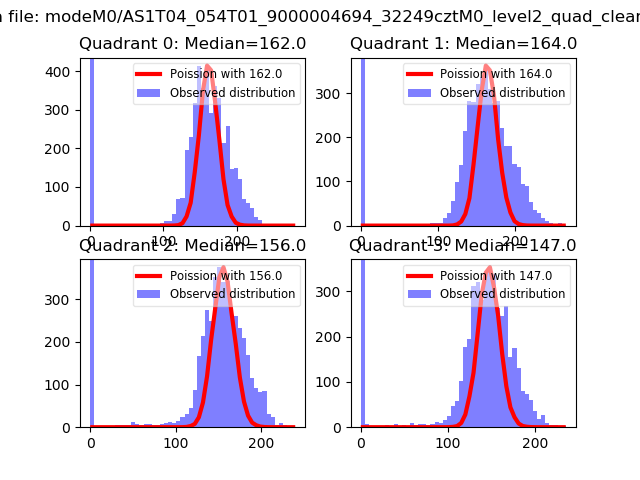 |
 |
| Quadrant-wise count rates Data is divided into 100 sec bins |
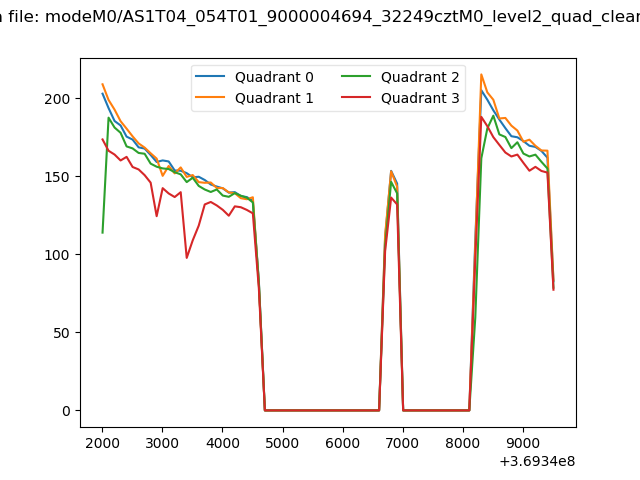 |
|
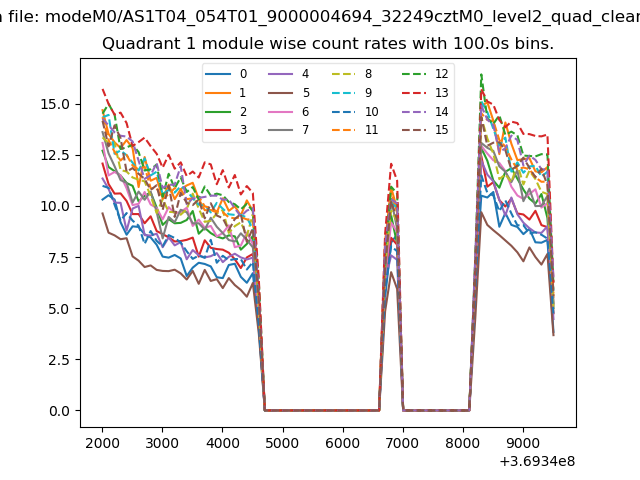
| Module-wise count rates for Quadrant A Data is divided into 100 sec bins |
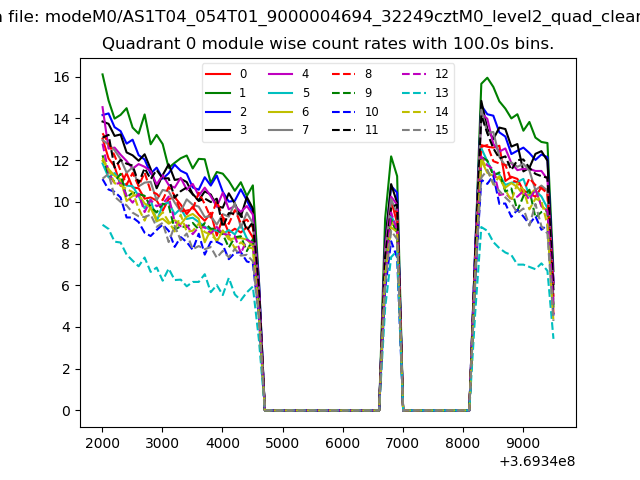 |
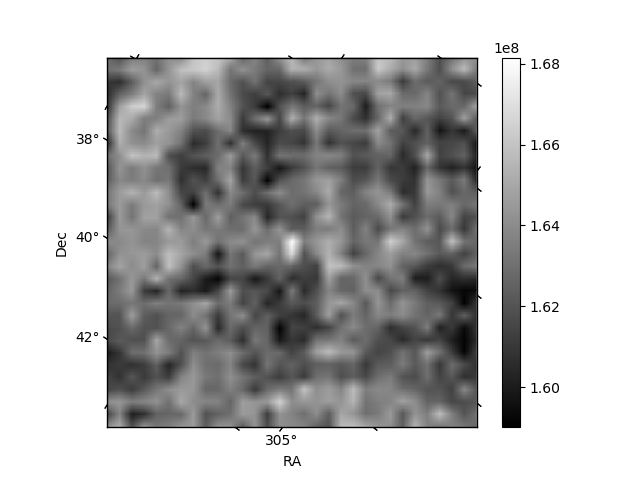 |
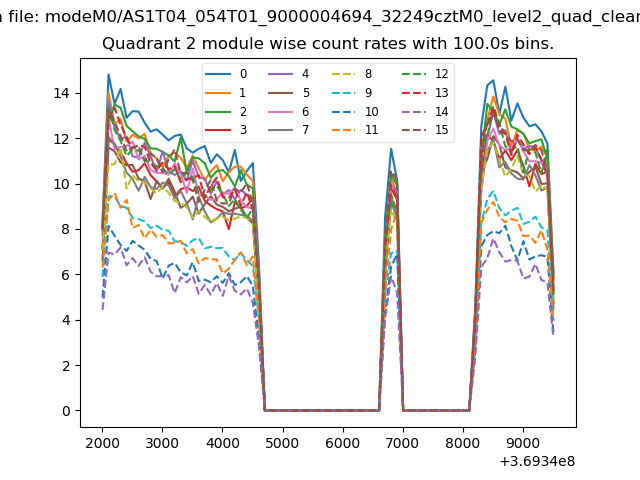
| Module-wise count rates for Quadrant B Data is divided into 100 sec bins |
 |
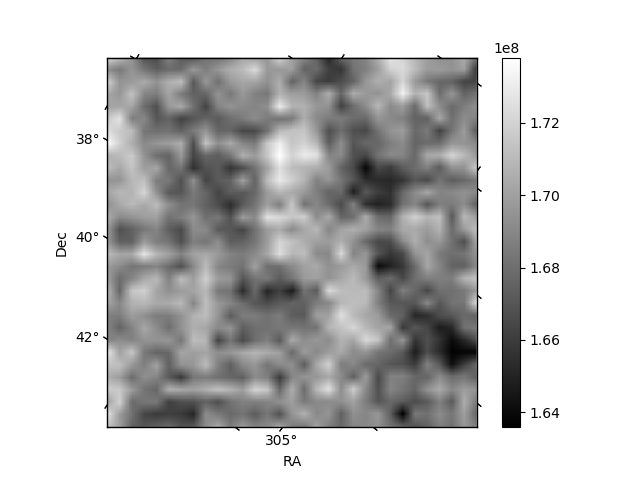 |
| Module-wise count rates for Quadrant C Data is divided into 100 sec bins |
 |
 |
| Module-wise count rates for Quadrant D Data is divided into 100 sec bins |
 |
 |
| Parameter | Plot |
|---|---|
| CZT HV Monitor | 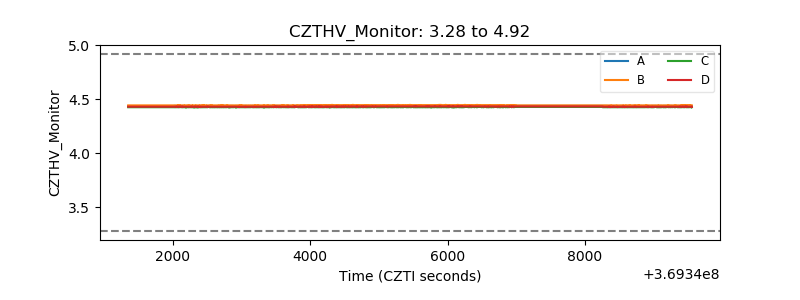 |
| D_VDD | 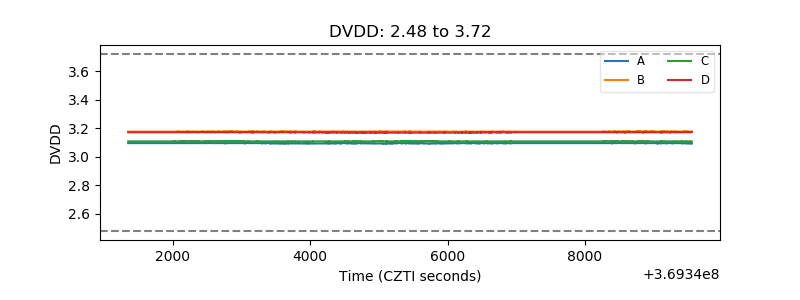 |
| Temperature 1 | 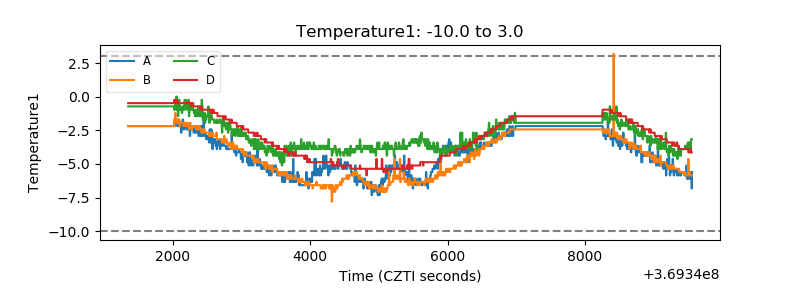 |
| Veto HV Monitor | 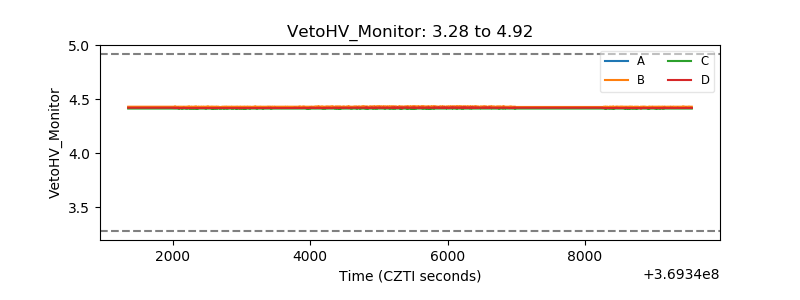 |
| Veto LLD |  |
| Alpha Counter | 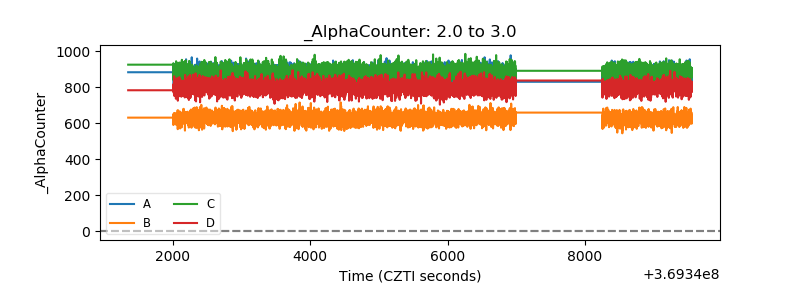 |
| _CPM_Rate | 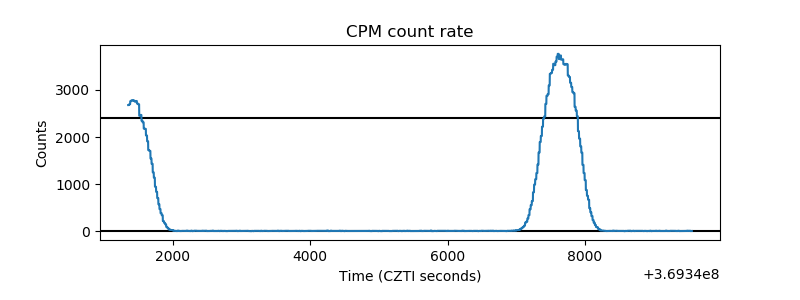 |
| CZT Counter | 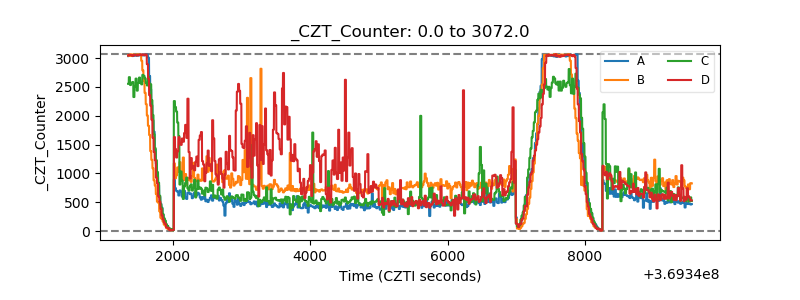 |
| +2.5 Volts monitor |  |
| +5 Volts monitor |  |
| _ROLL_ROT | 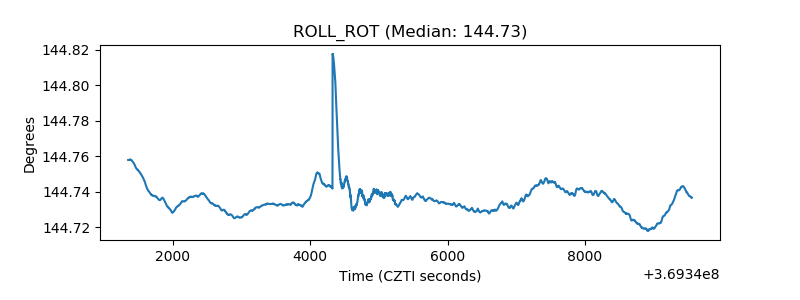 |
| _Roll_DEC | 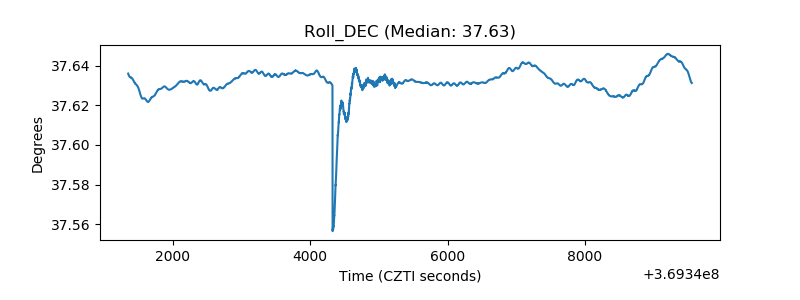 |
| _Roll_RA | 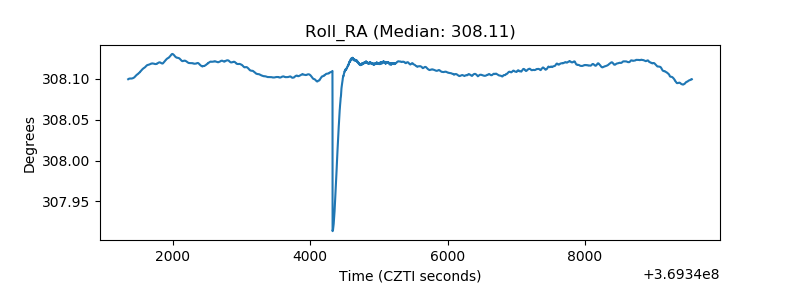 |
| Veto Counter |  |