| Param | Original file | Final file |
|---|---|---|
| Filename | modeM0/AS1T04_054T01_9000004694_32250cztM0_level2.evt | modeM0/AS1T04_054T01_9000004694_32250cztM0_level2_quad_clean.evt |
| Size (bytes) | 564,071,040 | 104,382,720 |
| Size | 537.9 MB | 99.5 MB |
| Events in quadrant A | 3,236,130 | 701,965 |
| Events in quadrant B | 5,211,350 | 715,128 |
| Events in quadrant C | 4,059,156 | 665,463 |
| Events in quadrant D | 4,154,209 | 643,192 |
| Mode SS | |||
|---|---|---|---|
| Quadrant | BADHDUFLAG | Total packets | Discarded packets |
| A | 0 | 126 | 0 |
| B | 0 | 126 | 0 |
| C | 0 | 126 | 0 |
| D | 0 | 126 | 0 |
| Mode M0 | |||
|---|---|---|---|
| Quadrant | BADHDUFLAG | Total packets | Discarded packets |
| A | 0 | 13479 | 3 |
| B | 0 | 19591 | 2 |
| C | 0 | 16042 | 2 |
| D | 0 | 16608 | 2 |
| Mode M9 | |||
|---|---|---|---|
| Quadrant | BADHDUFLAG | Total packets | Discarded packets |
| A | 0 | 13 | 0 |
| B | 0 | 13 | 0 |
| C | 0 | 13 | 0 |
| D | 0 | 14 | 0 |
| Quadrant | Total seconds | Saturated seconds | Saturation percentage |
|---|---|---|---|
| A | 6243 | 24 | 0.384431% |
| B | 6243 | 107 | 1.713920% |
| C | 6243 | 321 | 5.141759% |
| D | 6243 | 99 | 1.585776% |
Noise dominated data is calculated using 1-second bins in cleaned event files. If a bin has >2000 counts, and if more than 50% of those come from <1% of pixels, then it is considered to be noise-dominated and hence unusable.
| Quadrant | # 1 sec bins | Bins with >0 counts | Bins with >2000 counts | High rate bins dominated by noise | Noise dominated (total time) | Noise dominated (detector-on time) | Marked lightcurve |
|---|---|---|---|---|---|---|---|
| A | 7578 | 6244 | 0 | 0 | 0.00% | 0.00% | 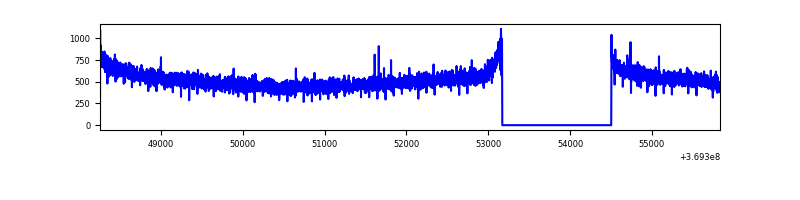 |
| B | 7578 | 6244 | 19 | 19 | 0.25% | 0.30% | 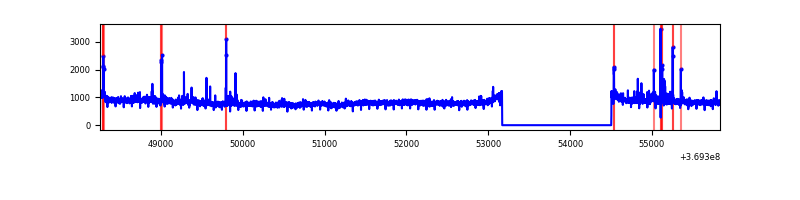 |
| C | 7578 | 6244 | 64 | 64 | 0.84% | 1.02% | 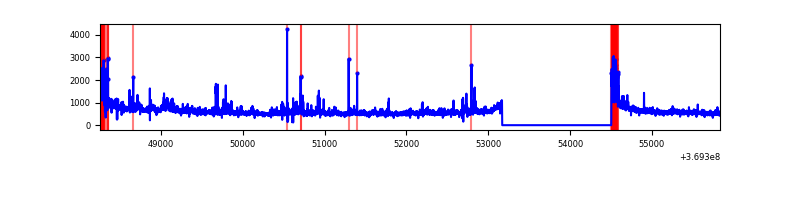 |
| D | 7578 | 6244 | 60 | 60 | 0.79% | 0.96% | 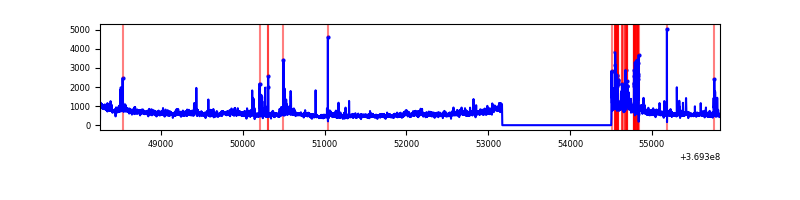 |
Top three noisy pixels from each quadrant. If the there are fewer than three noisy pixels in the level2.evt file, extra rows are filled as -1
| Pixel properties | Quadrant properties | ||||||
|---|---|---|---|---|---|---|---|
| Quadrant | DetID | PixID | Counts | Sigma | Mean | Median | Sigma |
| A | 13 | 6 | 18770 | 108.37 | 833 | 822 | 165.6 |
| A | 13 | 254 | 11265 | 63.05 | 833 | 822 | 165.6 |
| A | 3 | 137 | 7756 | 41.87 | 833 | 822 | 165.6 |
| B | 6 | 159 | 1741998 | 11288.8 | 833 | 814 | 154.2 |
| B | 4 | 80 | 61485 | 393.35 | 833 | 814 | 154.2 |
| B | 0 | 245 | 46741 | 297.76 | 833 | 814 | 154.2 |
| C | 0 | 10 | 348645 | 1886.63 | 795 | 804 | 184.4 |
| C | 3 | 233 | 343510 | 1858.78 | 795 | 804 | 184.4 |
| C | 14 | 238 | 160291 | 865.03 | 795 | 804 | 184.4 |
| D | 8 | 195 | 780897 | 4077.14 | 800 | 780 | 191.3 |
| D | 13 | 249 | 191370 | 996.08 | 800 | 780 | 191.3 |
| D | 12 | 233 | 103530 | 537.0 | 800 | 780 | 191.3 |
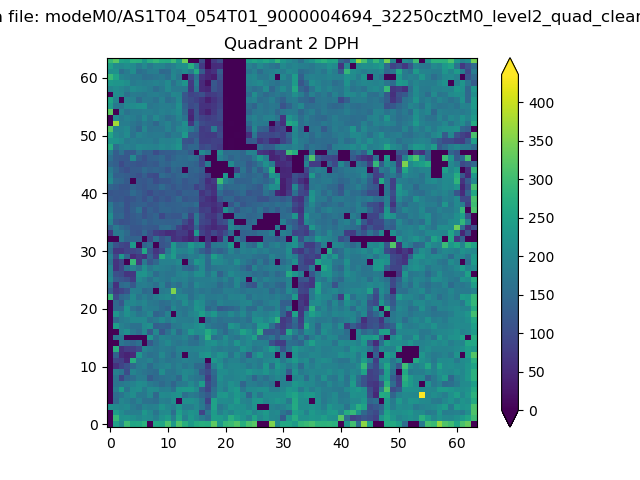
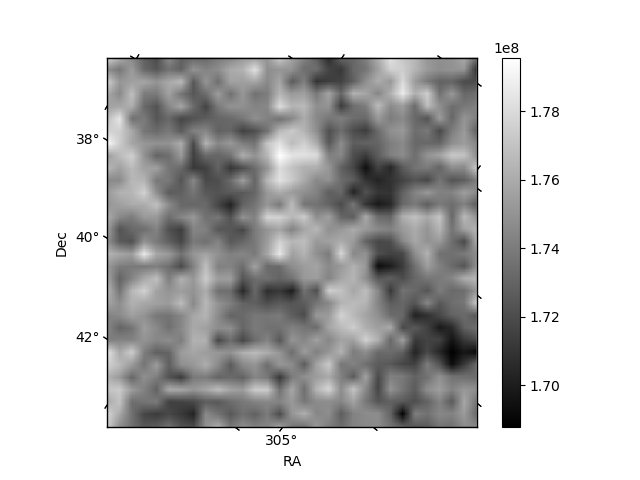
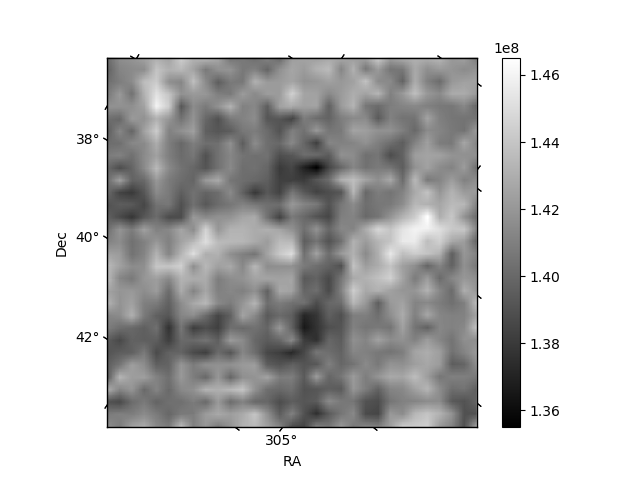
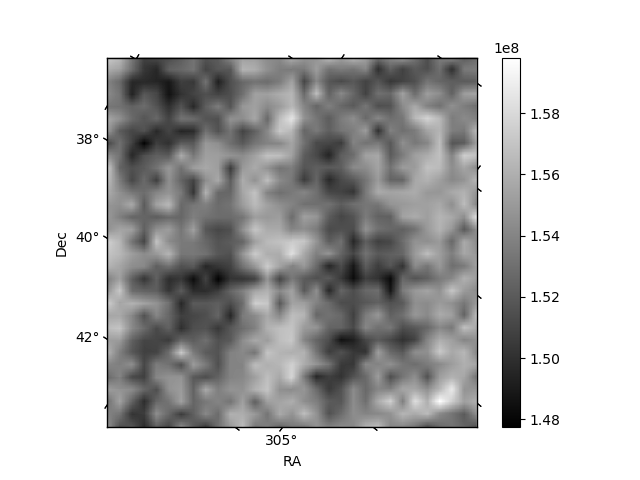
Histogram calculated using DETX and DETY for each event in the final _common_clean file
| Quadrant A | 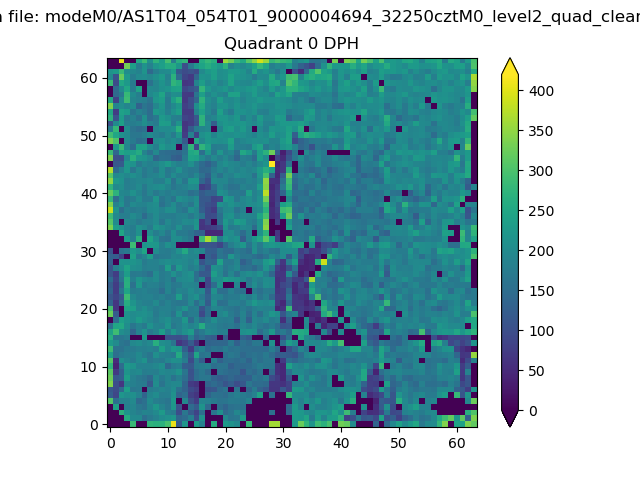 |
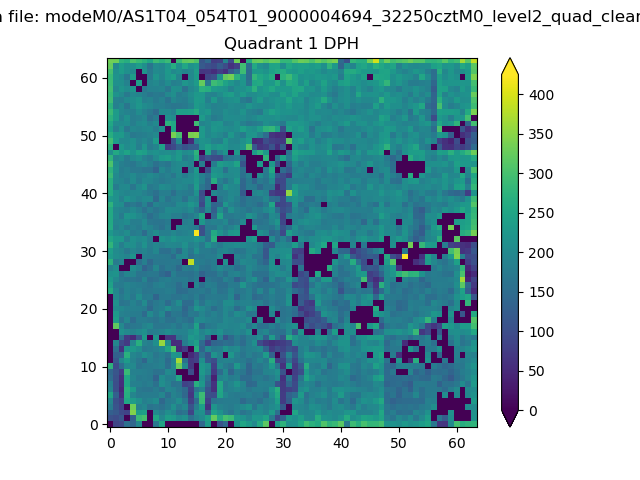 |
Quadrant B |
|---|---|---|---|
| Quadrant D | 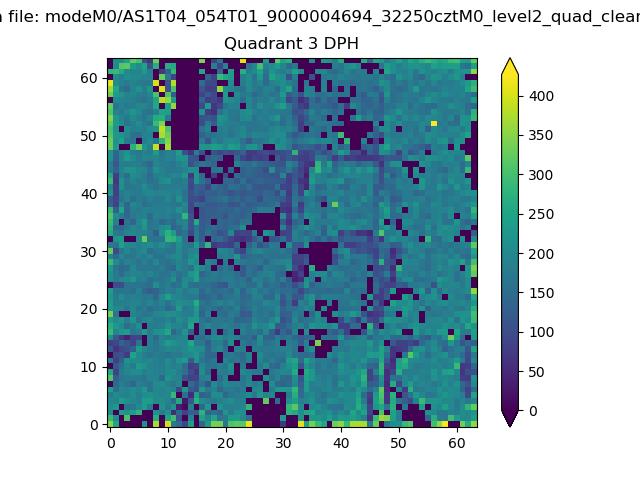 |
 |
Quadrant C |
| Plot type | Count rate plots | Images |
|---|---|---|
| Comparison with Poisson distribution Blue bars denote a histogram of data divided into 1 sec bins. Red curve is a Poisson curve with rate = median count rate of data. |
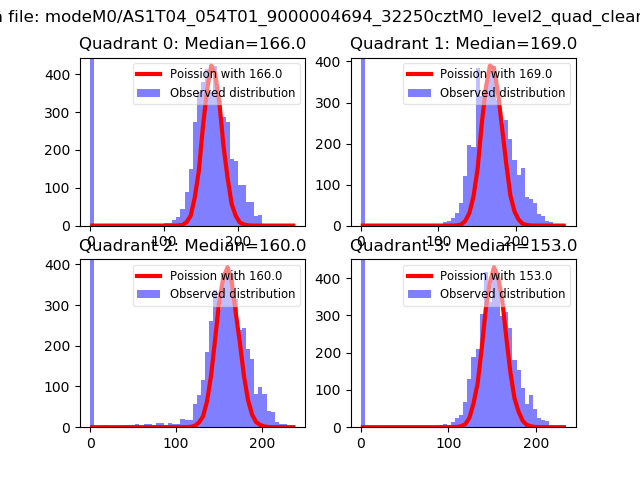 |
 |
| Quadrant-wise count rates Data is divided into 100 sec bins |
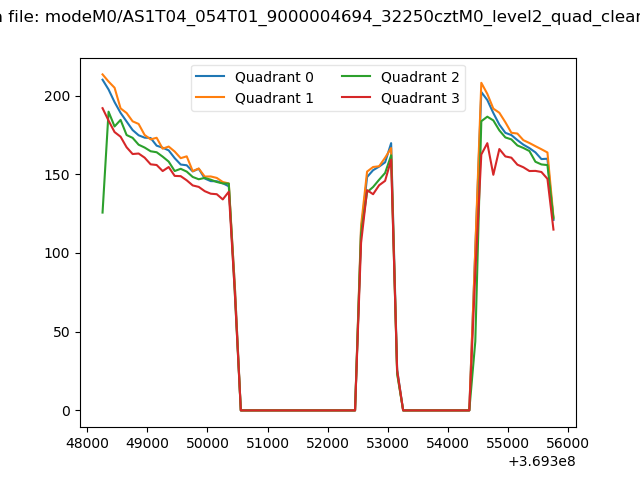 |
|
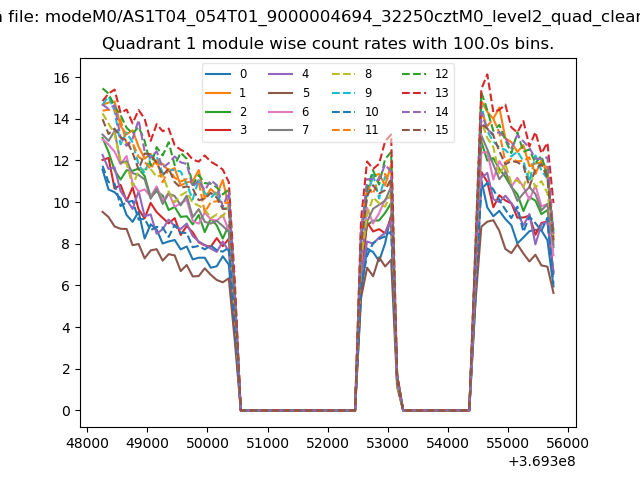
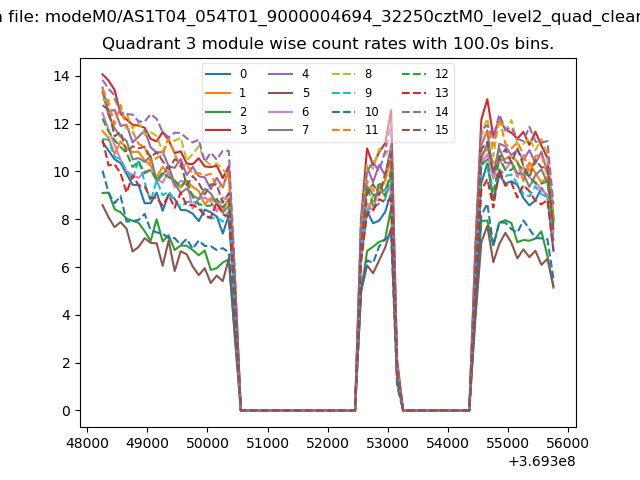
| Module-wise count rates for Quadrant A Data is divided into 100 sec bins |
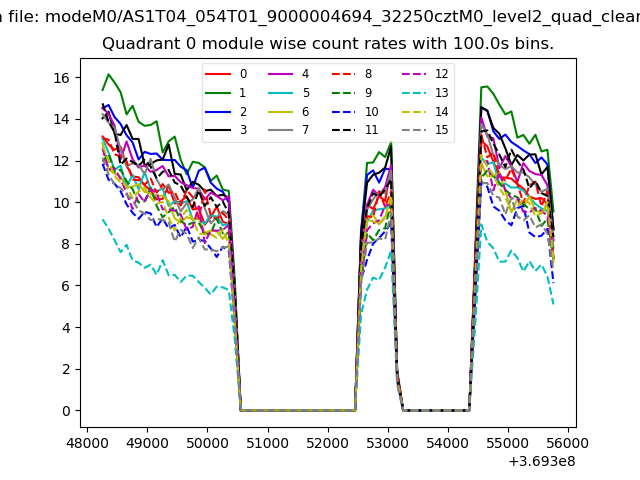 |
 |
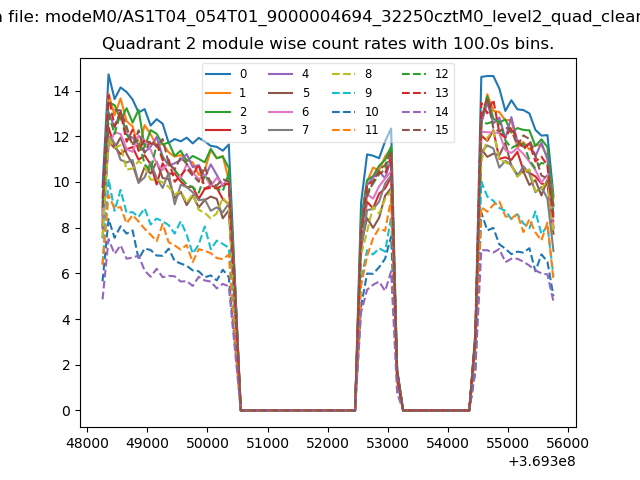
| Module-wise count rates for Quadrant B Data is divided into 100 sec bins |
 |
 |
| Module-wise count rates for Quadrant C Data is divided into 100 sec bins |
 |
 |
| Module-wise count rates for Quadrant D Data is divided into 100 sec bins |
 |
 |
| Parameter | Plot |
|---|---|
| CZT HV Monitor | 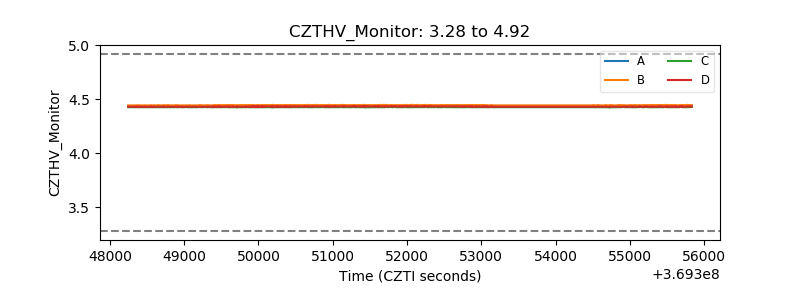 |
| D_VDD | 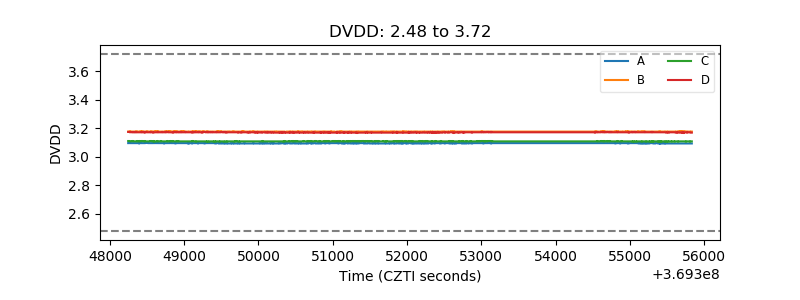 |
| Temperature 1 | 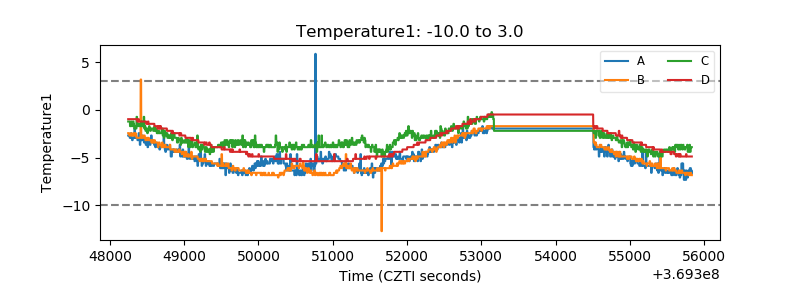 |
| Veto HV Monitor | 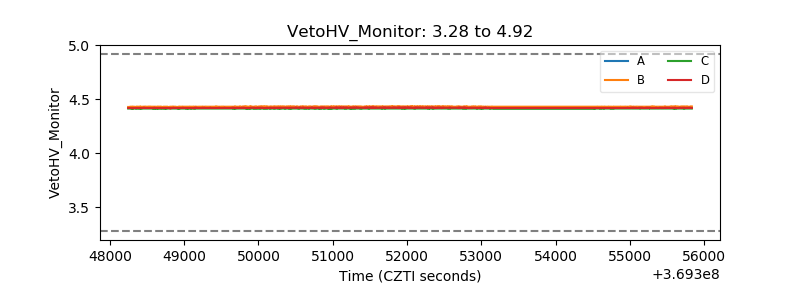 |
| Veto LLD | 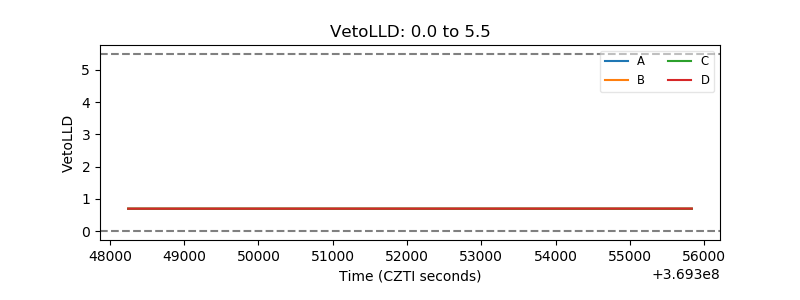 |
| Alpha Counter | 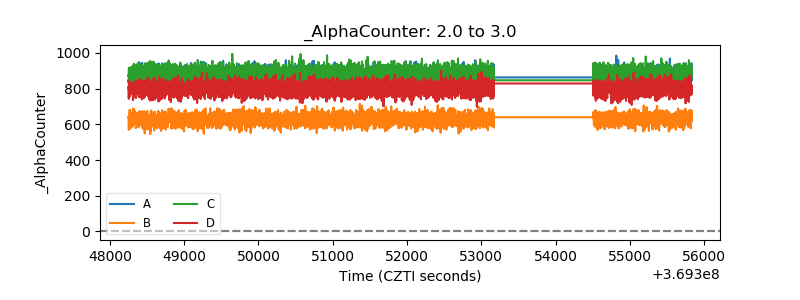 |
| _CPM_Rate | 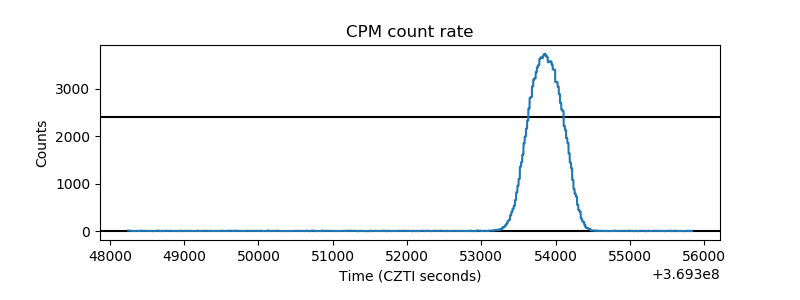 |
| CZT Counter |  |
| +2.5 Volts monitor |  |
| +5 Volts monitor |  |
| _ROLL_ROT | 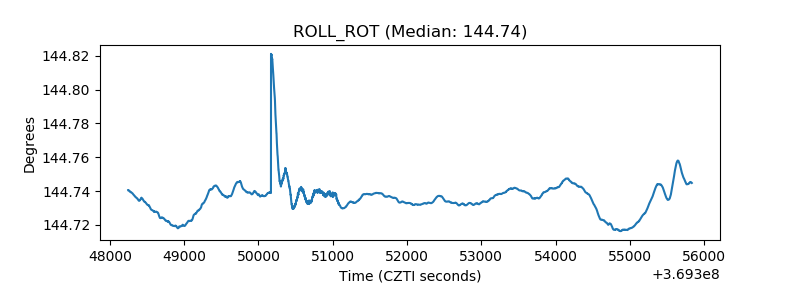 |
| _Roll_DEC | 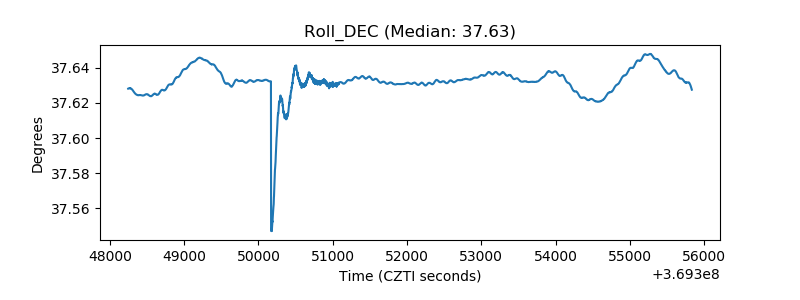 |
| _Roll_RA |  |
| Veto Counter | 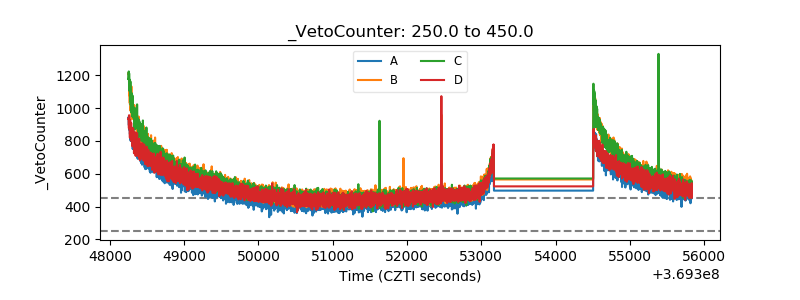 |