| Param | Original file | Final file |
|---|---|---|
| Filename | modeM0/AS1T04_054T01_9000004694_32251cztM0_level2.evt | modeM0/AS1T04_054T01_9000004694_32251cztM0_level2_quad_clean.evt |
| Size (bytes) | 573,226,560 | 102,686,400 |
| Size | 546.7 MB | 97.9 MB |
| Events in quadrant A | 3,221,328 | 690,914 |
| Events in quadrant B | 5,298,864 | 699,378 |
| Events in quadrant C | 3,621,470 | 661,206 |
| Events in quadrant D | 4,795,009 | 621,214 |
| Mode SS | |||
|---|---|---|---|
| Quadrant | BADHDUFLAG | Total packets | Discarded packets |
| A | 0 | 126 | 0 |
| B | 0 | 126 | 0 |
| C | 0 | 126 | 0 |
| D | 0 | 126 | 0 |
| Mode M0 | |||
|---|---|---|---|
| Quadrant | BADHDUFLAG | Total packets | Discarded packets |
| A | 0 | 13370 | 3 |
| B | 0 | 19915 | 2 |
| C | 0 | 14588 | 2 |
| D | 0 | 18428 | 2 |
| Mode M9 | |||
|---|---|---|---|
| Quadrant | BADHDUFLAG | Total packets | Discarded packets |
| A | 0 | 19 | 0 |
| B | 0 | 19 | 0 |
| C | 0 | 19 | 0 |
| D | 0 | 20 | 0 |
| Quadrant | Total seconds | Saturated seconds | Saturation percentage |
|---|---|---|---|
| A | 6265 | 42 | 0.670391% |
| B | 6265 | 178 | 2.841181% |
| C | 6265 | 232 | 3.703113% |
| D | 6265 | 205 | 3.272147% |
Noise dominated data is calculated using 1-second bins in cleaned event files. If a bin has >2000 counts, and if more than 50% of those come from <1% of pixels, then it is considered to be noise-dominated and hence unusable.
| Quadrant | # 1 sec bins | Bins with >0 counts | Bins with >2000 counts | High rate bins dominated by noise | Noise dominated (total time) | Noise dominated (detector-on time) | Marked lightcurve |
|---|---|---|---|---|---|---|---|
| A | 7600 | 6266 | 0 | 0 | 0.00% | 0.00% | 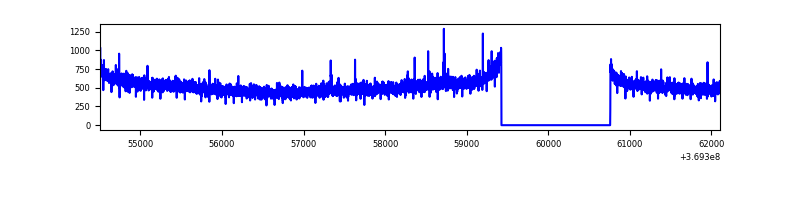 |
| B | 7600 | 6266 | 17 | 17 | 0.22% | 0.27% | 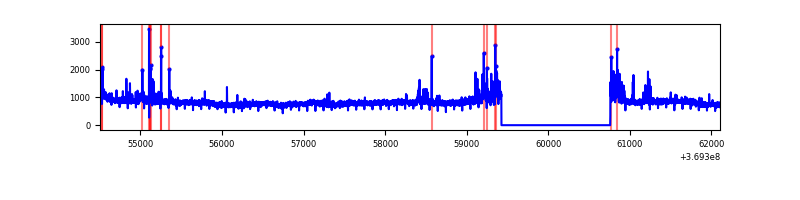 |
| C | 7600 | 6266 | 54 | 54 | 0.71% | 0.86% | 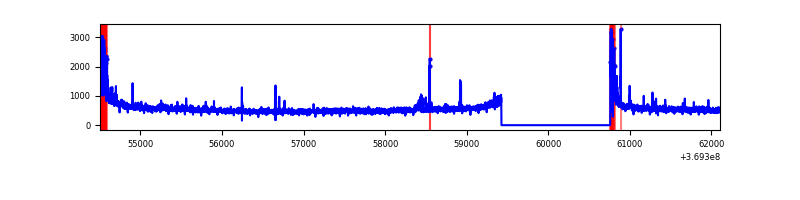 |
| D | 7600 | 6266 | 118 | 118 | 1.55% | 1.88% | 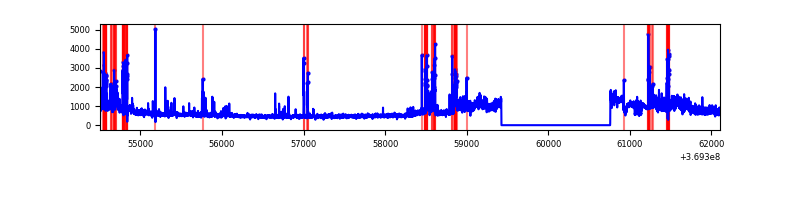 |
Top three noisy pixels from each quadrant. If the there are fewer than three noisy pixels in the level2.evt file, extra rows are filled as -1
| Pixel properties | Quadrant properties | ||||||
|---|---|---|---|---|---|---|---|
| Quadrant | DetID | PixID | Counts | Sigma | Mean | Median | Sigma |
| A | 13 | 6 | 16076 | 92.87 | 826 | 813 | 164.4 |
| A | 14 | 238 | 15849 | 91.49 | 826 | 813 | 164.4 |
| A | 13 | 254 | 11852 | 67.17 | 826 | 813 | 164.4 |
| B | 6 | 159 | 1729000 | 11262.7 | 824 | 807 | 153.4 |
| B | 4 | 80 | 227898 | 1479.96 | 824 | 807 | 153.4 |
| B | 0 | 245 | 28508 | 180.53 | 824 | 807 | 153.4 |
| C | 0 | 10 | 242409 | 1313.12 | 794 | 801 | 184.0 |
| C | 14 | 238 | 140275 | 758.03 | 794 | 801 | 184.0 |
| C | 3 | 233 | 62995 | 338.02 | 794 | 801 | 184.0 |
| D | 8 | 195 | 1307284 | 7026.78 | 783 | 764 | 185.9 |
| D | 12 | 233 | 219254 | 1175.09 | 783 | 764 | 185.9 |
| D | 13 | 249 | 201017 | 1077.01 | 783 | 764 | 185.9 |
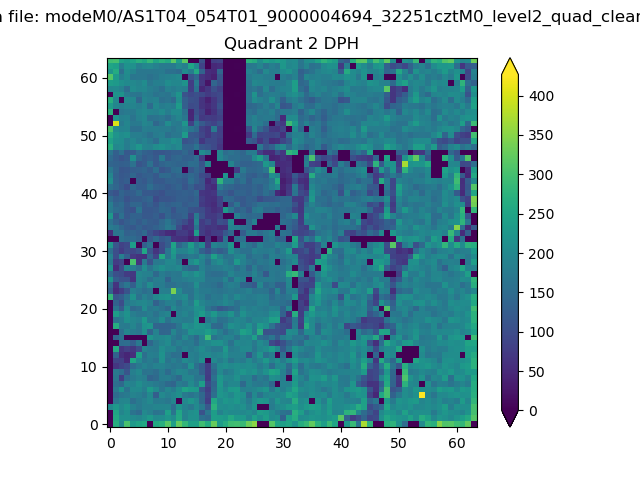
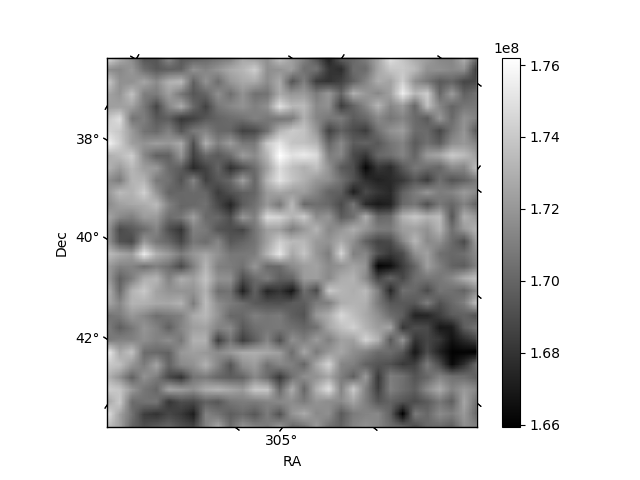
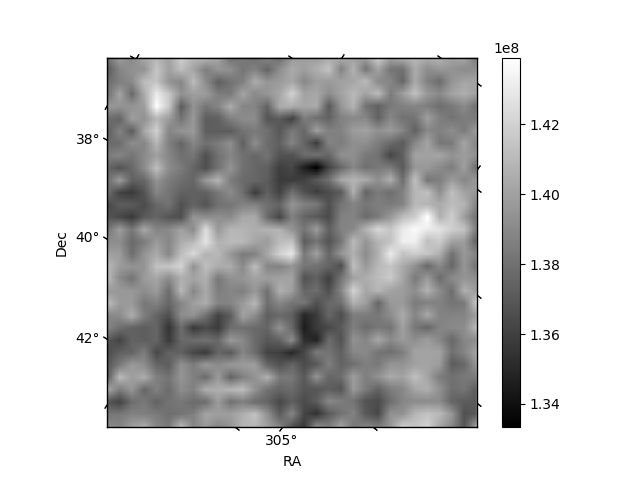
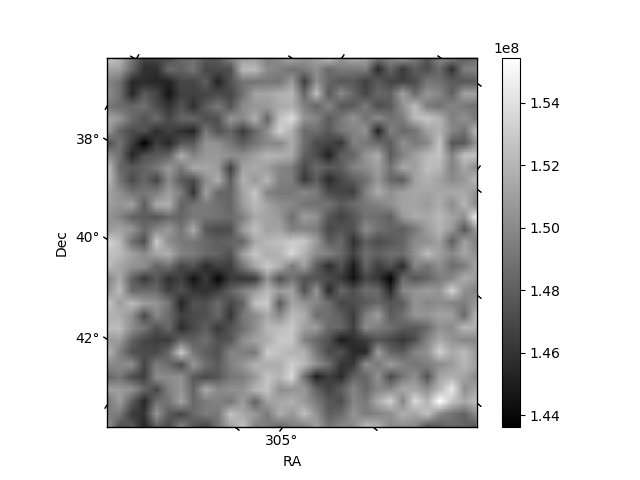
Histogram calculated using DETX and DETY for each event in the final _common_clean file
| Quadrant A | 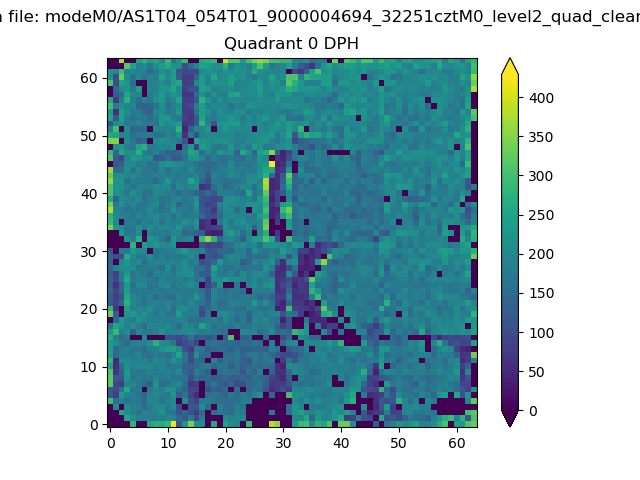 |
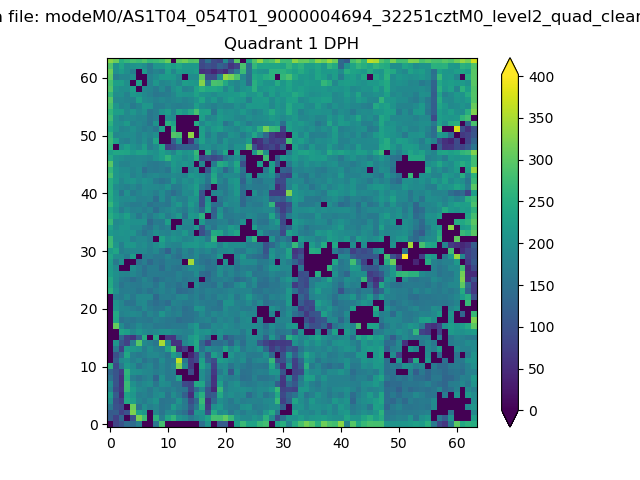 |
Quadrant B |
|---|---|---|---|
| Quadrant D | 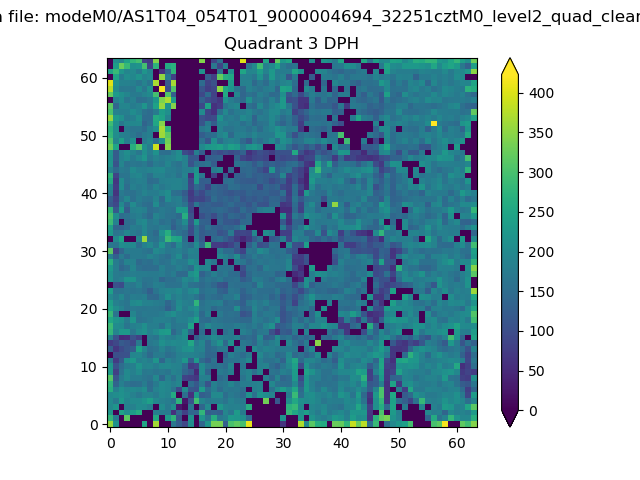 |
 |
Quadrant C |
| Plot type | Count rate plots | Images |
|---|---|---|
| Comparison with Poisson distribution Blue bars denote a histogram of data divided into 1 sec bins. Red curve is a Poisson curve with rate = median count rate of data. |
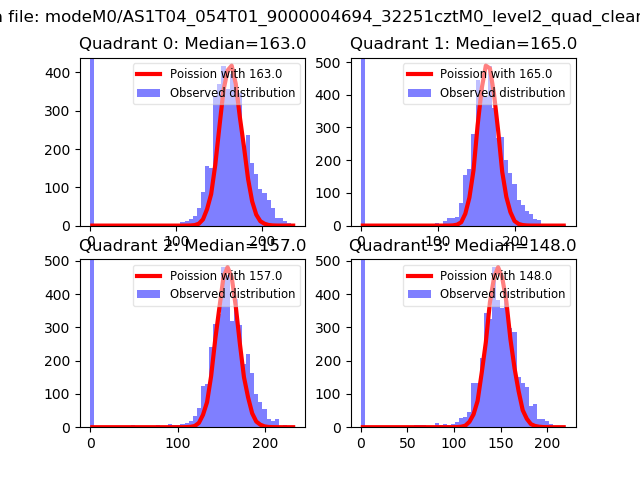 |
 |
| Quadrant-wise count rates Data is divided into 100 sec bins |
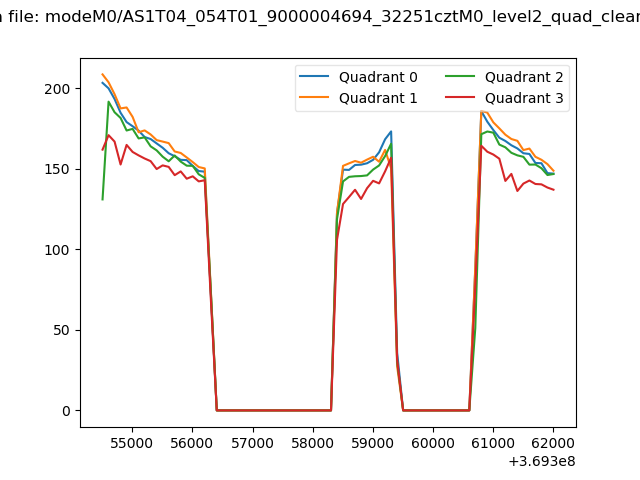 |
|
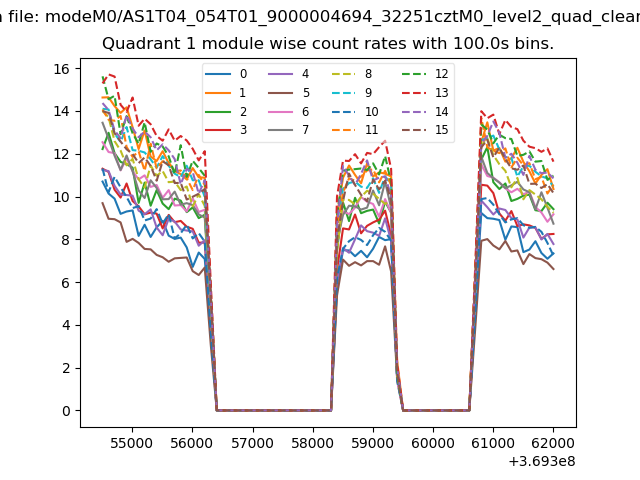
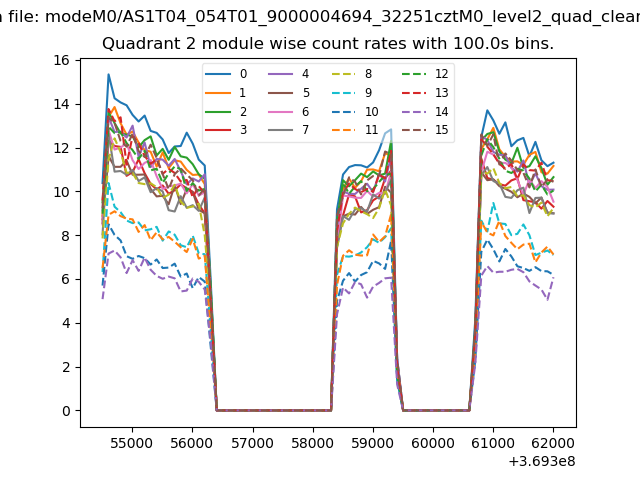
| Module-wise count rates for Quadrant A Data is divided into 100 sec bins |
 |
 |
| Module-wise count rates for Quadrant B Data is divided into 100 sec bins |
 |
 |
| Module-wise count rates for Quadrant C Data is divided into 100 sec bins |
 |
 |
| Module-wise count rates for Quadrant D Data is divided into 100 sec bins |
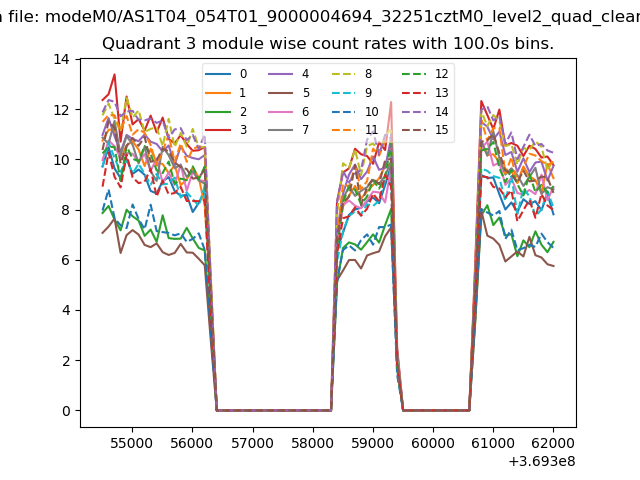 |
 |
| Parameter | Plot |
|---|---|
| CZT HV Monitor | 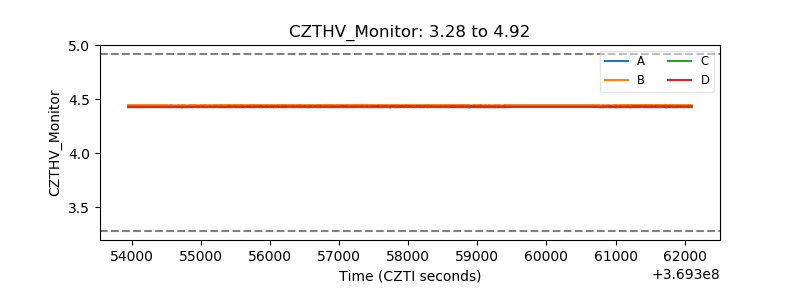 |
| D_VDD | 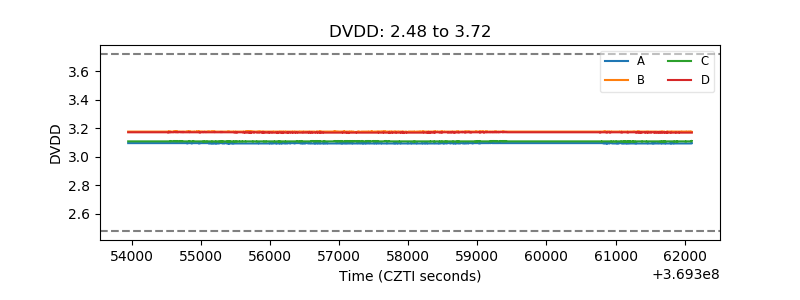 |
| Temperature 1 | 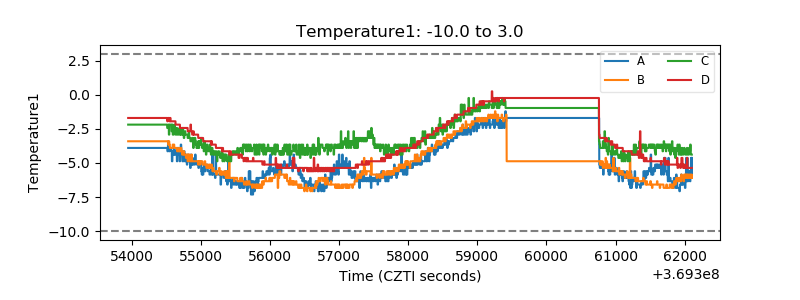 |
| Veto HV Monitor | 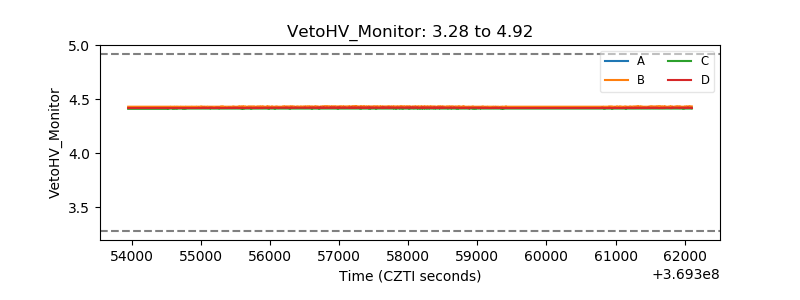 |
| Veto LLD | 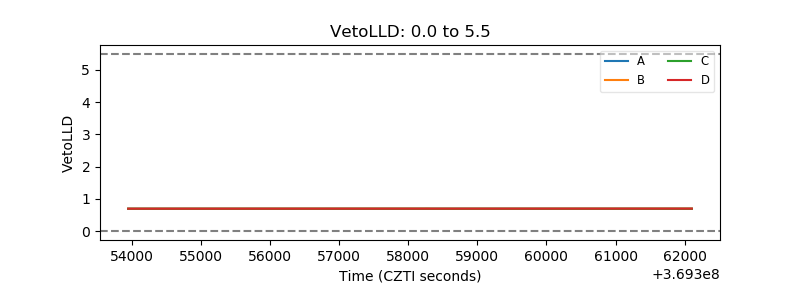 |
| Alpha Counter | 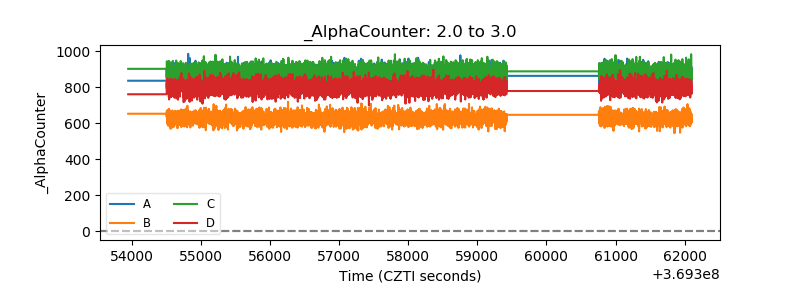 |
| _CPM_Rate | 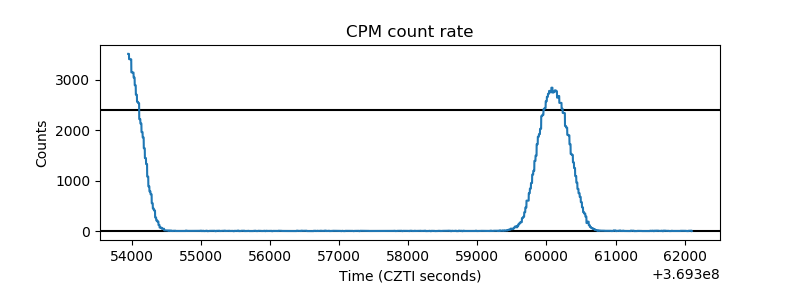 |
| CZT Counter | 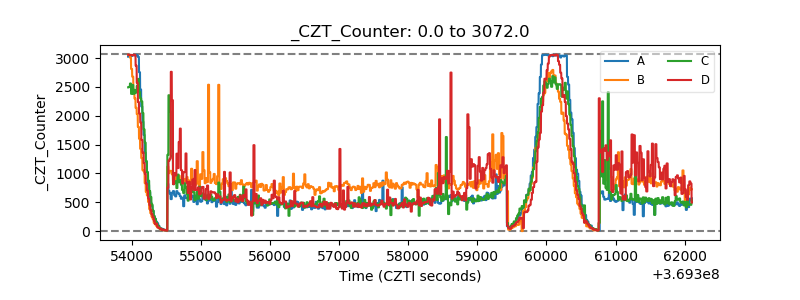 |
| +2.5 Volts monitor |  |
| +5 Volts monitor |  |
| _ROLL_ROT |  |
| _Roll_DEC | 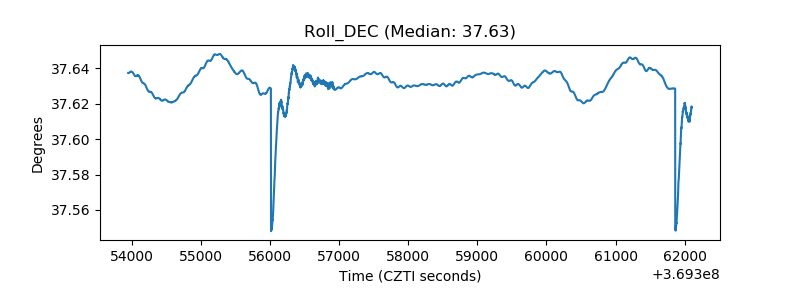 |
| _Roll_RA | 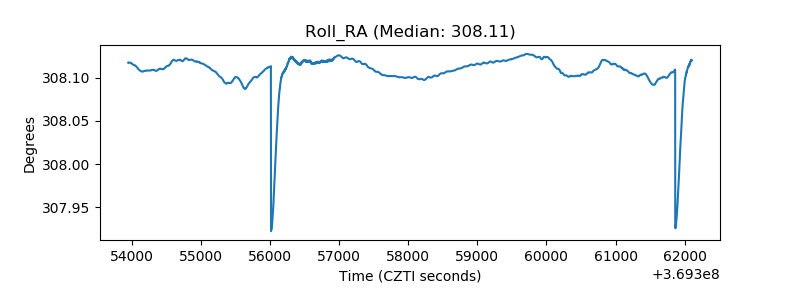 |
| Veto Counter | 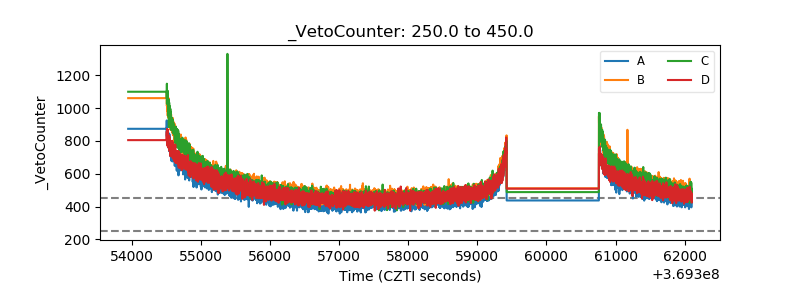 |