| Param | Original file | Final file |
|---|---|---|
| Filename | modeM0/AS1T04_054T01_9000004694_32252cztM0_level2.evt | modeM0/AS1T04_054T01_9000004694_32252cztM0_level2_quad_clean.evt |
| Size (bytes) | 545,523,840 | 90,043,200 |
| Size | 520.3 MB | 85.9 MB |
| Events in quadrant A | 3,039,297 | 592,355 |
| Events in quadrant B | 4,980,275 | 602,572 |
| Events in quadrant C | 3,486,889 | 570,287 |
| Events in quadrant D | 4,599,144 | 532,826 |
| Mode SS | |||
|---|---|---|---|
| Quadrant | BADHDUFLAG | Total packets | Discarded packets |
| A | 0 | 126 | 0 |
| B | 0 | 126 | 0 |
| C | 0 | 126 | 0 |
| D | 0 | 126 | 0 |
| Mode M0 | |||
|---|---|---|---|
| Quadrant | BADHDUFLAG | Total packets | Discarded packets |
| A | 0 | 12724 | 2 |
| B | 0 | 19052 | 1 |
| C | 0 | 14094 | 1 |
| D | 0 | 17806 | 1 |
| Mode M9 | |||
|---|---|---|---|
| Quadrant | BADHDUFLAG | Total packets | Discarded packets |
| A | 0 | 12 | 0 |
| B | 0 | 12 | 0 |
| C | 0 | 12 | 0 |
| D | 0 | 12 | 0 |
| Quadrant | Total seconds | Saturated seconds | Saturation percentage |
|---|---|---|---|
| A | 6137 | 30 | 0.488838% |
| B | 6137 | 145 | 2.362718% |
| C | 6137 | 153 | 2.493075% |
| D | 6137 | 206 | 3.356689% |
Noise dominated data is calculated using 1-second bins in cleaned event files. If a bin has >2000 counts, and if more than 50% of those come from <1% of pixels, then it is considered to be noise-dominated and hence unusable.
| Quadrant | # 1 sec bins | Bins with >0 counts | Bins with >2000 counts | High rate bins dominated by noise | Noise dominated (total time) | Noise dominated (detector-on time) | Marked lightcurve |
|---|---|---|---|---|---|---|---|
| A | 7397 | 6138 | 0 | 0 | 0.00% | 0.00% | 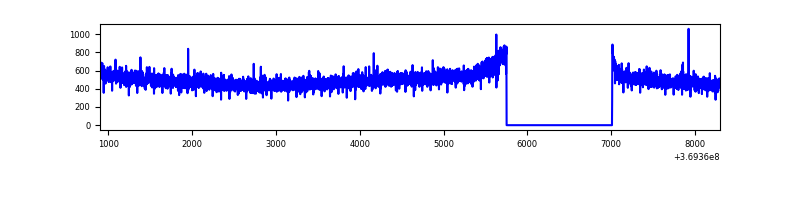 |
| B | 7397 | 6138 | 23 | 23 | 0.31% | 0.37% | 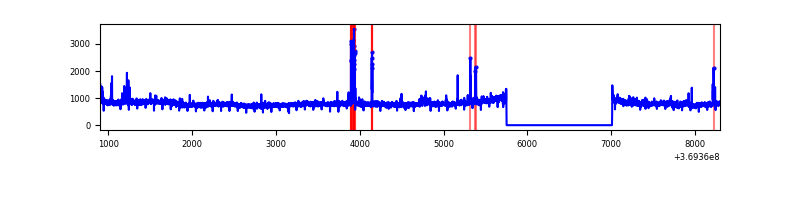 |
| C | 7397 | 6138 | 29 | 29 | 0.39% | 0.47% | 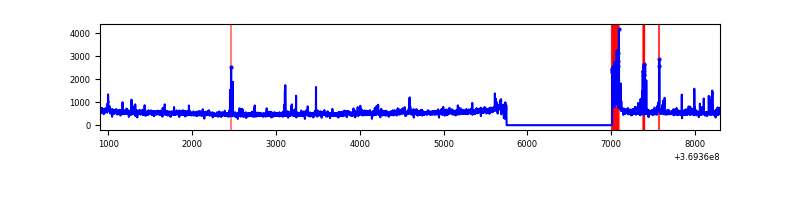 |
| D | 7397 | 6138 | 127 | 127 | 1.72% | 2.07% | 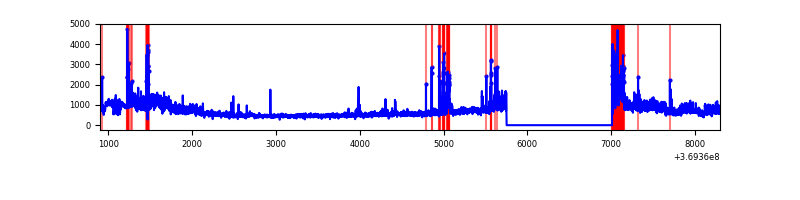 |
Top three noisy pixels from each quadrant. If the there are fewer than three noisy pixels in the level2.evt file, extra rows are filled as -1
| Pixel properties | Quadrant properties | ||||||
|---|---|---|---|---|---|---|---|
| Quadrant | DetID | PixID | Counts | Sigma | Mean | Median | Sigma |
| A | 13 | 254 | 11631 | 69.13 | 783 | 769 | 157.1 |
| A | 13 | 6 | 11173 | 66.21 | 783 | 769 | 157.1 |
| A | 3 | 137 | 7459 | 42.58 | 783 | 769 | 157.1 |
| B | 6 | 159 | 1703044 | 11573.59 | 783 | 764 | 147.1 |
| B | 10 | 247 | 66119 | 444.34 | 783 | 764 | 147.1 |
| B | 4 | 80 | 52362 | 350.81 | 783 | 764 | 147.1 |
| C | 0 | 10 | 216354 | 1223.5 | 753 | 758 | 176.2 |
| C | 3 | 233 | 141988 | 801.48 | 753 | 758 | 176.2 |
| C | 14 | 238 | 128700 | 726.07 | 753 | 758 | 176.2 |
| D | 8 | 195 | 1297035 | 7261.61 | 740 | 721 | 178.5 |
| D | 12 | 233 | 327312 | 1829.48 | 740 | 721 | 178.5 |
| D | 2 | 250 | 80114 | 444.74 | 740 | 721 | 178.5 |
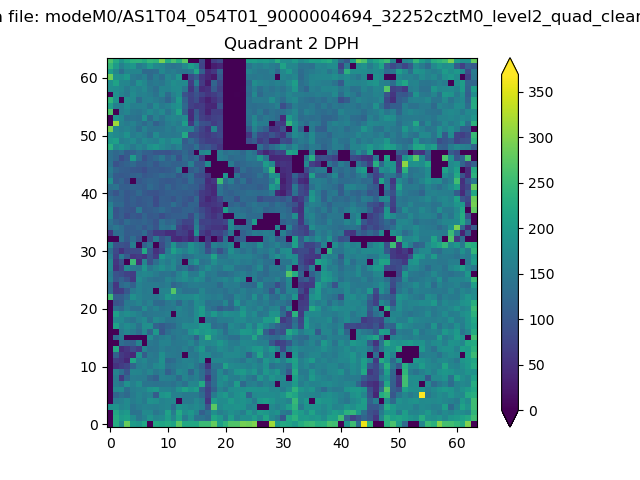
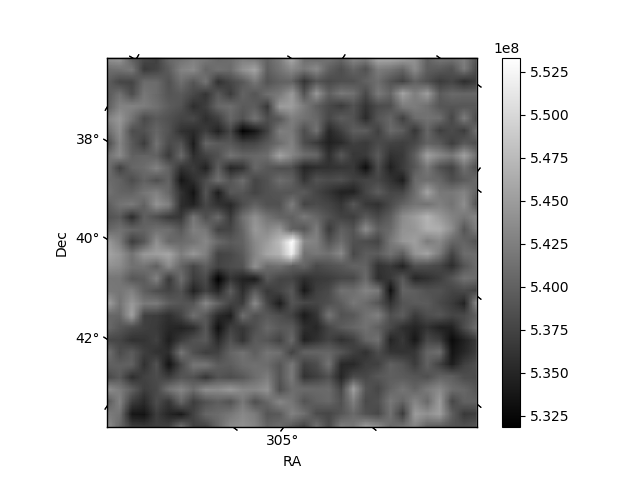
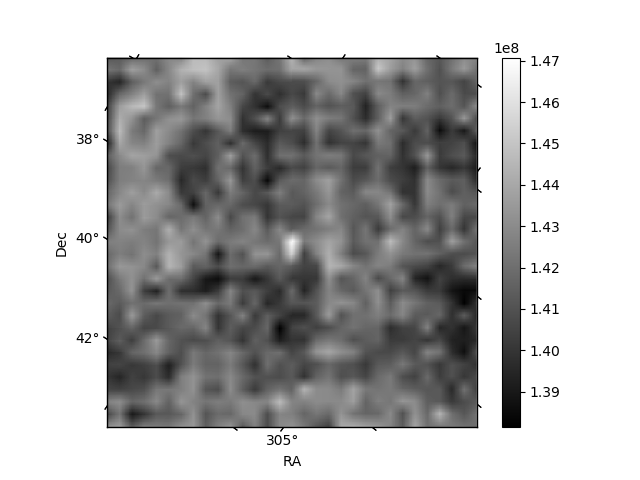
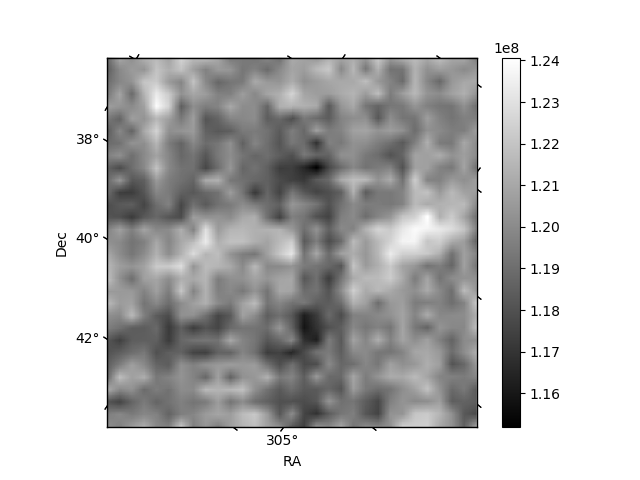
Histogram calculated using DETX and DETY for each event in the final _common_clean file
| Quadrant A | 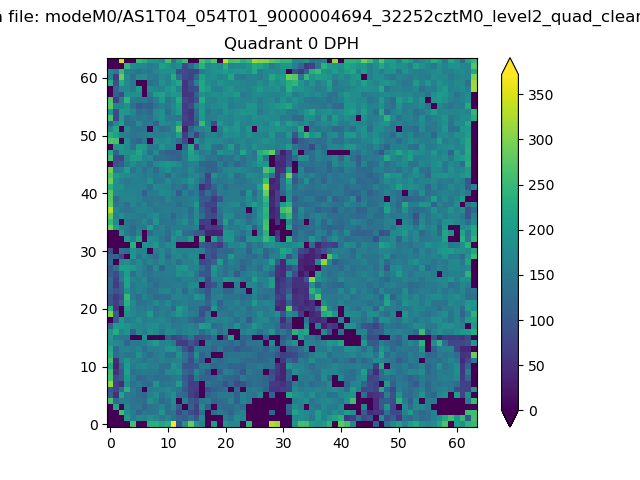 |
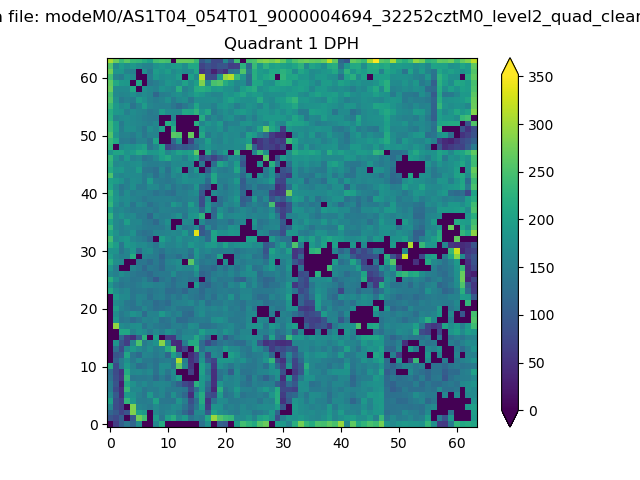 |
Quadrant B |
|---|---|---|---|
| Quadrant D | 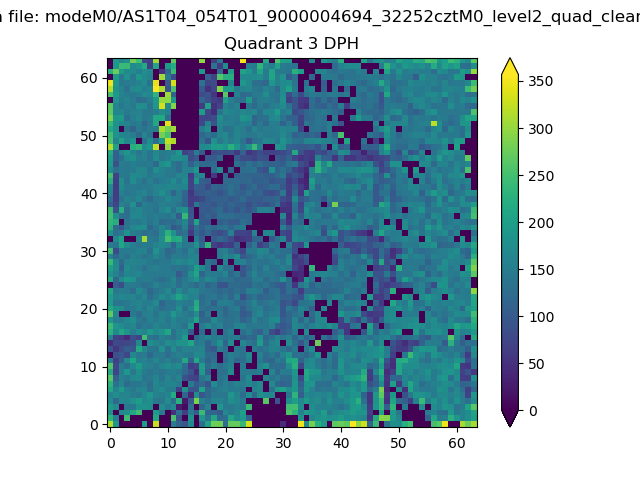 |
 |
Quadrant C |
| Plot type | Count rate plots | Images |
|---|---|---|
| Comparison with Poisson distribution Blue bars denote a histogram of data divided into 1 sec bins. Red curve is a Poisson curve with rate = median count rate of data. |
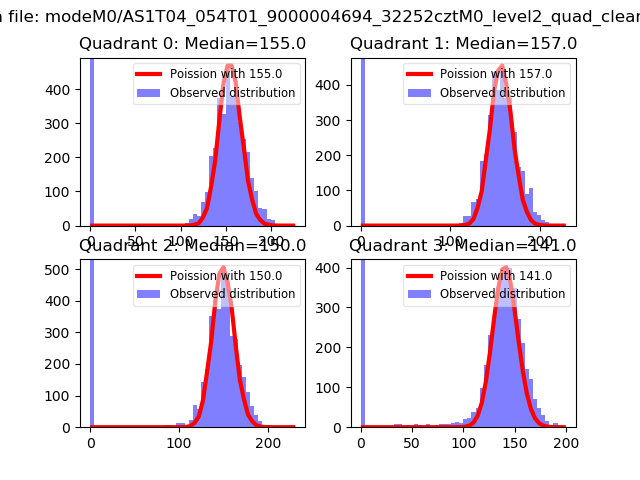 |
 |
| Quadrant-wise count rates Data is divided into 100 sec bins |
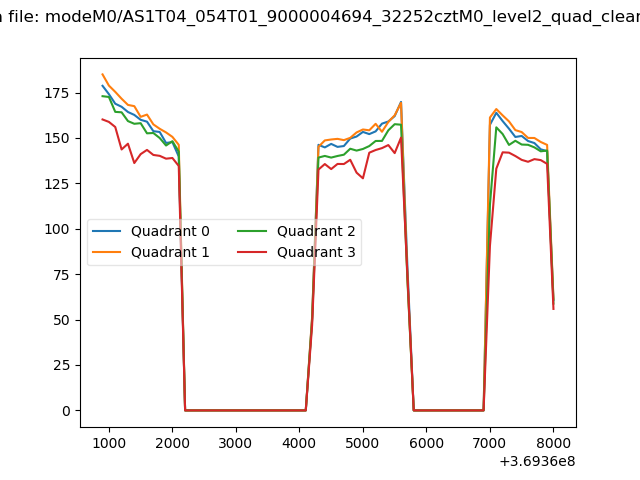 |
|
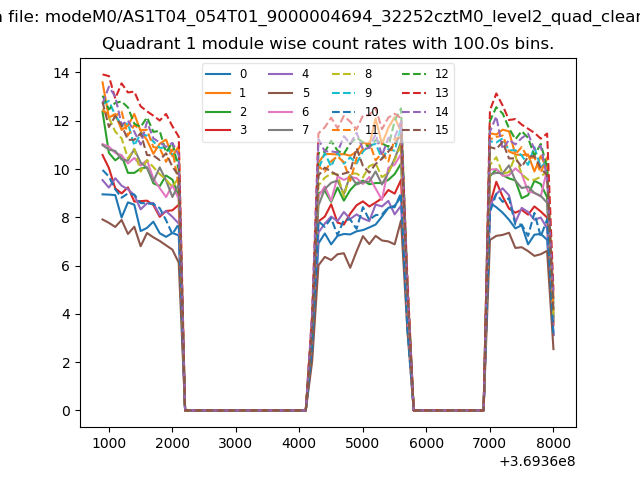
| Module-wise count rates for Quadrant A Data is divided into 100 sec bins |
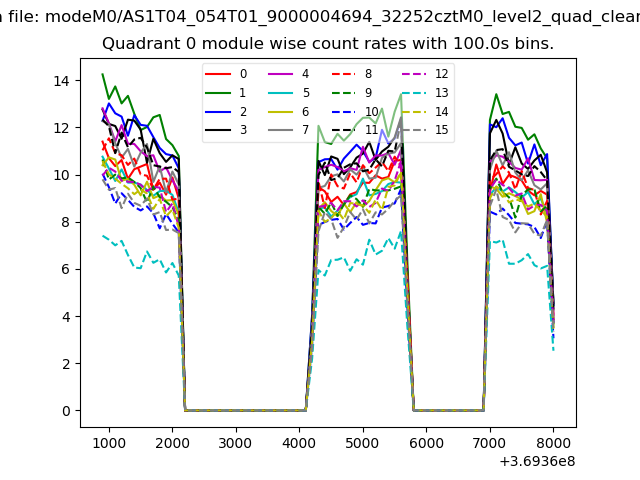 |
 |
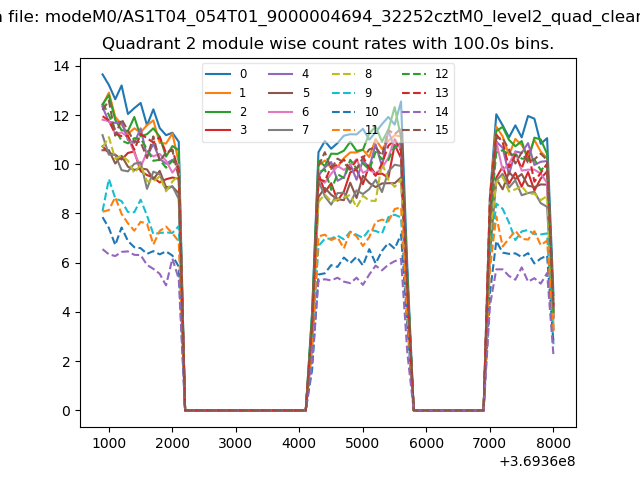
| Module-wise count rates for Quadrant B Data is divided into 100 sec bins |
 |
 |
| Module-wise count rates for Quadrant C Data is divided into 100 sec bins |
 |
 |
| Module-wise count rates for Quadrant D Data is divided into 100 sec bins |
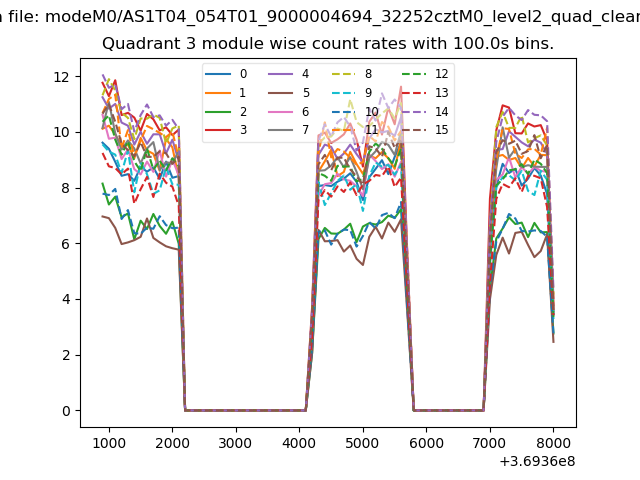 |
 |
| Parameter | Plot |
|---|---|
| CZT HV Monitor | 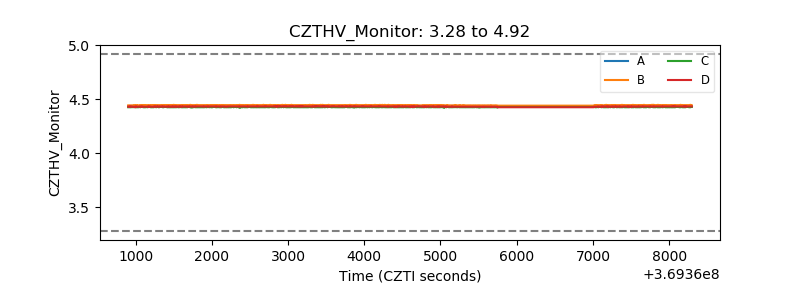 |
| D_VDD | 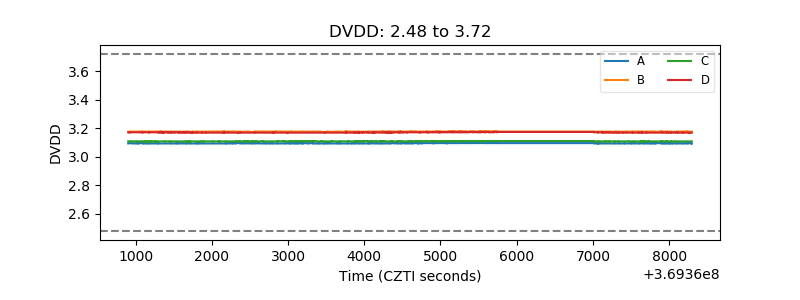 |
| Temperature 1 | 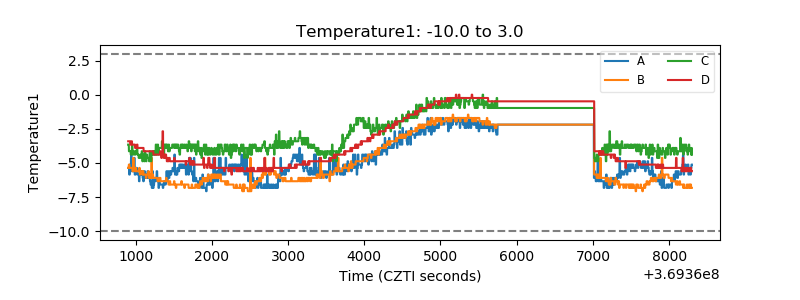 |
| Veto HV Monitor | 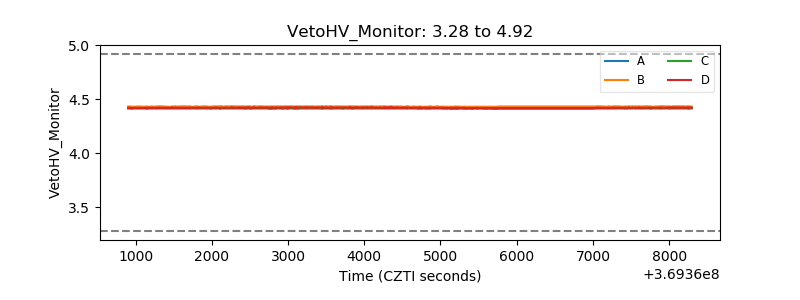 |
| Veto LLD | 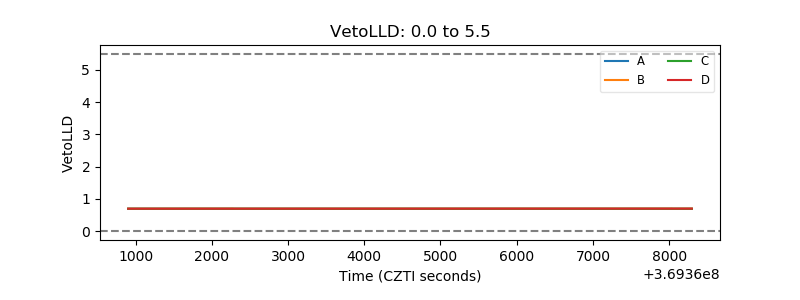 |
| Alpha Counter | 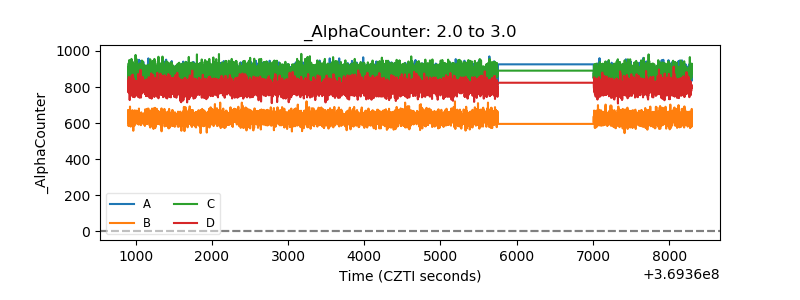 |
| _CPM_Rate | 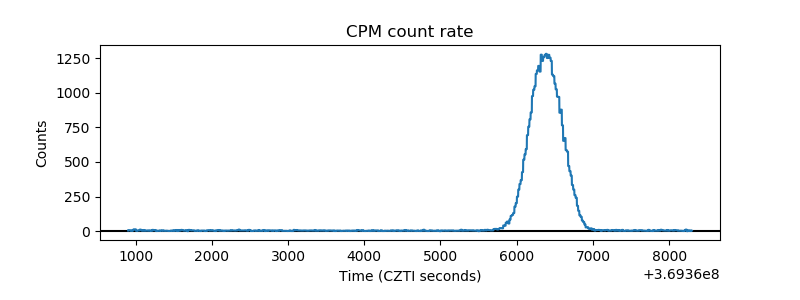 |
| CZT Counter | 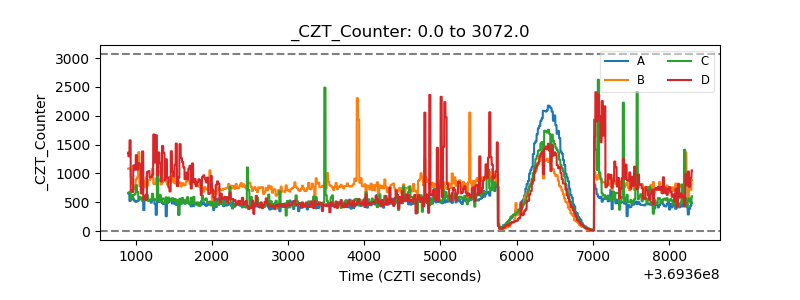 |
| +2.5 Volts monitor |  |
| +5 Volts monitor |  |
| _ROLL_ROT | 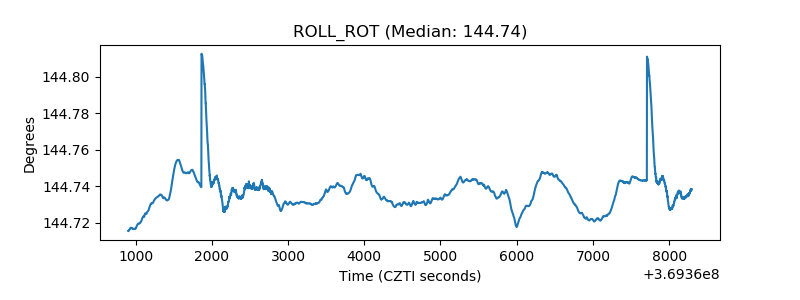 |
| _Roll_DEC | 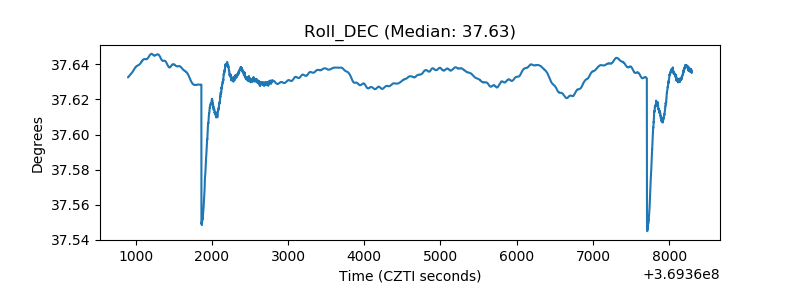 |
| _Roll_RA | 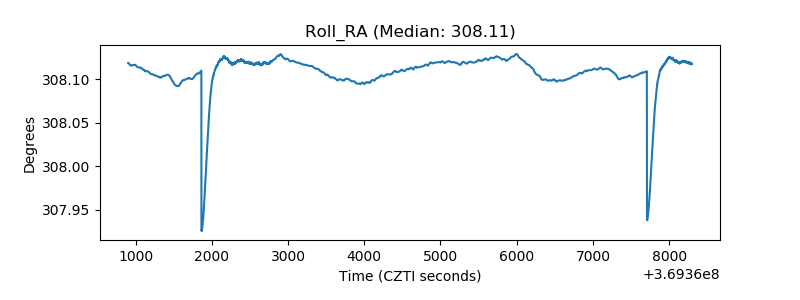 |
| Veto Counter | 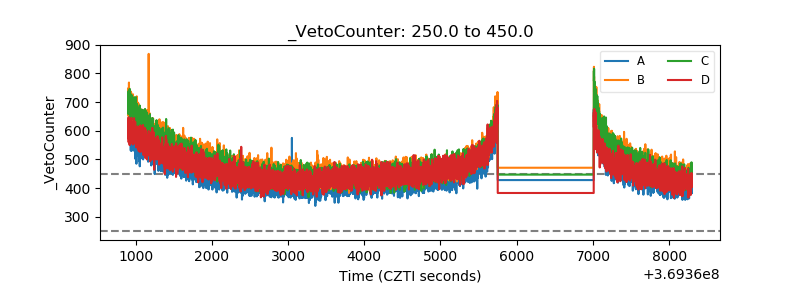 |