| Param | Original file | Final file |
|---|---|---|
| Filename | modeM0/AS1T04_054T01_9000004694_32255cztM0_level2.evt | modeM0/AS1T04_054T01_9000004694_32255cztM0_level2_quad_clean.evt |
| Size (bytes) | 389,995,200 | 45,005,760 |
| Size | 371.9 MB | 42.9 MB |
| Events in quadrant A | 1,994,171 | 281,880 |
| Events in quadrant B | 3,558,633 | 263,162 |
| Events in quadrant C | 2,230,481 | 271,011 |
| Events in quadrant D | 3,746,289 | 254,377 |
| Mode SS | |||
|---|---|---|---|
| Quadrant | BADHDUFLAG | Total packets | Discarded packets |
| A | 0 | 84 | 0 |
| B | 0 | 84 | 0 |
| C | 0 | 84 | 0 |
| D | 0 | 84 | 0 |
| Mode M0 | |||
|---|---|---|---|
| Quadrant | BADHDUFLAG | Total packets | Discarded packets |
| A | 0 | 8612 | 1 |
| B | 0 | 13691 | 1 |
| C | 0 | 9146 | 1 |
| D | 0 | 14127 | 1 |
| Mode M9 | |||
|---|---|---|---|
| Quadrant | BADHDUFLAG | Total packets | Discarded packets |
| A | 0 | 5 | 0 |
| B | 0 | 5 | 0 |
| C | 0 | 5 | 0 |
| D | 0 | 5 | 0 |
| Quadrant | Total seconds | Saturated seconds | Saturation percentage |
|---|---|---|---|
| A | 4142 | 101 | 2.438436% |
| B | 4142 | 334 | 8.063737% |
| C | 4142 | 225 | 5.432158% |
| D | 4142 | 242 | 5.842588% |
Noise dominated data is calculated using 1-second bins in cleaned event files. If a bin has >2000 counts, and if more than 50% of those come from <1% of pixels, then it is considered to be noise-dominated and hence unusable.
| Quadrant | # 1 sec bins | Bins with >0 counts | Bins with >2000 counts | High rate bins dominated by noise | Noise dominated (total time) | Noise dominated (detector-on time) | Marked lightcurve |
|---|---|---|---|---|---|---|---|
| A | 4642 | 4143 | 0 | 0 | 0.00% | 0.00% | 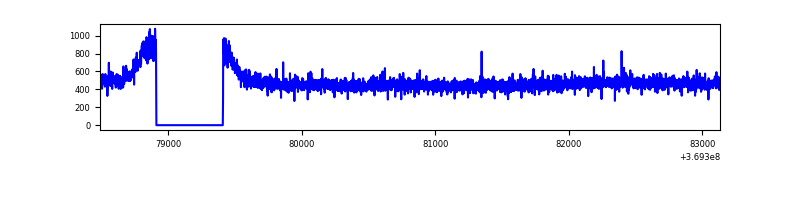 |
| B | 4642 | 4142 | 130 | 130 | 2.80% | 3.14% | 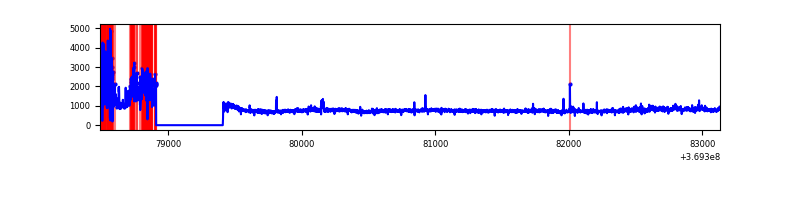 |
| C | 4642 | 4143 | 12 | 12 | 0.26% | 0.29% | 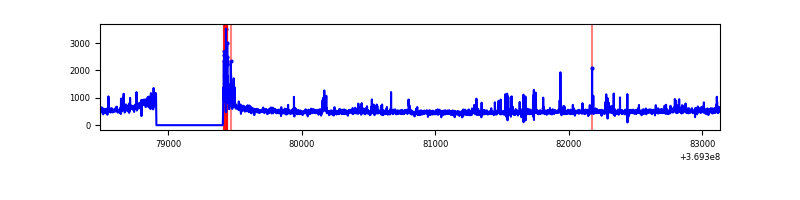 |
| D | 4642 | 4143 | 104 | 104 | 2.24% | 2.51% | 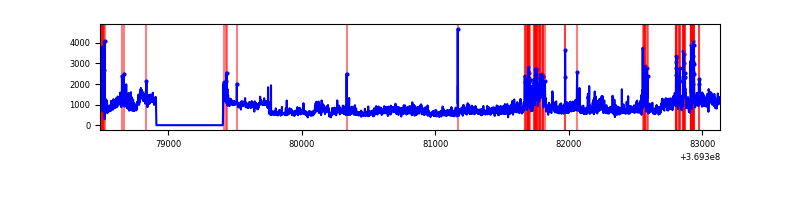 |
Top three noisy pixels from each quadrant. If the there are fewer than three noisy pixels in the level2.evt file, extra rows are filled as -1
| Pixel properties | Quadrant properties | ||||||
|---|---|---|---|---|---|---|---|
| Quadrant | DetID | PixID | Counts | Sigma | Mean | Median | Sigma |
| A | 13 | 6 | 8292 | 74.4 | 514 | 504 | 104.7 |
| A | 13 | 254 | 7929 | 70.94 | 514 | 504 | 104.7 |
| A | 3 | 137 | 5636 | 49.03 | 514 | 504 | 104.7 |
| B | 6 | 159 | 1064904 | 11064.77 | 484 | 470 | 96.2 |
| B | 4 | 80 | 557079 | 5785.94 | 484 | 470 | 96.2 |
| B | 0 | 190 | 16056 | 162.01 | 484 | 470 | 96.2 |
| C | 14 | 238 | 107251 | 924.58 | 486 | 488 | 115.5 |
| C | 0 | 10 | 94836 | 817.07 | 486 | 488 | 115.5 |
| C | 3 | 233 | 71311 | 613.34 | 486 | 488 | 115.5 |
| D | 8 | 195 | 1425025 | 12170.9 | 486 | 472 | 117.0 |
| D | 12 | 233 | 357268 | 3048.34 | 486 | 472 | 117.0 |
| D | 13 | 249 | 58550 | 496.2 | 486 | 472 | 117.0 |
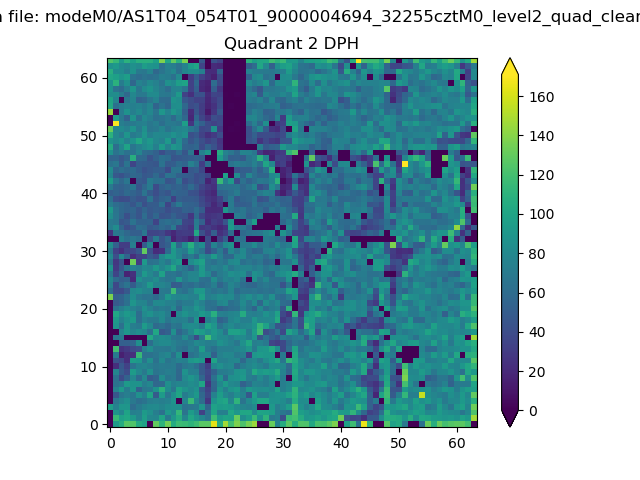
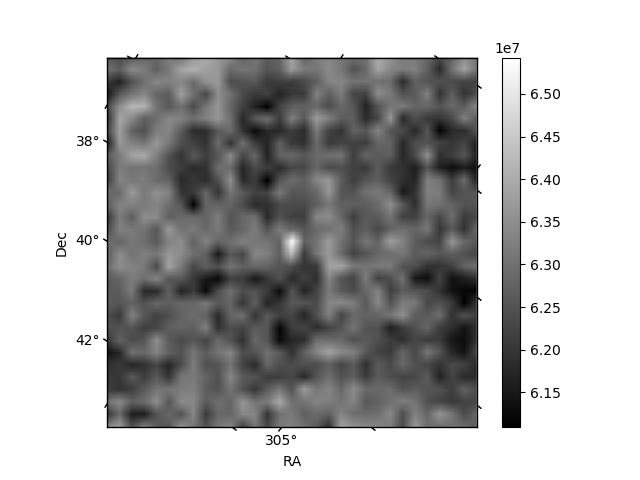
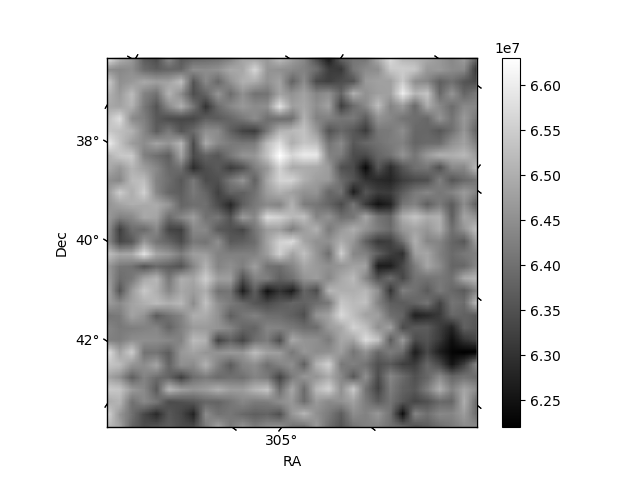
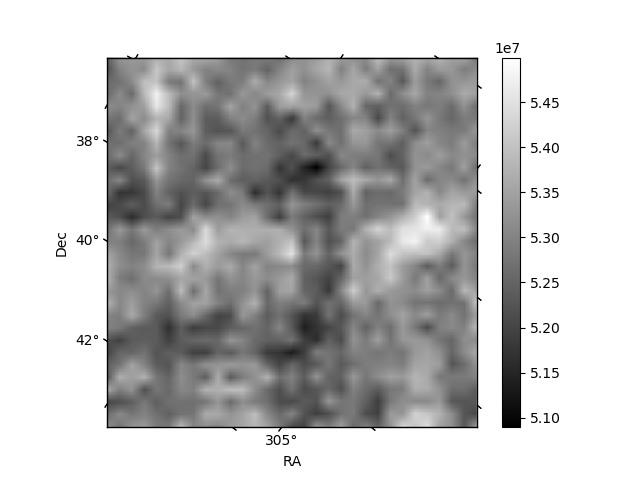
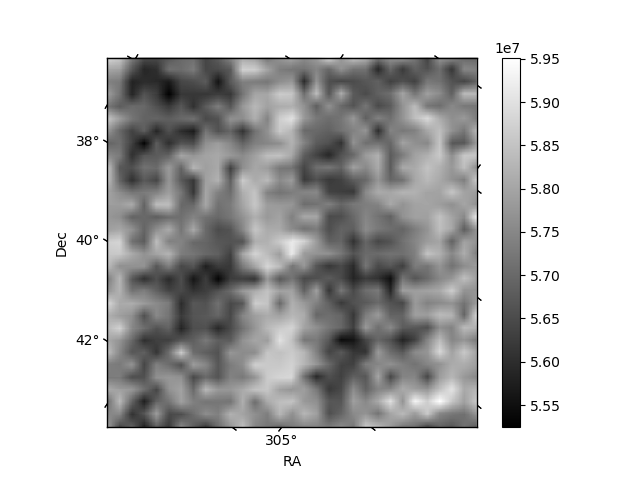
Histogram calculated using DETX and DETY for each event in the final _common_clean file
| Quadrant A |  |
 |
Quadrant B |
|---|---|---|---|
| Quadrant D | 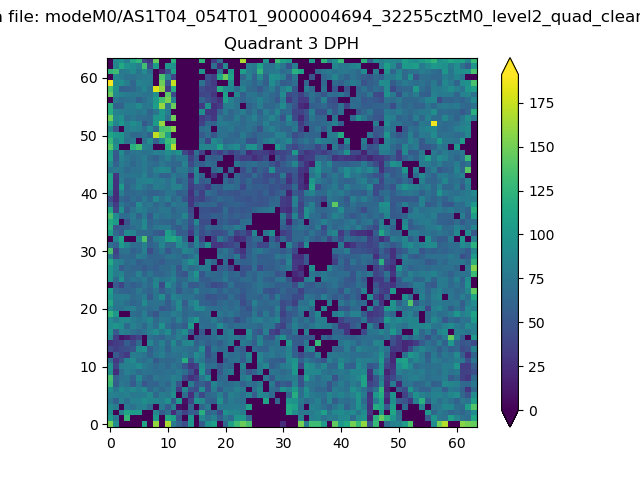 |
 |
Quadrant C |
| Plot type | Count rate plots | Images |
|---|---|---|
| Comparison with Poisson distribution Blue bars denote a histogram of data divided into 1 sec bins. Red curve is a Poisson curve with rate = median count rate of data. |
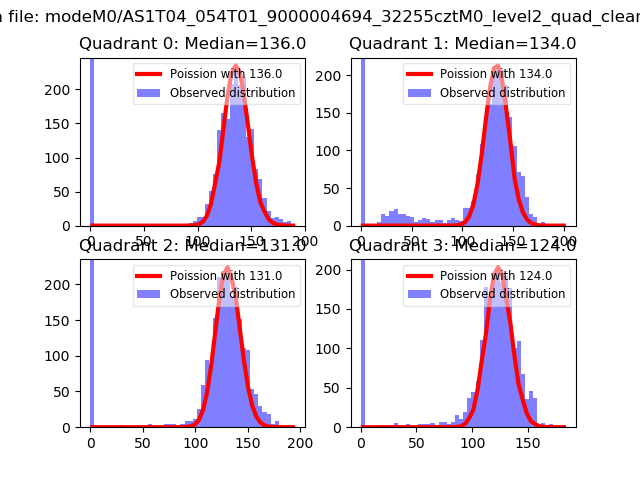 |
 |
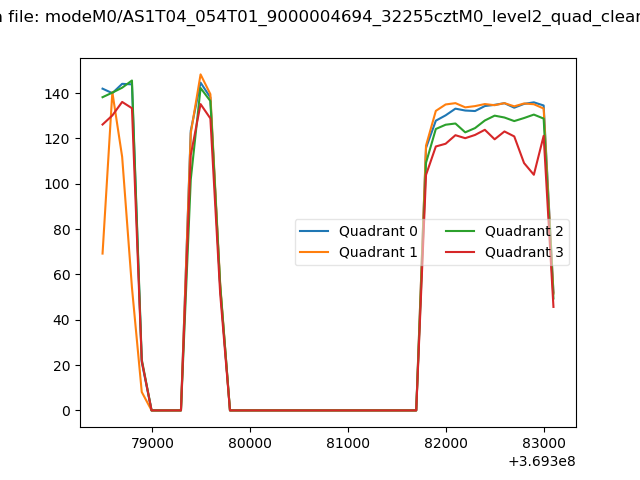
| Quadrant-wise count rates Data is divided into 100 sec bins |
 |
|
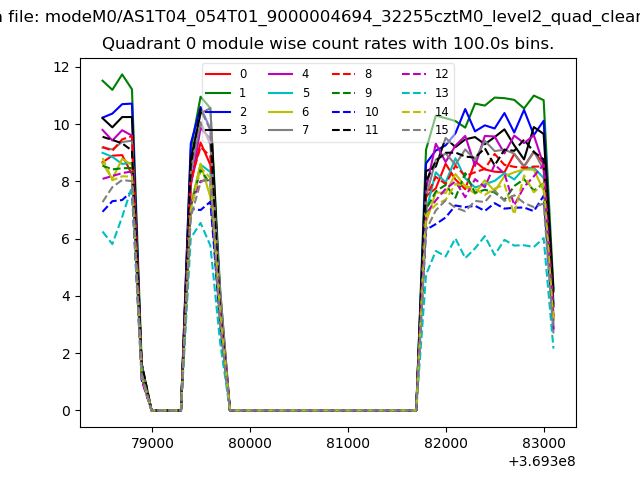
| Module-wise count rates for Quadrant A Data is divided into 100 sec bins |
 |
 |
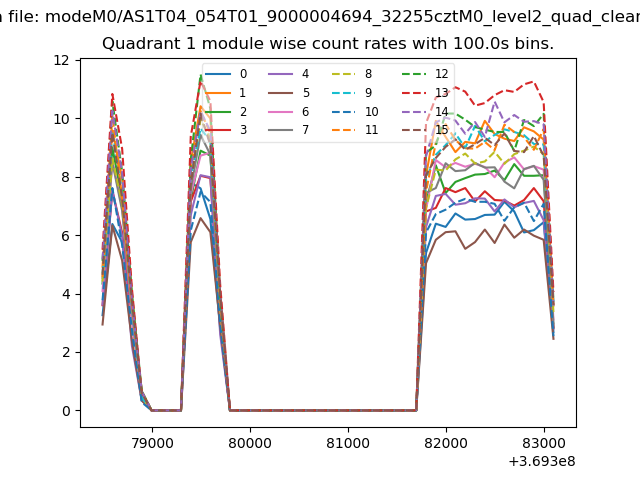
| Module-wise count rates for Quadrant B Data is divided into 100 sec bins |
 |
 |
| Module-wise count rates for Quadrant C Data is divided into 100 sec bins |
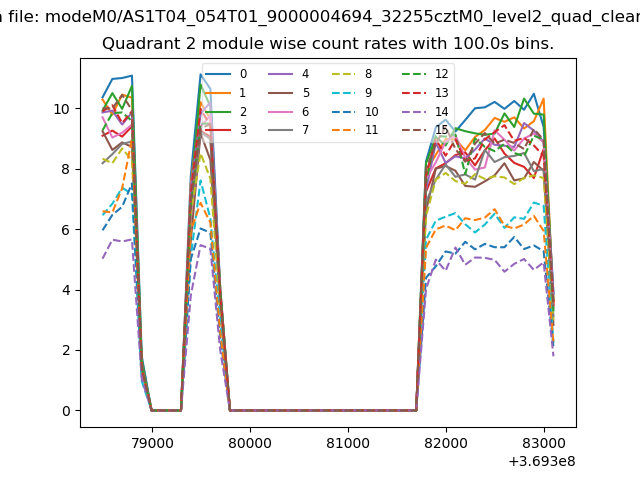 |
 |
| Module-wise count rates for Quadrant D Data is divided into 100 sec bins |
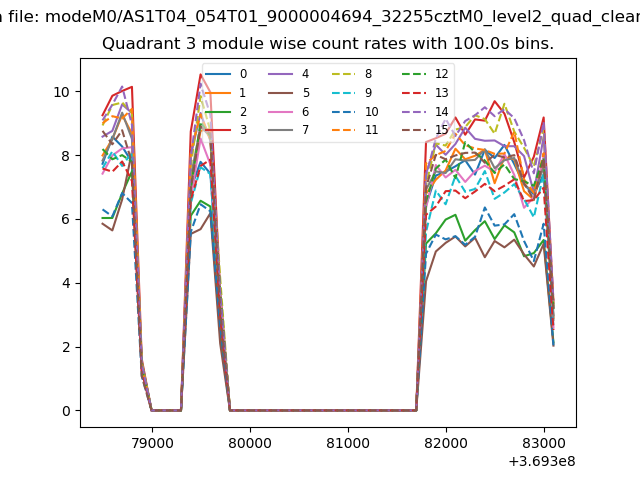 |
 |
| Parameter | Plot |
|---|---|
| CZT HV Monitor | 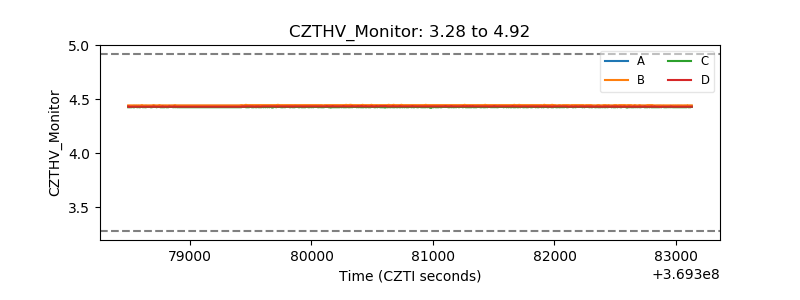 |
| D_VDD | 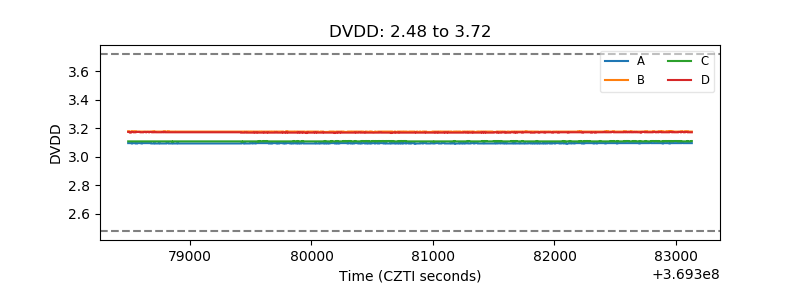 |
| Temperature 1 |  |
| Veto HV Monitor | 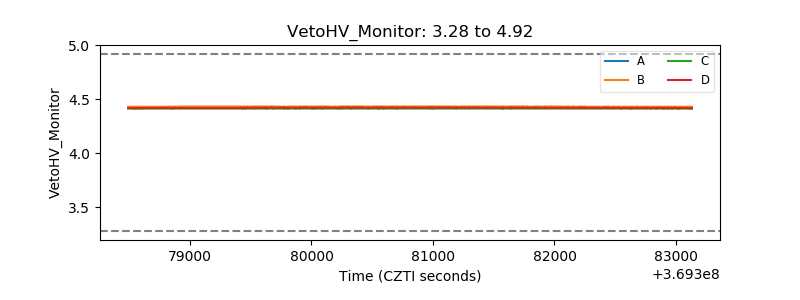 |
| Veto LLD |  |
| Alpha Counter | 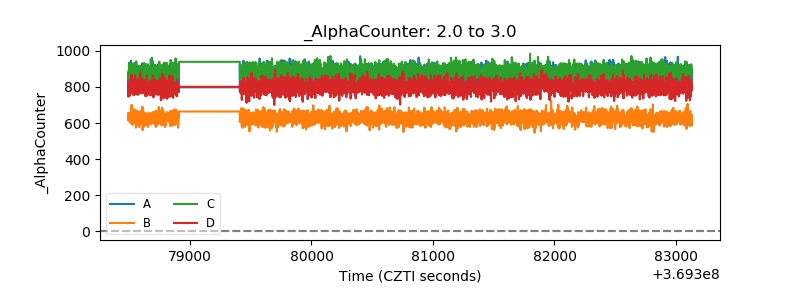 |
| _CPM_Rate | 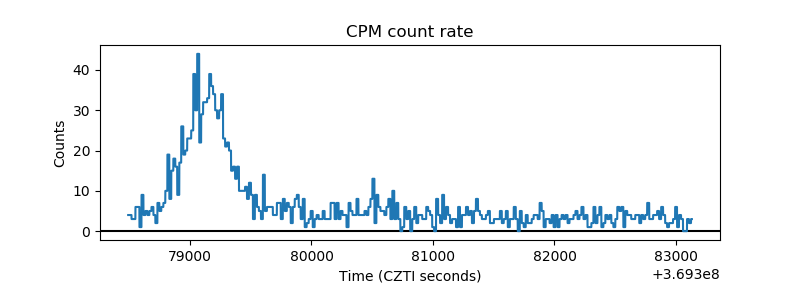 |
| CZT Counter | 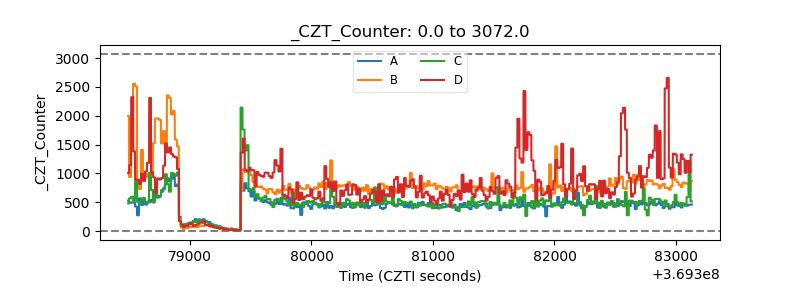 |
| +2.5 Volts monitor |  |
| +5 Volts monitor | 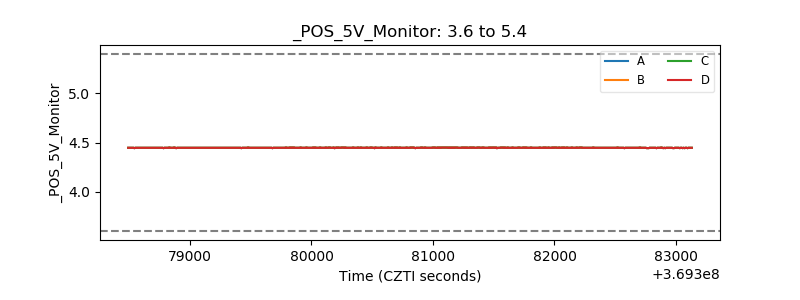 |
| _ROLL_ROT | 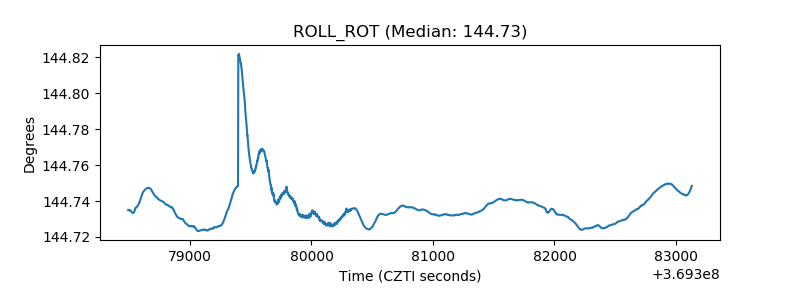 |
| _Roll_DEC | 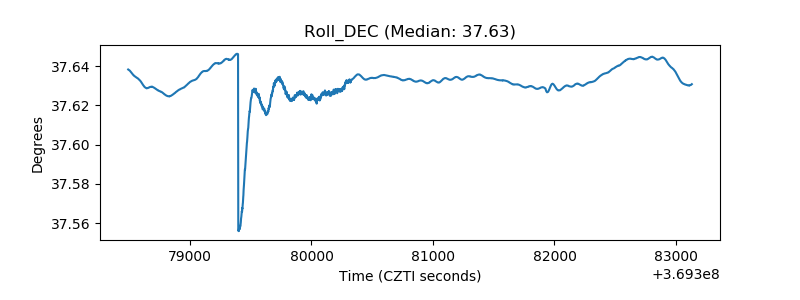 |
| _Roll_RA | 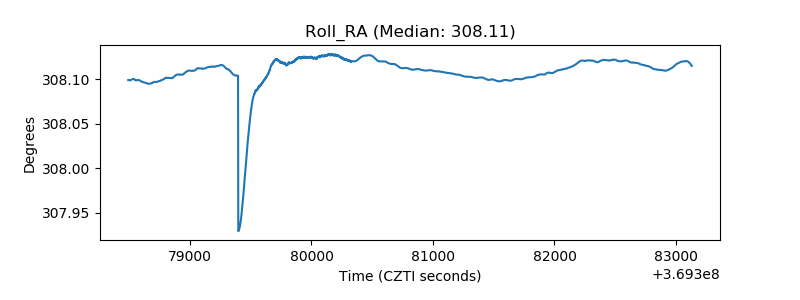 |
| Veto Counter | 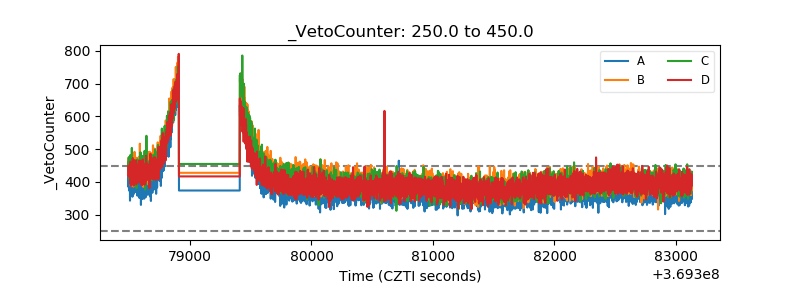 |