| Param | Original file | Final file |
|---|---|---|
| Filename | modeM0/AS1A09_131T01_9000004696cztM0_level2.fits | modeM0/AS1A09_131T01_9000004696cztM0_level2_quad_clean.evt |
| Size (bytes) | 1,632,818,880 | 1,911,052,800 |
| Size | 1.5 GB | 1.8 GB |
| Events in quadrant A | 10,198,226 | 12,301,866 |
| Events in quadrant B | 9,514,380 | 12,092,659 |
| Events in quadrant C | 9,915,438 | 11,996,365 |
| Events in quadrant D | 8,076,444 | 9,761,769 |
| Mode SS | |||
|---|---|---|---|
| Quadrant | BADHDUFLAG | Total packets | Discarded packets |
| A | 0 | 3490 | 0 |
| B | 0 | 3490 | 0 |
| C | 0 | 3490 | 0 |
| D | 0 | 3490 | 0 |
| Mode M9 | |||
|---|---|---|---|
| Quadrant | BADHDUFLAG | Total packets | Discarded packets |
| A | 0 | 237 | 0 |
| B | 0 | 238 | 0 |
| C | 0 | 238 | 0 |
| D | 0 | 238 | 0 |
| Mode M0 | |||
|---|---|---|---|
| Quadrant | BADHDUFLAG | Total packets | Discarded packets |
| A | 0 | 355811 | 0 |
| B | 0 | 559561 | 0 |
| C | 0 | 384052 | 0 |
| D | 0 | 667191 | 0 |
| Quadrant | Total seconds | Saturated seconds | Saturation percentage |
|---|---|---|---|
| A | 171199 | 2076 | 1.212624% |
| B | 171199 | 8169 | 4.771640% |
| C | 171199 | 5796 | 3.385534% |
| D | 171199 | 27746 | 16.206870% |
Noise dominated data is calculated using 1-second bins in cleaned event files. If a bin has >2000 counts, and if more than 50% of those come from <1% of pixels, then it is considered to be noise-dominated and hence unusable.
| Quadrant | # 1 sec bins | Bins with >0 counts | Bins with >2000 counts | High rate bins dominated by noise | Noise dominated (total time) | Noise dominated (detector-on time) | Marked lightcurve |
|---|---|---|---|---|---|---|---|
| A | 205873 | 171199 | 0 | 0 | 0.00% | 0.00% |  |
| B | 205873 | 171185 | 0 | 0 | 0.00% | 0.00% | 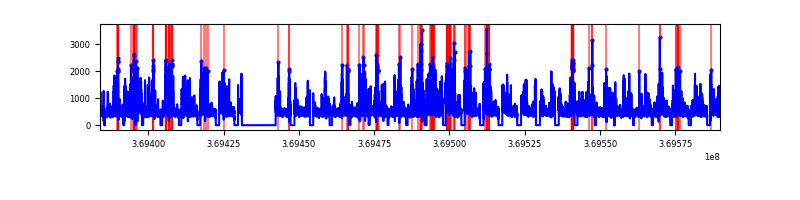 |
| C | 205873 | 171015 | 0 | 0 | 0.00% | 0.00% |  |
| D | 205873 | 171012 | 0 | 0 | 0.00% | 0.00% | 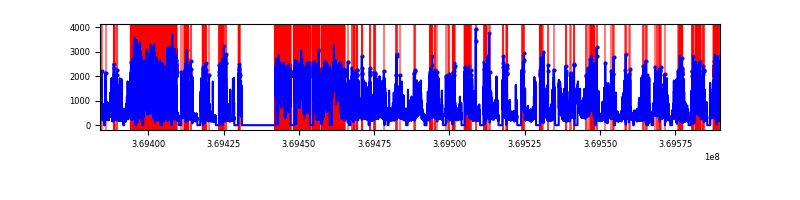 |
Top three noisy pixels from each quadrant. If the there are fewer than three noisy pixels in the level2.evt file, extra rows are filled as -1
| Pixel properties | Quadrant properties | ||||||
|---|---|---|---|---|---|---|---|
| Quadrant | DetID | PixID | Counts | Sigma | Mean | Median | Sigma |
| A | 0 | 29 | 10211 | 11.84 | 2657 | 2501 | 651.1 |
| A | 7 | 110 | 8354 | 8.99 | 2657 | 2501 | 651.1 |
| A | 0 | 30 | 7904 | 8.3 | 2657 | 2501 | 651.1 |
| B | 2 | 9 | 7730 | 10.76 | 2525 | 2420 | 493.6 |
| B | 2 | 8 | 6433 | 8.13 | 2525 | 2420 | 493.6 |
| B | 3 | 80 | 6429 | 8.12 | 2525 | 2420 | 493.6 |
| C | 12 | 241 | 7174 | 7.2 | 2630 | 2476 | 652.3 |
| C | 9 | 209 | 6834 | 6.68 | 2630 | 2476 | 652.3 |
| C | 3 | 187 | 6772 | 6.59 | 2630 | 2476 | 652.3 |
| D | 4 | 246 | 6248 | 6.77 | 2309 | 2100 | 612.5 |
| D | 10 | 189 | 5909 | 6.22 | 2309 | 2100 | 612.5 |
| D | 3 | 14 | 5895 | 6.2 | 2309 | 2100 | 612.5 |
Histogram calculated using DETX and DETY for each event in the final _common_clean file
| Quadrant A | 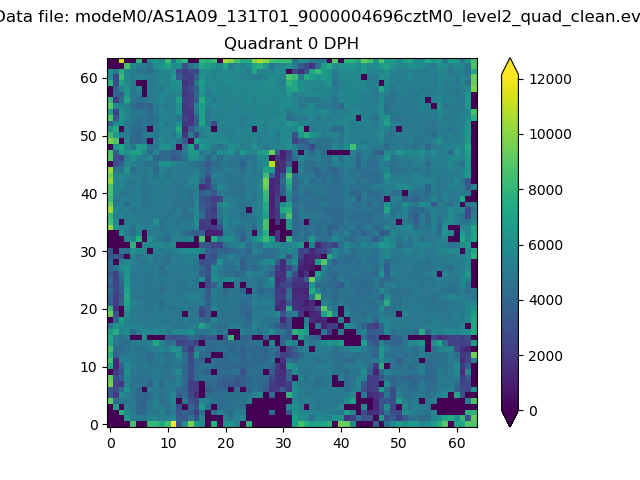 |
 |
Quadrant B |
|---|---|---|---|
| Quadrant D | 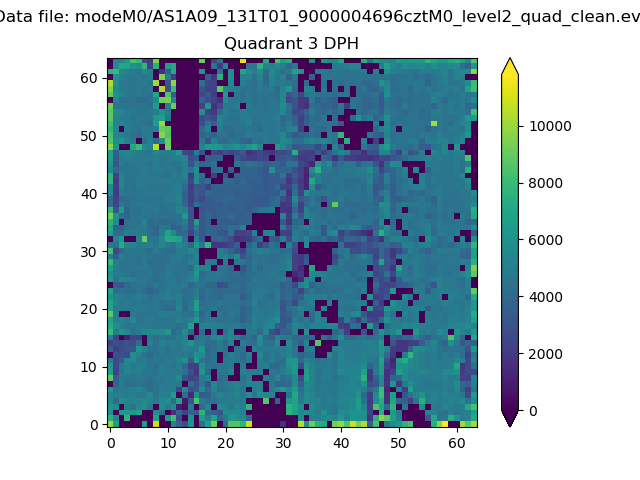 |
 |
Quadrant C |
| Plot type | Count rate plots | Images |
|---|---|---|
| Comparison with Poisson distribution Blue bars denote a histogram of data divided into 1 sec bins. Red curve is a Poisson curve with rate = median count rate of data. |
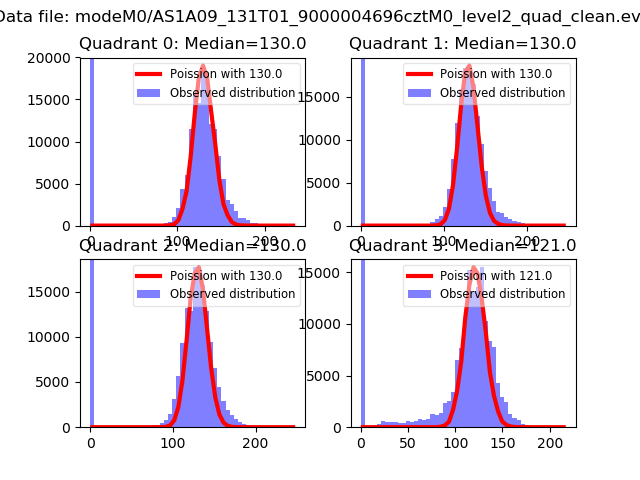 |
 |
| Quadrant-wise count rates Data is divided into 100 sec bins |
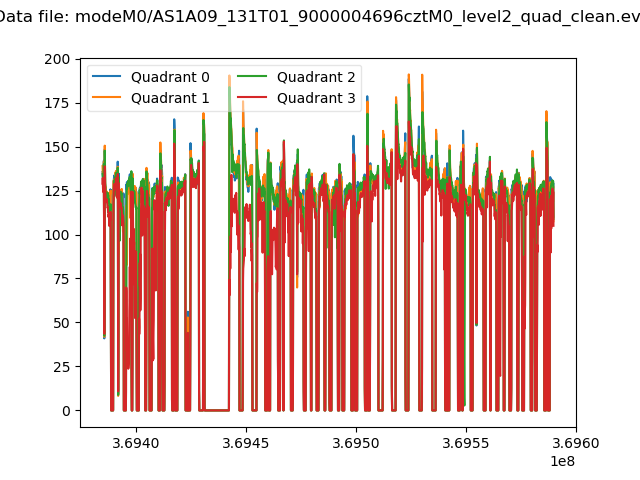 |
|
| Module-wise count rates for Quadrant A Data is divided into 100 sec bins |
 |
 |
| Module-wise count rates for Quadrant B Data is divided into 100 sec bins |
 |
 |
| Module-wise count rates for Quadrant C Data is divided into 100 sec bins |
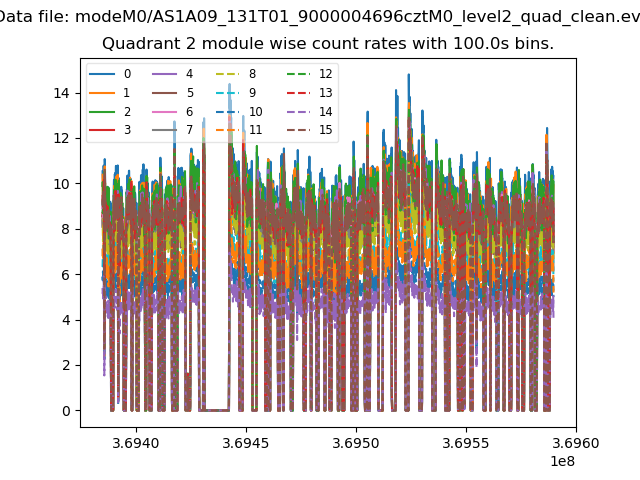 |
 |
| Module-wise count rates for Quadrant D Data is divided into 100 sec bins |
 |
 |
| Parameter | Plot |
|---|---|
| CZT HV Monitor |  |
| D_VDD | 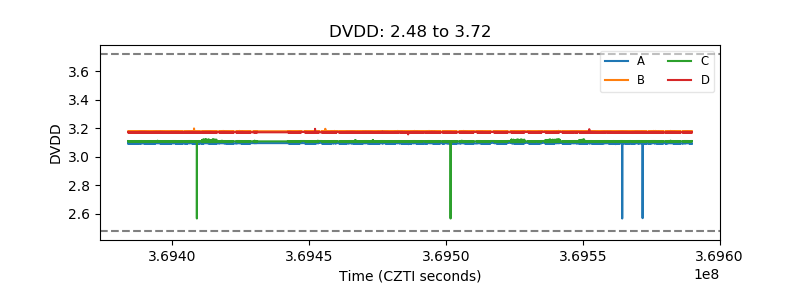 |
| Temperature 1 |  |
| Veto HV Monitor |  |
| Veto LLD |  |
| Alpha Counter | 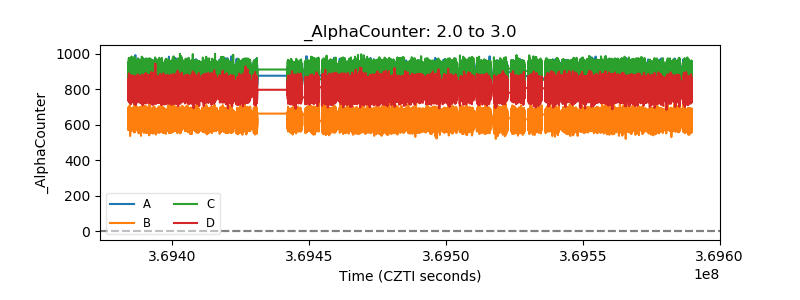 |
| _CPM_Rate | 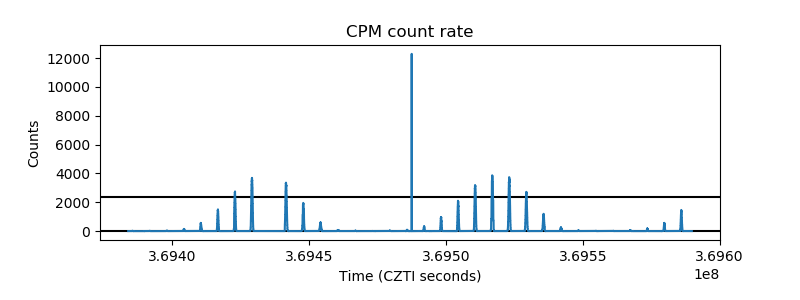 |
| CZT Counter |  |
| +2.5 Volts monitor |  |
| +5 Volts monitor | 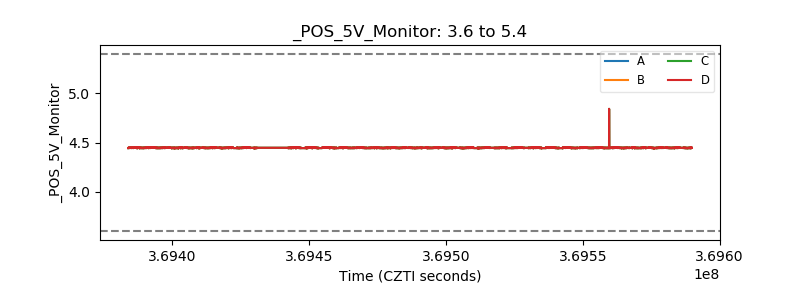 |
| _ROLL_ROT |  |
| _Roll_DEC | 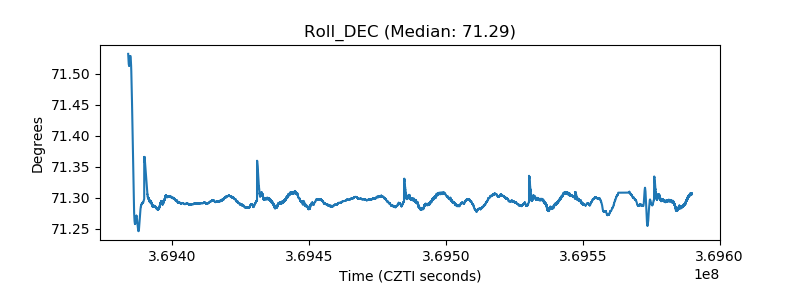 |
| _Roll_RA | 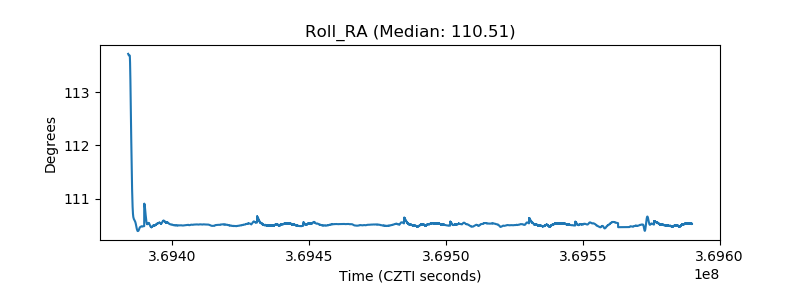 |
| Veto Counter |  |