| Param | Original file | Final file |
|---|---|---|
| Filename | modeM0/AS1A09_131T01_9000004696_32256cztM0_level2.evt | modeM0/AS1A09_131T01_9000004696_32256cztM0_level2_quad_clean.evt |
| Size (bytes) | 609,508,800 | 115,041,600 |
| Size | 581.3 MB | 109.7 MB |
| Events in quadrant A | 3,282,542 | 761,186 |
| Events in quadrant B | 5,867,655 | 755,522 |
| Events in quadrant C | 3,644,883 | 748,286 |
| Events in quadrant D | 5,182,863 | 723,980 |
| Mode SS | |||
|---|---|---|---|
| Quadrant | BADHDUFLAG | Total packets | Discarded packets |
| A | 0 | 146 | 0 |
| B | 0 | 146 | 0 |
| C | 0 | 146 | 0 |
| D | 0 | 146 | 0 |
| Mode M9 | |||
|---|---|---|---|
| Quadrant | BADHDUFLAG | Total packets | Discarded packets |
| A | 0 | 2 | 0 |
| B | 0 | 2 | 0 |
| C | 0 | 2 | 0 |
| D | 0 | 2 | 0 |
| Mode M0 | |||
|---|---|---|---|
| Quadrant | BADHDUFLAG | Total packets | Discarded packets |
| A | 0 | 14528 | 3 |
| B | 0 | 22944 | 2 |
| C | 0 | 15327 | 2 |
| D | 0 | 20207 | 2 |
| Quadrant | Total seconds | Saturated seconds | Saturation percentage |
|---|---|---|---|
| A | 7105 | 146 | 2.054891% |
| B | 7105 | 402 | 5.657987% |
| C | 7105 | 365 | 5.137227% |
| D | 7105 | 192 | 2.702322% |
Noise dominated data is calculated using 1-second bins in cleaned event files. If a bin has >2000 counts, and if more than 50% of those come from <1% of pixels, then it is considered to be noise-dominated and hence unusable.
| Quadrant | # 1 sec bins | Bins with >0 counts | Bins with >2000 counts | High rate bins dominated by noise | Noise dominated (total time) | Noise dominated (detector-on time) | Marked lightcurve |
|---|---|---|---|---|---|---|---|
| A | 7285 | 7108 | 0 | 0 | 0.00% | 0.00% | 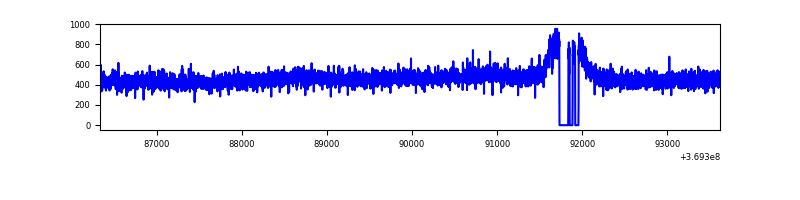 |
| B | 7285 | 7108 | 83 | 83 | 1.14% | 1.17% | 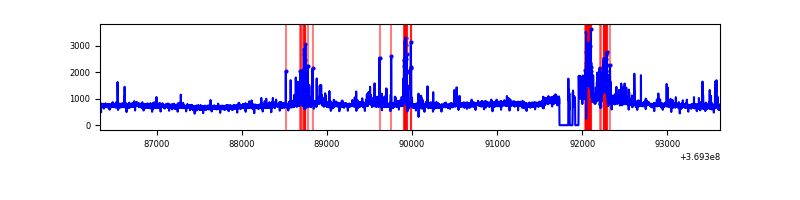 |
| C | 7285 | 7107 | 6 | 6 | 0.08% | 0.08% | 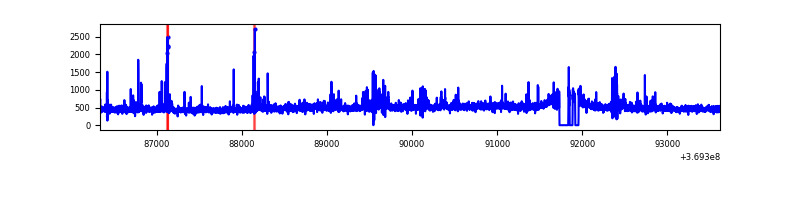 |
| D | 7285 | 7108 | 82 | 82 | 1.13% | 1.15% | 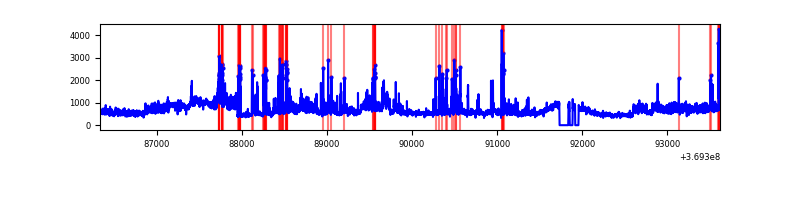 |
Top three noisy pixels from each quadrant. If the there are fewer than three noisy pixels in the level2.evt file, extra rows are filled as -1
| Pixel properties | Quadrant properties | ||||||
|---|---|---|---|---|---|---|---|
| Quadrant | DetID | PixID | Counts | Sigma | Mean | Median | Sigma |
| A | 13 | 6 | 21737 | 122.37 | 845 | 824 | 170.9 |
| A | 13 | 254 | 13313 | 73.08 | 845 | 824 | 170.9 |
| A | 3 | 137 | 8987 | 47.76 | 845 | 824 | 170.9 |
| B | 6 | 159 | 1934437 | 12238.55 | 824 | 802 | 158.0 |
| B | 4 | 80 | 522504 | 3302.01 | 824 | 802 | 158.0 |
| B | 5 | 172 | 91625 | 574.85 | 824 | 802 | 158.0 |
| C | 14 | 238 | 192083 | 1031.04 | 799 | 802 | 185.5 |
| C | 0 | 10 | 131849 | 706.37 | 799 | 802 | 185.5 |
| C | 14 | 254 | 86923 | 464.21 | 799 | 802 | 185.5 |
| D | 8 | 195 | 1464941 | 7668.14 | 812 | 788 | 190.9 |
| D | 12 | 233 | 407096 | 2127.94 | 812 | 788 | 190.9 |
| D | 1 | 52 | 85342 | 442.83 | 812 | 788 | 190.9 |
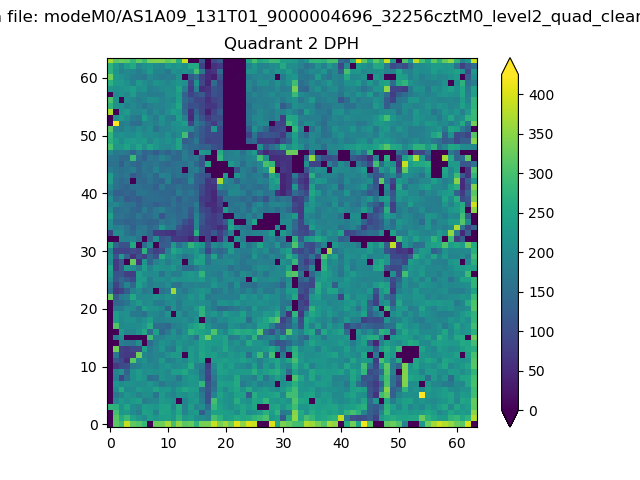
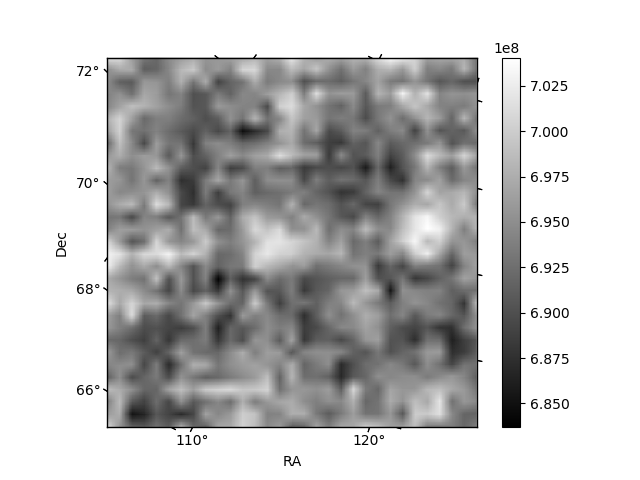
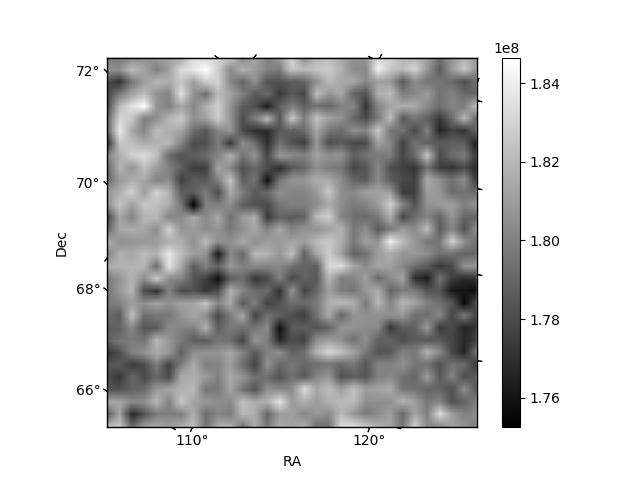
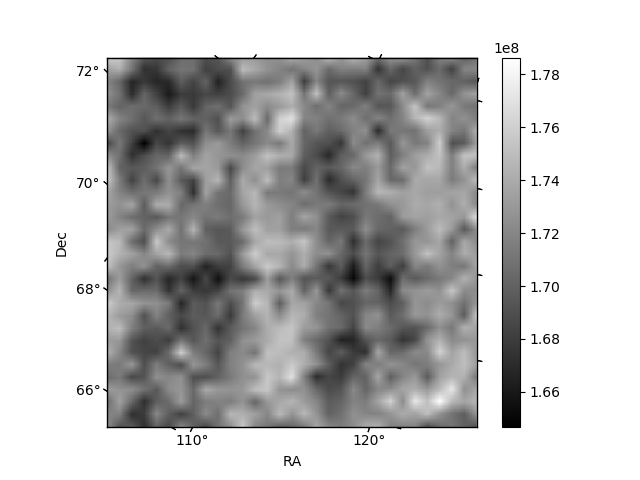
Histogram calculated using DETX and DETY for each event in the final _common_clean file
| Quadrant A | 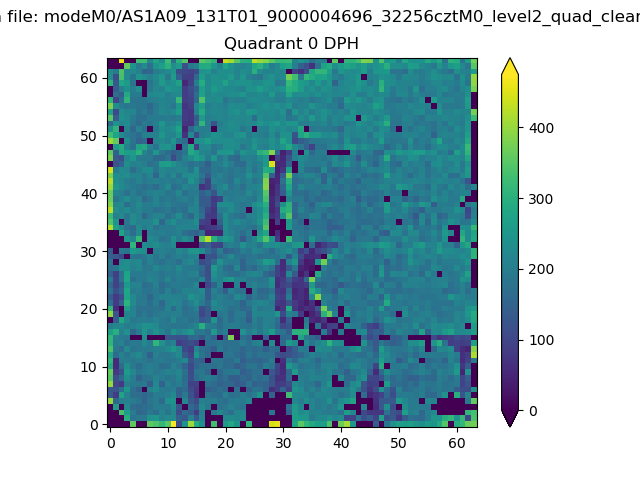 |
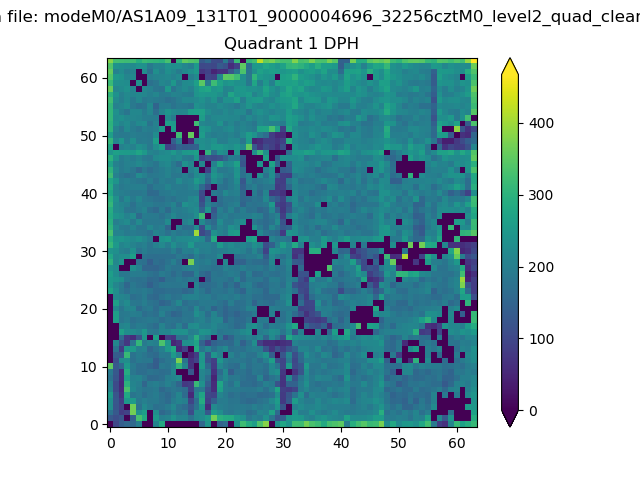 |
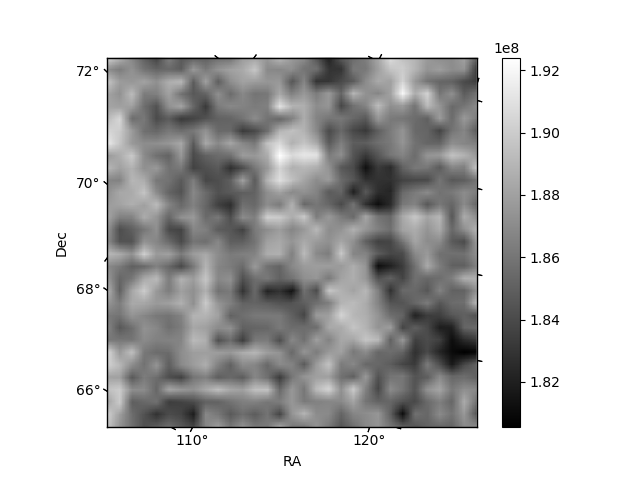
Quadrant B |
|---|---|---|---|
| Quadrant D | 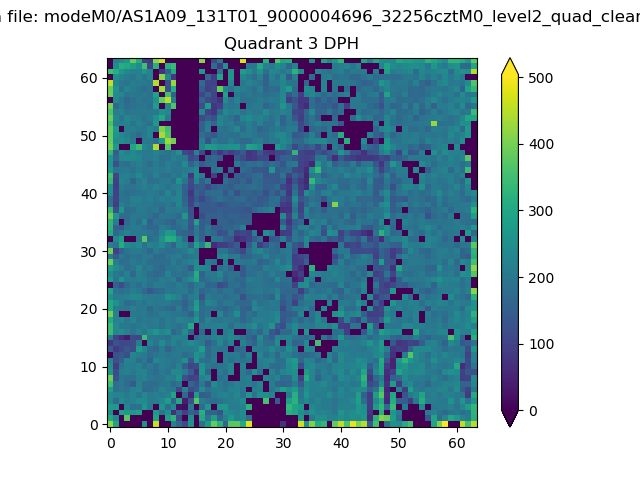 |
 |
Quadrant C |
| Plot type | Count rate plots | Images |
|---|---|---|
| Comparison with Poisson distribution Blue bars denote a histogram of data divided into 1 sec bins. Red curve is a Poisson curve with rate = median count rate of data. |
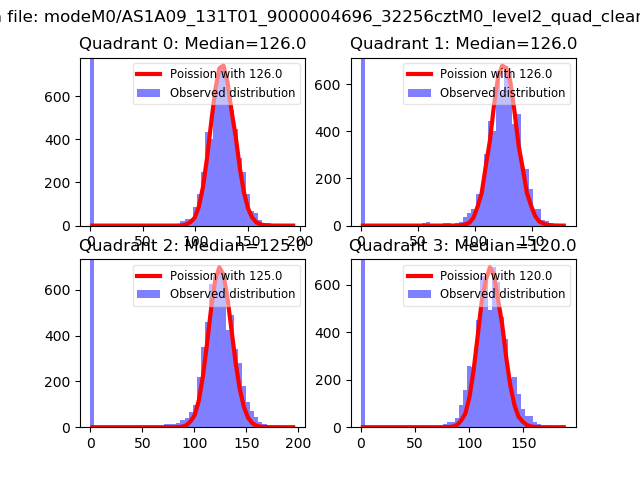 |
 |
| Quadrant-wise count rates Data is divided into 100 sec bins |
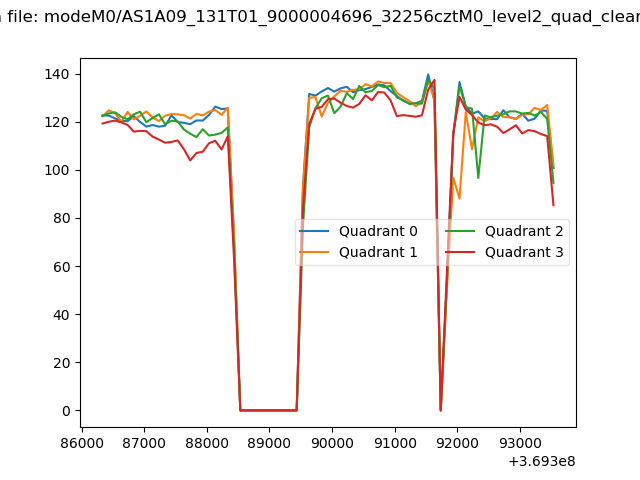 |
|
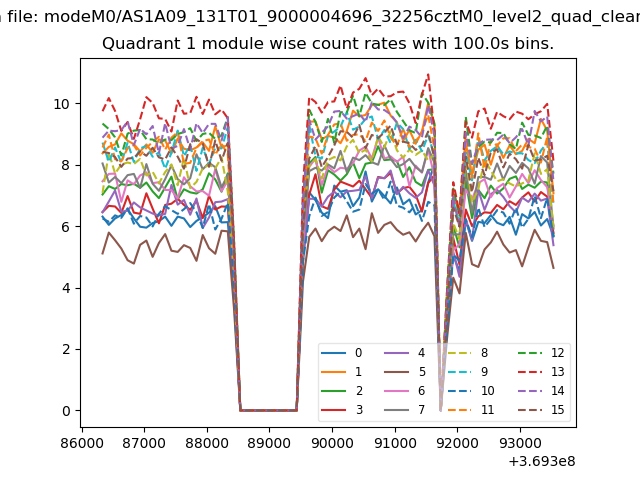
| Module-wise count rates for Quadrant A Data is divided into 100 sec bins |
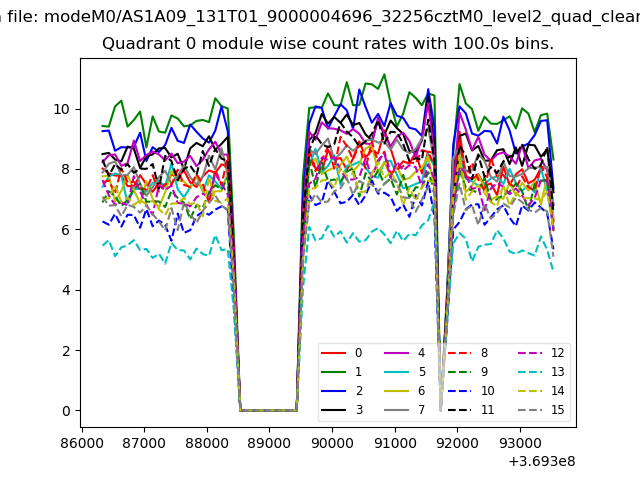 |
 |
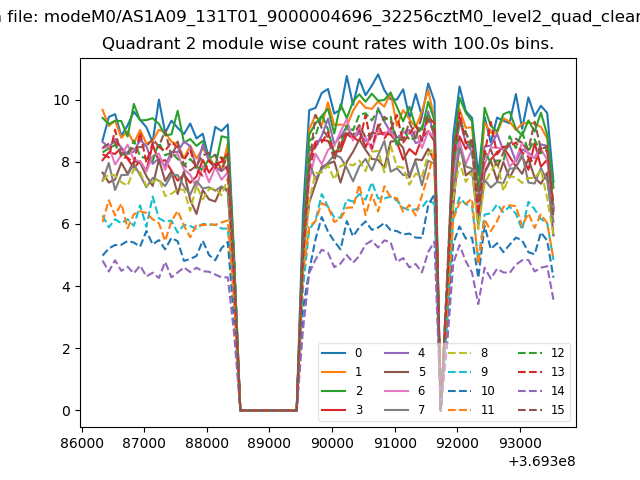
| Module-wise count rates for Quadrant B Data is divided into 100 sec bins |
 |
 |
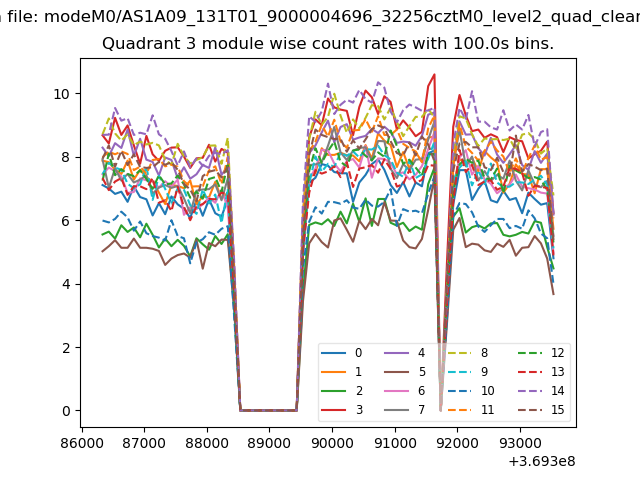
| Module-wise count rates for Quadrant C Data is divided into 100 sec bins |
 |
 |
| Module-wise count rates for Quadrant D Data is divided into 100 sec bins |
 |
 |
| Parameter | Plot |
|---|---|
| CZT HV Monitor | 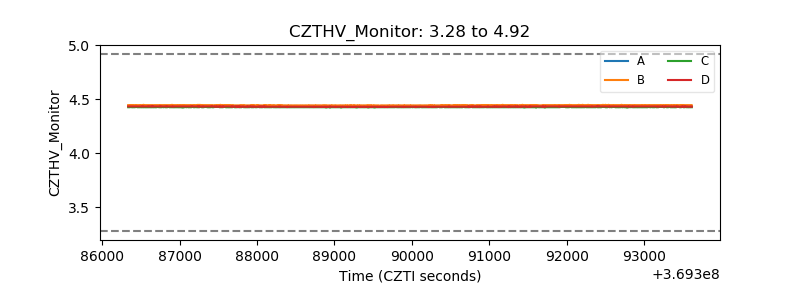 |
| D_VDD | 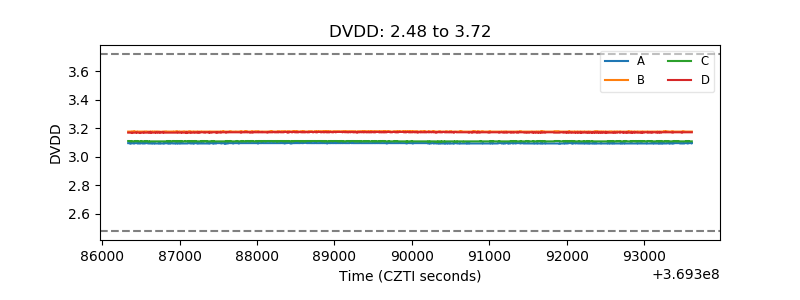 |
| Temperature 1 | 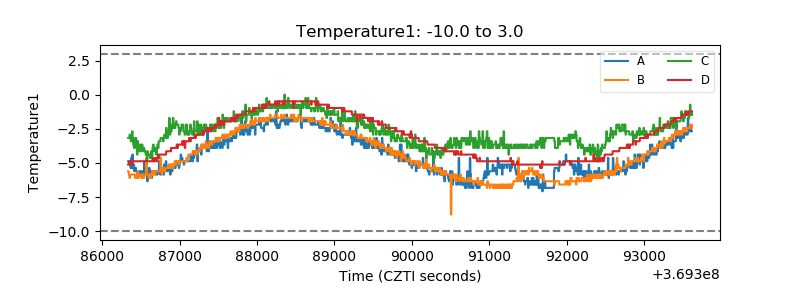 |
| Veto HV Monitor |  |
| Veto LLD |  |
| Alpha Counter | 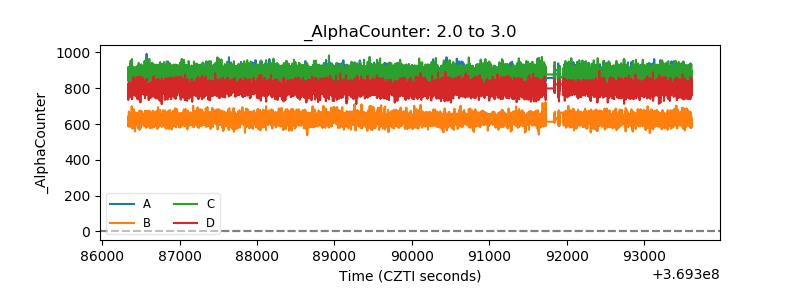 |
| _CPM_Rate | 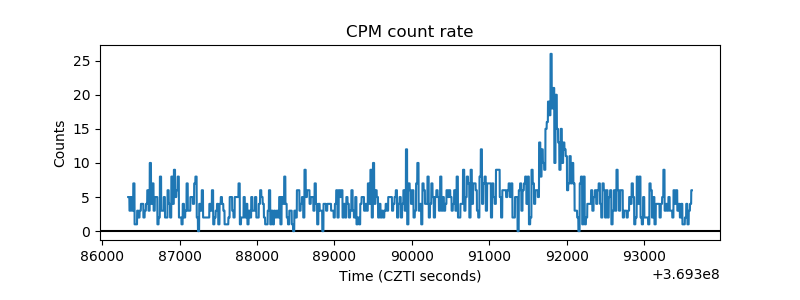 |
| CZT Counter | 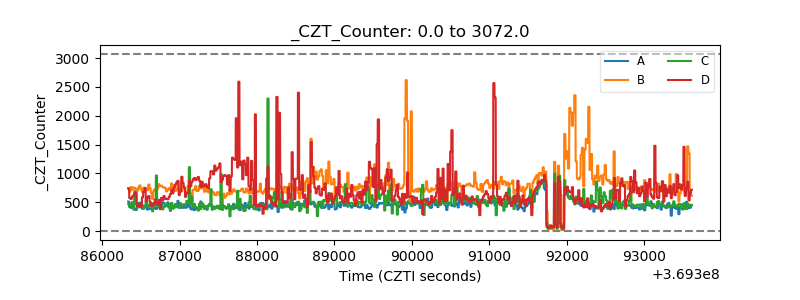 |
| +2.5 Volts monitor |  |
| +5 Volts monitor |  |
| _ROLL_ROT | 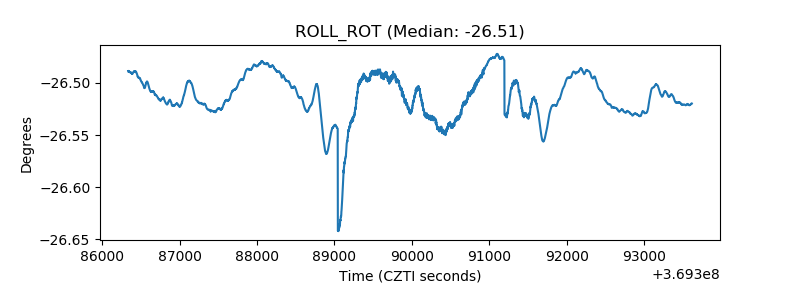 |
| _Roll_DEC | 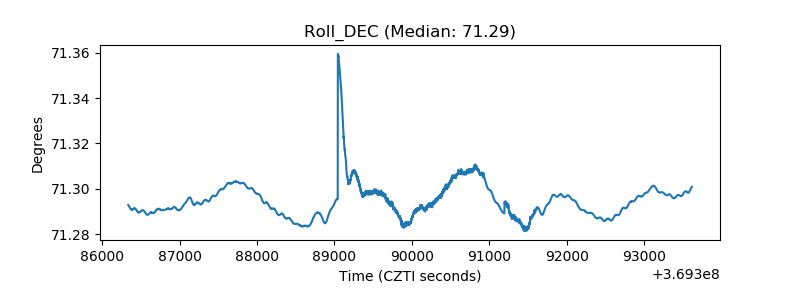 |
| _Roll_RA | 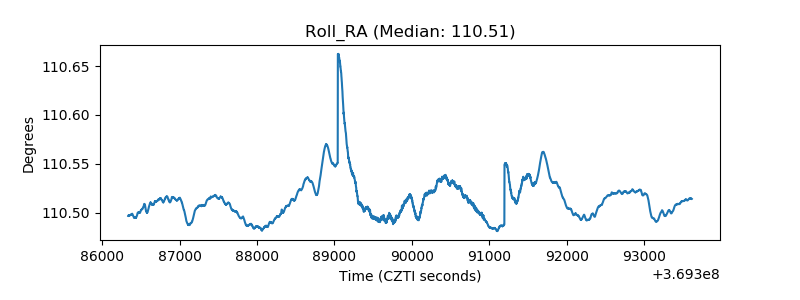 |
| Veto Counter | 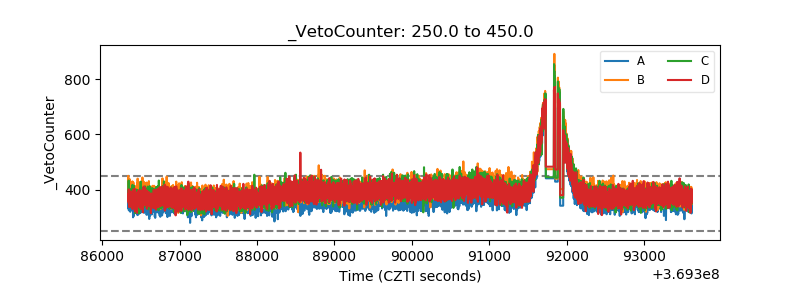 |