| Param | Original file | Final file |
|---|---|---|
| Filename | modeM0/AS1A09_131T01_9000004696_32260cztM0_level2.evt | modeM0/AS1A09_131T01_9000004696_32260cztM0_level2_quad_clean.evt |
| Size (bytes) | 708,906,240 | 111,049,920 |
| Size | 676.1 MB | 105.9 MB |
| Events in quadrant A | 3,795,991 | 723,375 |
| Events in quadrant B | 6,298,027 | 717,487 |
| Events in quadrant C | 3,987,854 | 707,020 |
| Events in quadrant D | 6,875,481 | 687,799 |
| Mode SS | |||
|---|---|---|---|
| Quadrant | BADHDUFLAG | Total packets | Discarded packets |
| A | 0 | 156 | 0 |
| B | 0 | 156 | 0 |
| C | 0 | 156 | 0 |
| D | 0 | 156 | 0 |
| Mode M9 | |||
|---|---|---|---|
| Quadrant | BADHDUFLAG | Total packets | Discarded packets |
| A | 0 | 17 | 0 |
| B | 0 | 17 | 0 |
| C | 0 | 17 | 0 |
| D | 0 | 17 | 0 |
| Mode M0 | |||
|---|---|---|---|
| Quadrant | BADHDUFLAG | Total packets | Discarded packets |
| A | 0 | 16069 | 2 |
| B | 0 | 24118 | 2 |
| C | 0 | 16475 | 2 |
| D | 0 | 25532 | 2 |
| Quadrant | Total seconds | Saturated seconds | Saturation percentage |
|---|---|---|---|
| A | 7577 | 83 | 1.095420% |
| B | 7578 | 311 | 4.103985% |
| C | 7578 | 228 | 3.008709% |
| D | 7578 | 515 | 6.795988% |
Noise dominated data is calculated using 1-second bins in cleaned event files. If a bin has >2000 counts, and if more than 50% of those come from <1% of pixels, then it is considered to be noise-dominated and hence unusable.
| Quadrant | # 1 sec bins | Bins with >0 counts | Bins with >2000 counts | High rate bins dominated by noise | Noise dominated (total time) | Noise dominated (detector-on time) | Marked lightcurve |
|---|---|---|---|---|---|---|---|
| A | 9327 | 7579 | 1 | 1 | 0.01% | 0.01% | 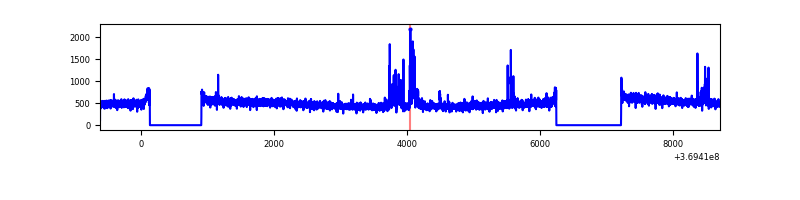 |
| B | 9328 | 7580 | 85 | 85 | 0.91% | 1.12% | 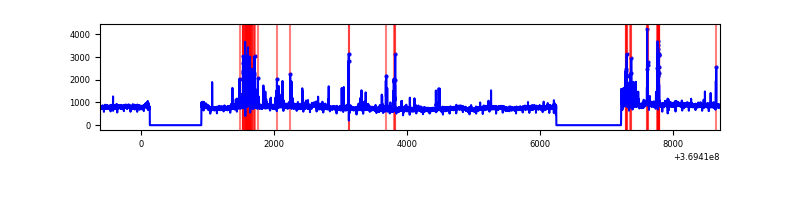 |
| C | 9328 | 7580 | 33 | 33 | 0.35% | 0.44% | 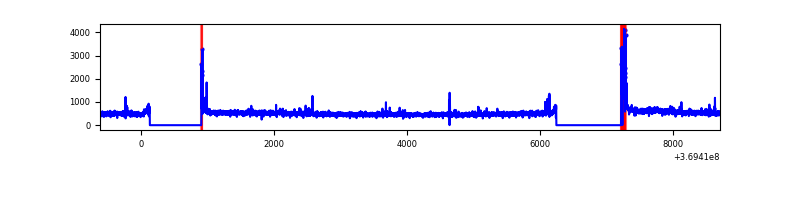 |
| D | 9328 | 7580 | 326 | 326 | 3.49% | 4.30% | 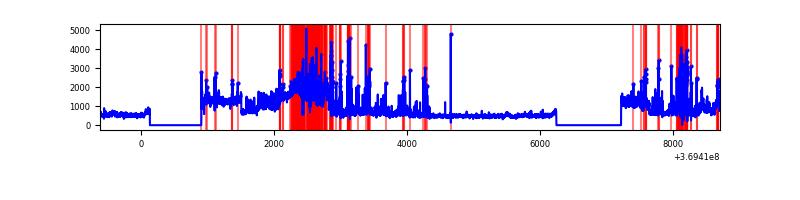 |
Top three noisy pixels from each quadrant. If the there are fewer than three noisy pixels in the level2.evt file, extra rows are filled as -1
| Pixel properties | Quadrant properties | ||||||
|---|---|---|---|---|---|---|---|
| Quadrant | DetID | PixID | Counts | Sigma | Mean | Median | Sigma |
| A | 14 | 238 | 122209 | 644.0 | 940 | 920 | 188.3 |
| A | 0 | 6 | 17724 | 89.22 | 940 | 920 | 188.3 |
| A | 13 | 6 | 16995 | 85.35 | 940 | 920 | 188.3 |
| B | 6 | 159 | 2190680 | 12554.41 | 919 | 894 | 174.4 |
| B | 5 | 172 | 347758 | 1988.63 | 919 | 894 | 174.4 |
| B | 0 | 190 | 46724 | 262.75 | 919 | 894 | 174.4 |
| C | 0 | 10 | 193212 | 919.71 | 895 | 898 | 209.1 |
| C | 14 | 238 | 161430 | 767.72 | 895 | 898 | 209.1 |
| C | 3 | 233 | 43491 | 203.69 | 895 | 898 | 209.1 |
| D | 8 | 195 | 2363963 | 11129.0 | 892 | 866 | 212.3 |
| D | 12 | 218 | 373637 | 1755.56 | 892 | 866 | 212.3 |
| D | 12 | 233 | 230011 | 1079.16 | 892 | 866 | 212.3 |
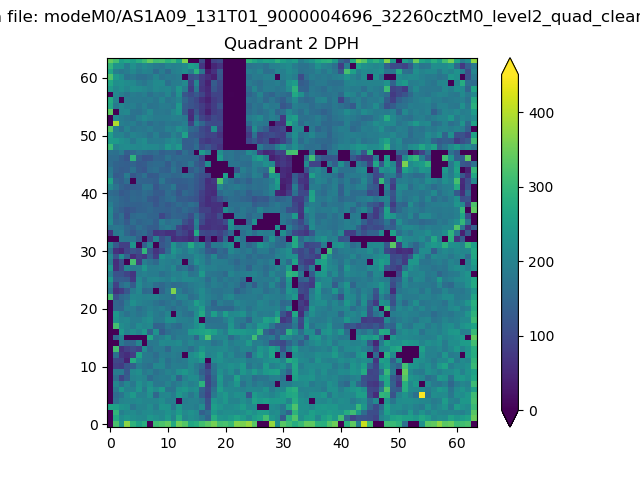
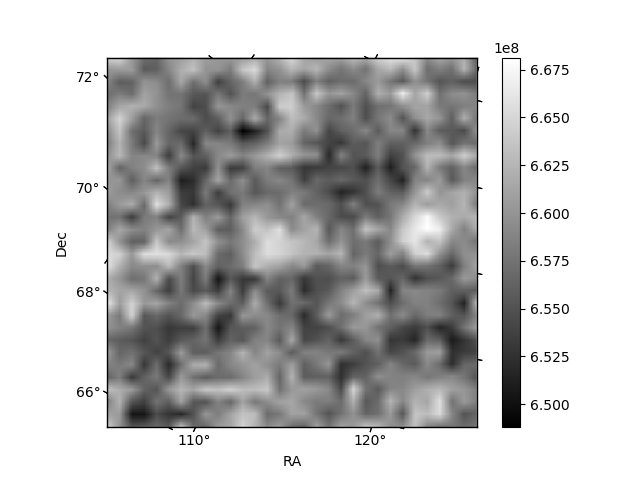
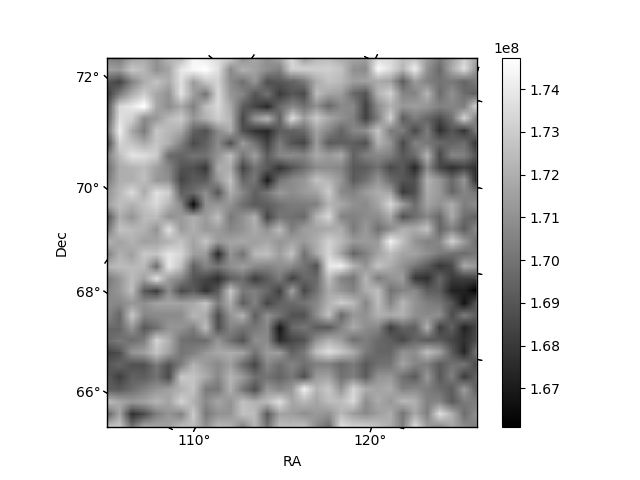
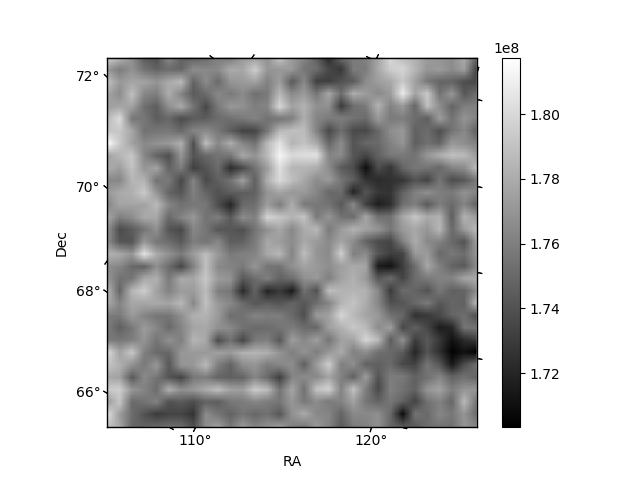
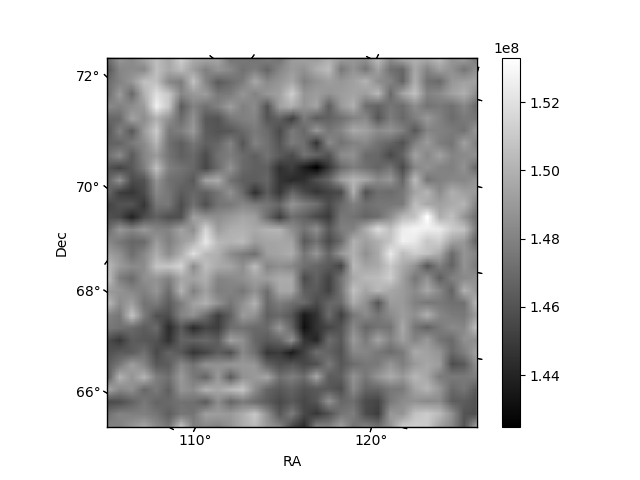
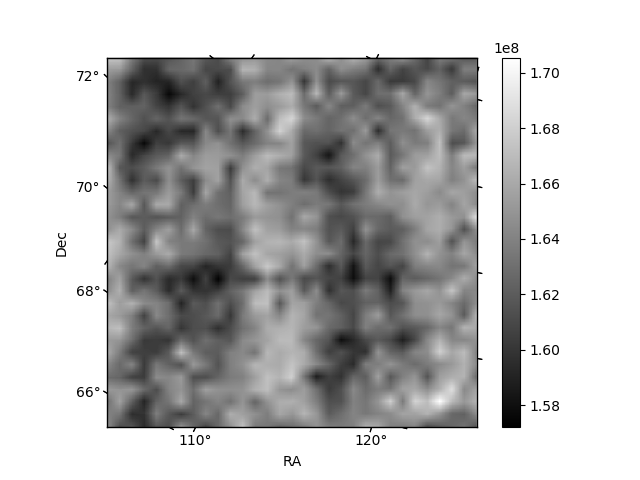
Histogram calculated using DETX and DETY for each event in the final _common_clean file
| Quadrant A | 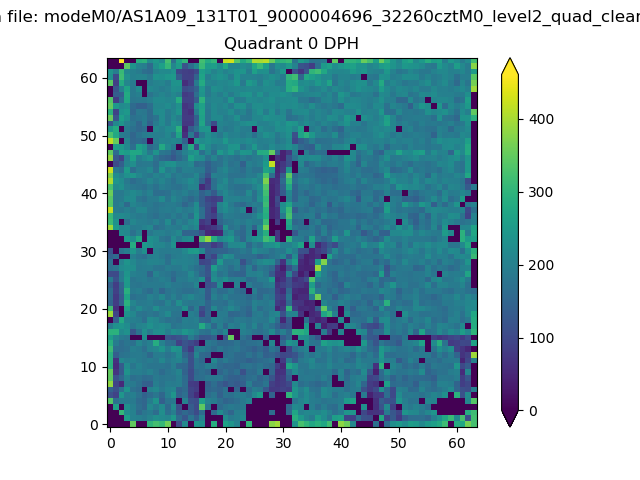 |
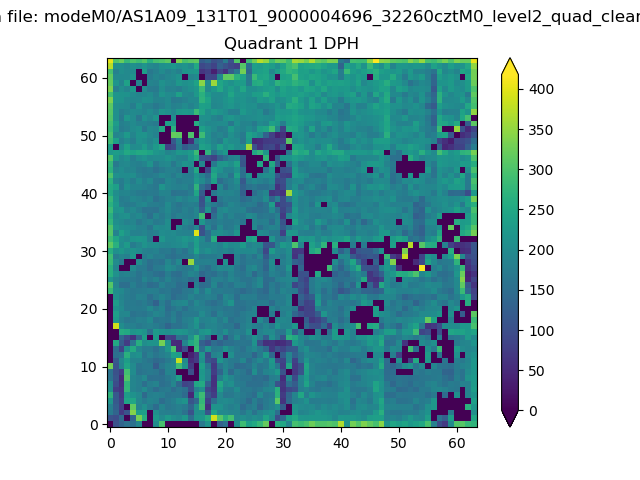 |
Quadrant B |
|---|---|---|---|
| Quadrant D | 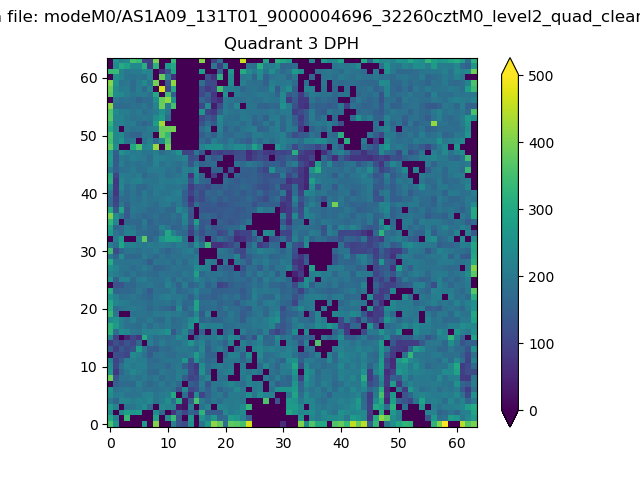 |
 |
Quadrant C |
| Plot type | Count rate plots | Images |
|---|---|---|
| Comparison with Poisson distribution Blue bars denote a histogram of data divided into 1 sec bins. Red curve is a Poisson curve with rate = median count rate of data. |
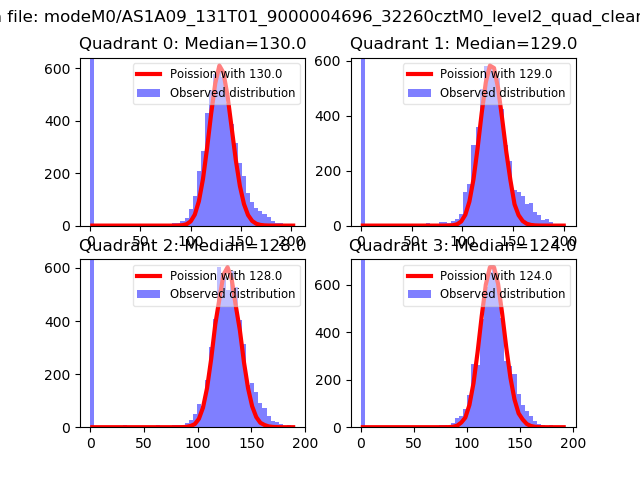 |
 |
| Quadrant-wise count rates Data is divided into 100 sec bins |
 |
|
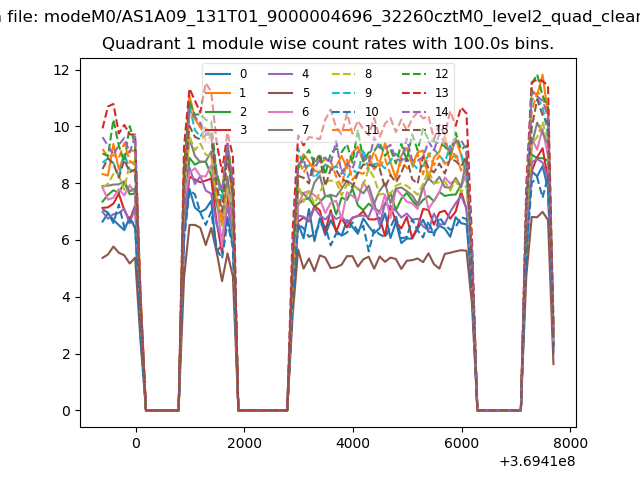
| Module-wise count rates for Quadrant A Data is divided into 100 sec bins |
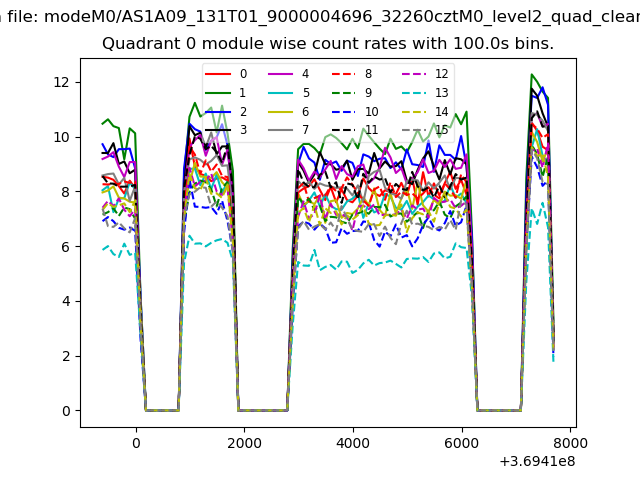 |
 |
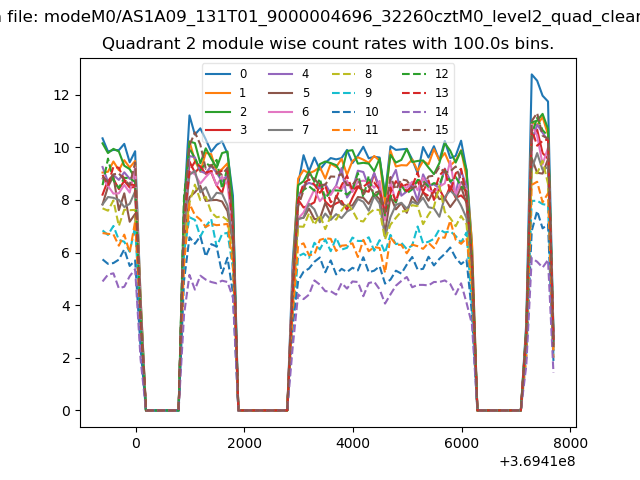
| Module-wise count rates for Quadrant B Data is divided into 100 sec bins |
 |
 |
| Module-wise count rates for Quadrant C Data is divided into 100 sec bins |
 |
 |
| Module-wise count rates for Quadrant D Data is divided into 100 sec bins |
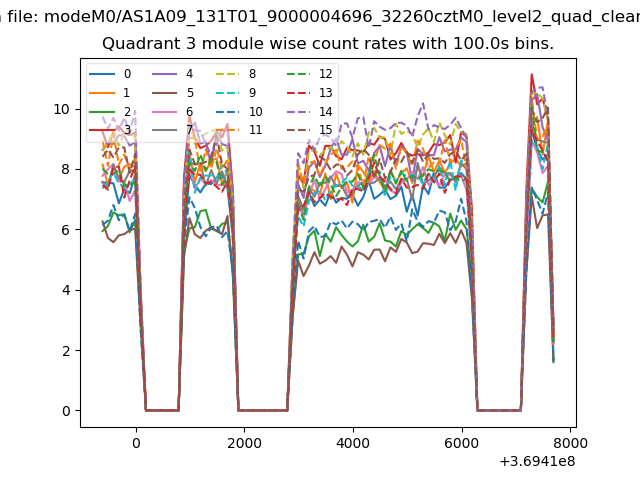 |
 |
| Parameter | Plot |
|---|---|
| CZT HV Monitor | 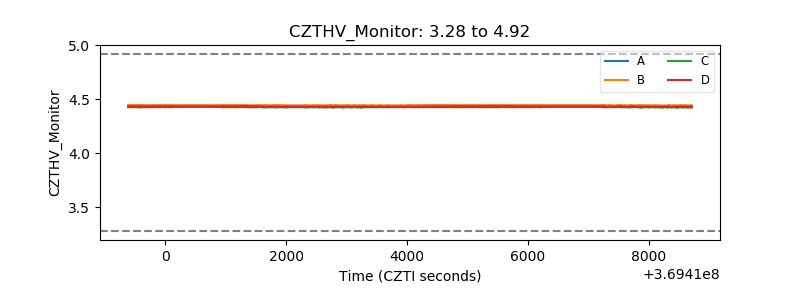 |
| D_VDD | 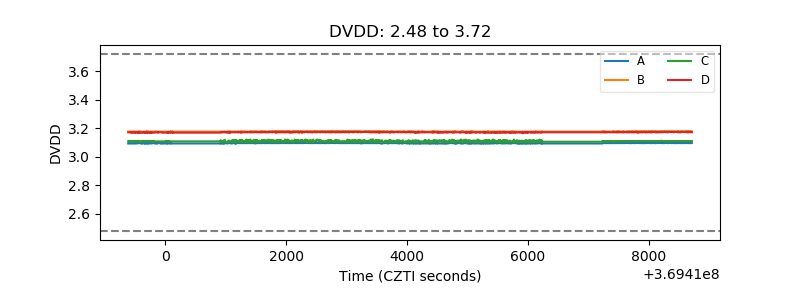 |
| Temperature 1 | 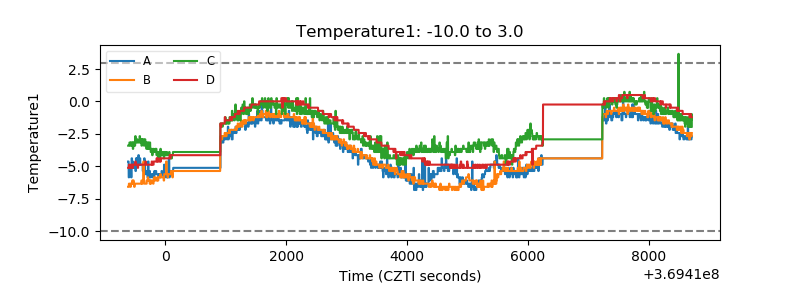 |
| Veto HV Monitor |  |
| Veto LLD | 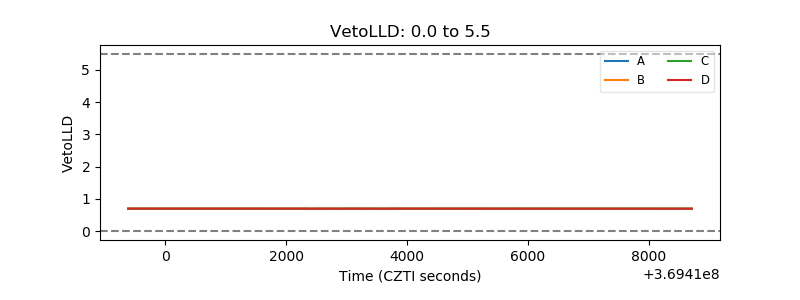 |
| Alpha Counter | 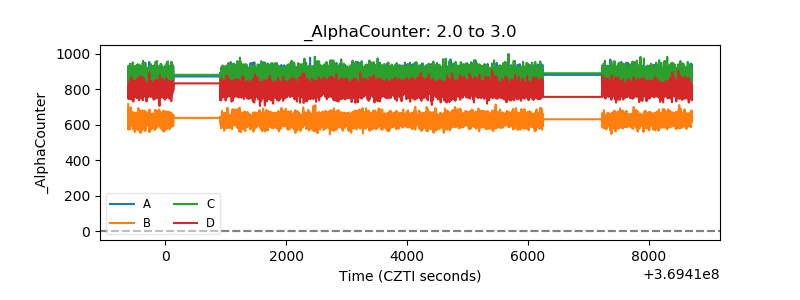 |
| _CPM_Rate | 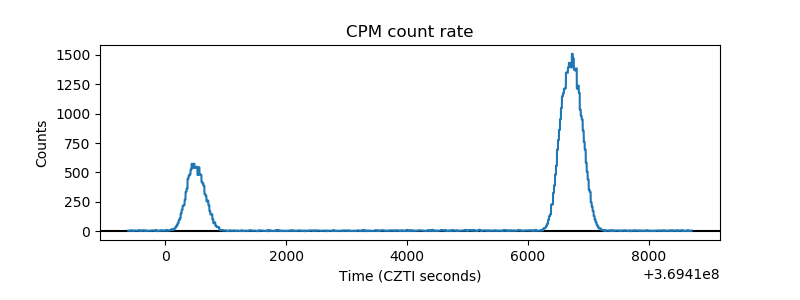 |
| CZT Counter | 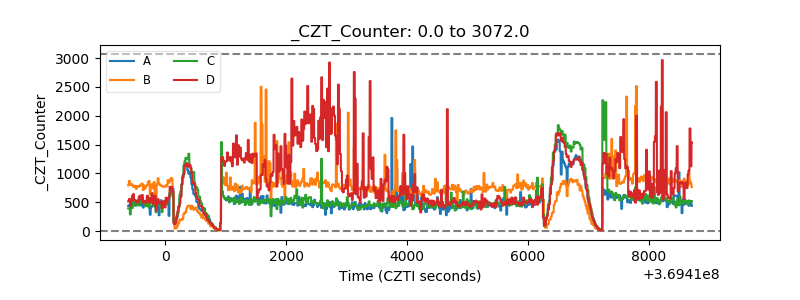 |
| +2.5 Volts monitor | 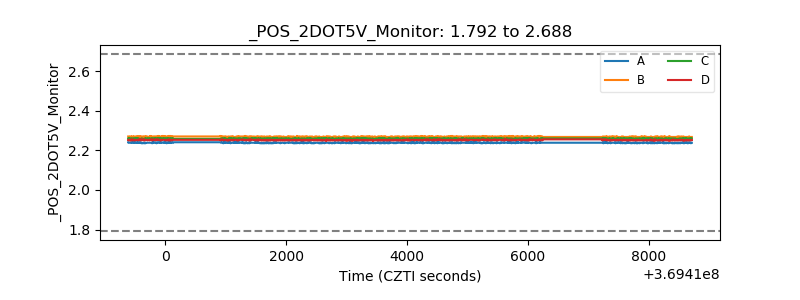 |
| +5 Volts monitor |  |
| _ROLL_ROT | 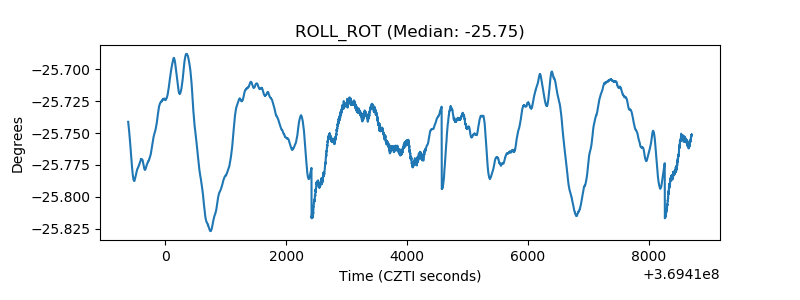 |
| _Roll_DEC | 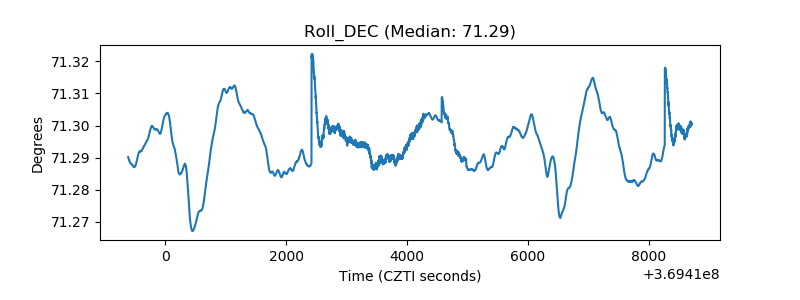 |
| _Roll_RA | 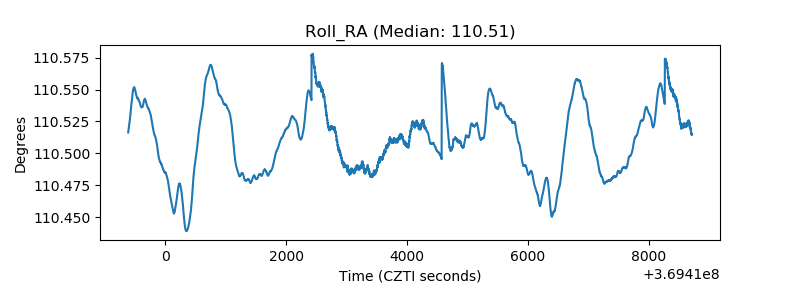 |
| Veto Counter | 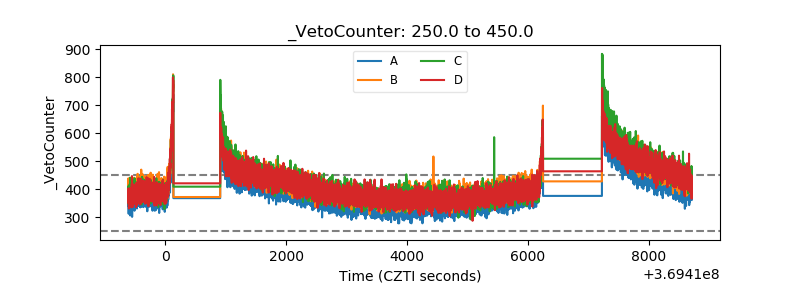 |