| Param | Original file | Final file |
|---|---|---|
| Filename | modeM0/AS1A09_131T01_9000004696_32262cztM0_level2.evt | modeM0/AS1A09_131T01_9000004696_32262cztM0_level2_quad_clean.evt |
| Size (bytes) | 573,255,360 | 83,410,560 |
| Size | 546.7 MB | 79.5 MB |
| Events in quadrant A | 3,033,822 | 532,727 |
| Events in quadrant B | 5,217,056 | 530,605 |
| Events in quadrant C | 3,342,429 | 529,962 |
| Events in quadrant D | 5,349,771 | 501,235 |
| Mode SS | |||
|---|---|---|---|
| Quadrant | BADHDUFLAG | Total packets | Discarded packets |
| A | 0 | 126 | 0 |
| B | 0 | 126 | 0 |
| C | 0 | 126 | 0 |
| D | 0 | 126 | 0 |
| Mode M9 | |||
|---|---|---|---|
| Quadrant | BADHDUFLAG | Total packets | Discarded packets |
| A | 0 | 11 | 0 |
| B | 0 | 11 | 0 |
| C | 0 | 11 | 0 |
| D | 0 | 11 | 0 |
| Mode M0 | |||
|---|---|---|---|
| Quadrant | BADHDUFLAG | Total packets | Discarded packets |
| A | 0 | 13093 | 1 |
| B | 0 | 20033 | 1 |
| C | 0 | 13986 | 1 |
| D | 0 | 20123 | 1 |
| Quadrant | Total seconds | Saturated seconds | Saturation percentage |
|---|---|---|---|
| A | 6175 | 26 | 0.421053% |
| B | 6176 | 143 | 2.315415% |
| C | 6176 | 151 | 2.444948% |
| D | 6176 | 577 | 9.342617% |
Noise dominated data is calculated using 1-second bins in cleaned event files. If a bin has >2000 counts, and if more than 50% of those come from <1% of pixels, then it is considered to be noise-dominated and hence unusable.
| Quadrant | # 1 sec bins | Bins with >0 counts | Bins with >2000 counts | High rate bins dominated by noise | Noise dominated (total time) | Noise dominated (detector-on time) | Marked lightcurve |
|---|---|---|---|---|---|---|---|
| A | 7305 | 6176 | 0 | 0 | 0.00% | 0.00% | 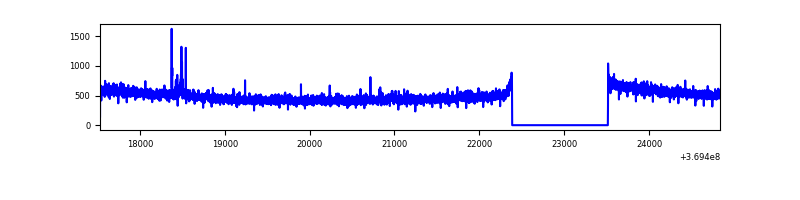 |
| B | 7306 | 6177 | 39 | 39 | 0.53% | 0.63% | 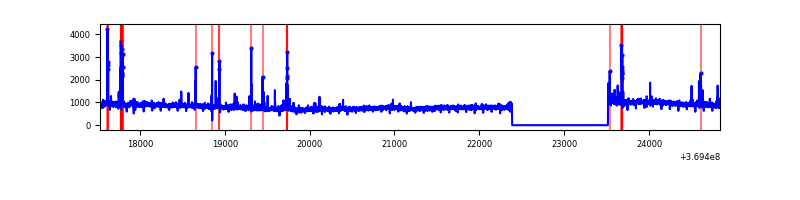 |
| C | 7306 | 6177 | 30 | 30 | 0.41% | 0.49% | 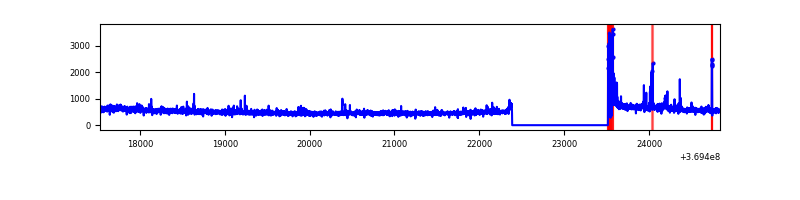 |
| D | 7306 | 6177 | 363 | 363 | 4.97% | 5.88% | 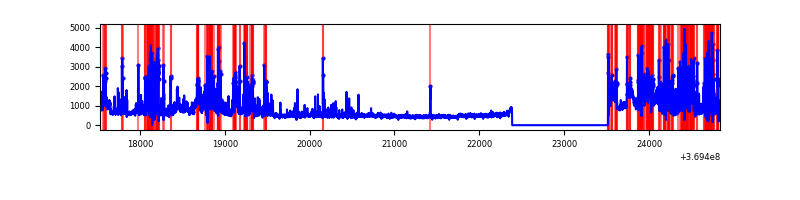 |
Top three noisy pixels from each quadrant. If the there are fewer than three noisy pixels in the level2.evt file, extra rows are filled as -1
| Pixel properties | Quadrant properties | ||||||
|---|---|---|---|---|---|---|---|
| Quadrant | DetID | PixID | Counts | Sigma | Mean | Median | Sigma |
| A | 0 | 6 | 17924 | 110.86 | 773 | 758 | 154.8 |
| A | 13 | 6 | 14239 | 87.06 | 773 | 758 | 154.8 |
| A | 13 | 254 | 12763 | 77.53 | 773 | 758 | 154.8 |
| B | 6 | 159 | 1949651 | 13530.91 | 765 | 746 | 144.0 |
| B | 5 | 172 | 192224 | 1329.4 | 765 | 746 | 144.0 |
| B | 0 | 230 | 18718 | 124.78 | 765 | 746 | 144.0 |
| C | 0 | 10 | 183545 | 1048.44 | 750 | 754 | 174.3 |
| C | 14 | 238 | 128836 | 734.64 | 750 | 754 | 174.3 |
| C | 4 | 175 | 39948 | 224.81 | 750 | 754 | 174.3 |
| D | 8 | 195 | 836552 | 4829.94 | 729 | 709 | 173.1 |
| D | 13 | 249 | 522375 | 3014.46 | 729 | 709 | 173.1 |
| D | 12 | 218 | 403839 | 2329.5 | 729 | 709 | 173.1 |
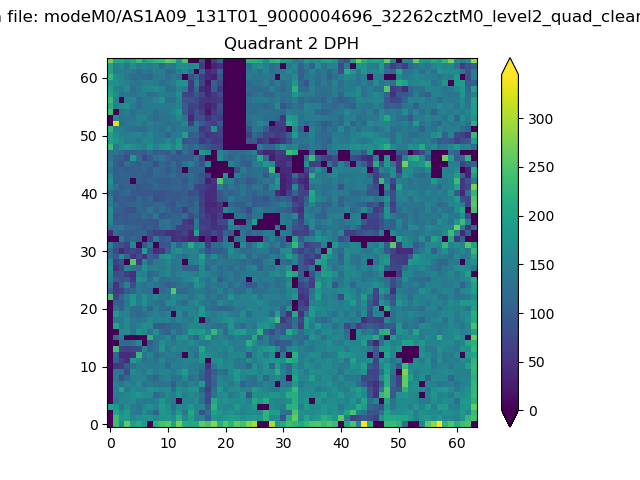
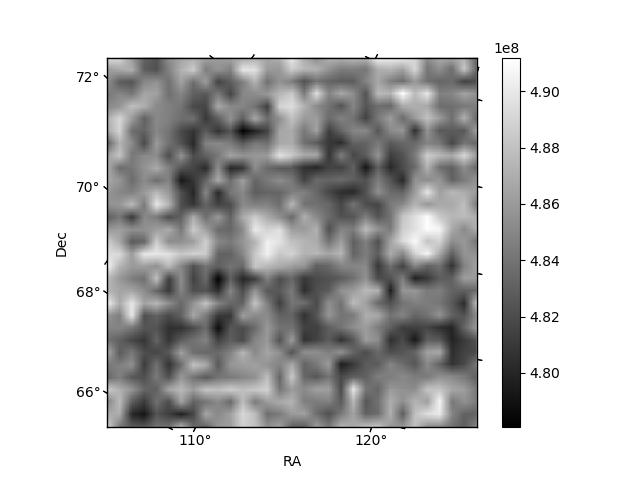
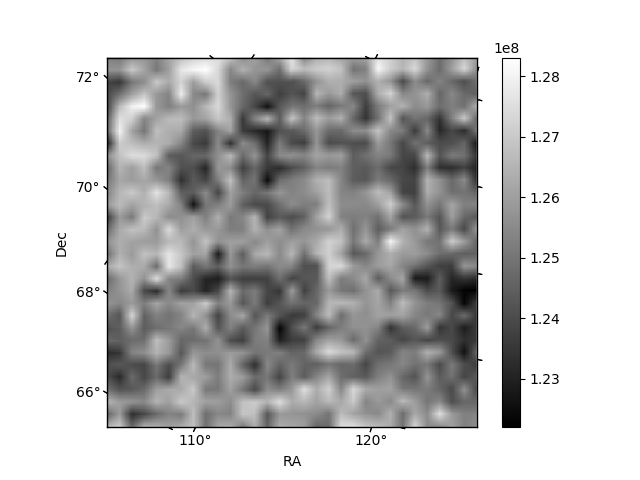
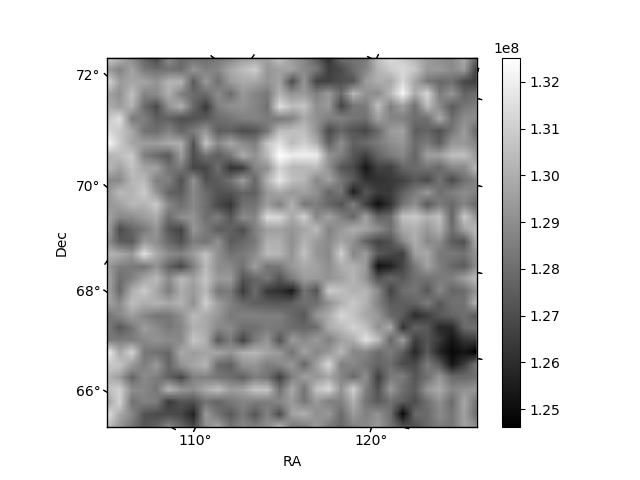
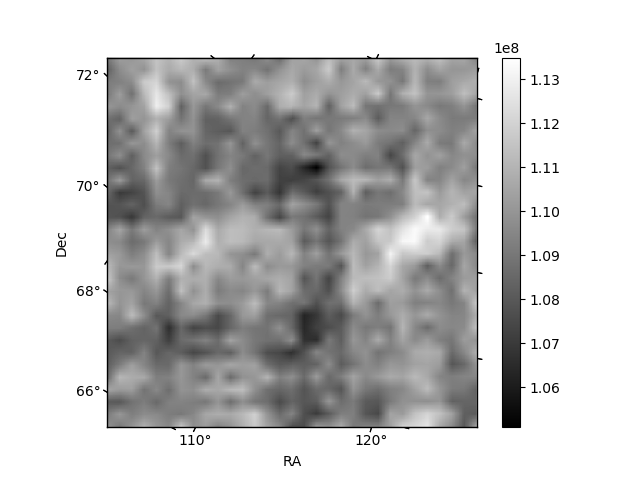
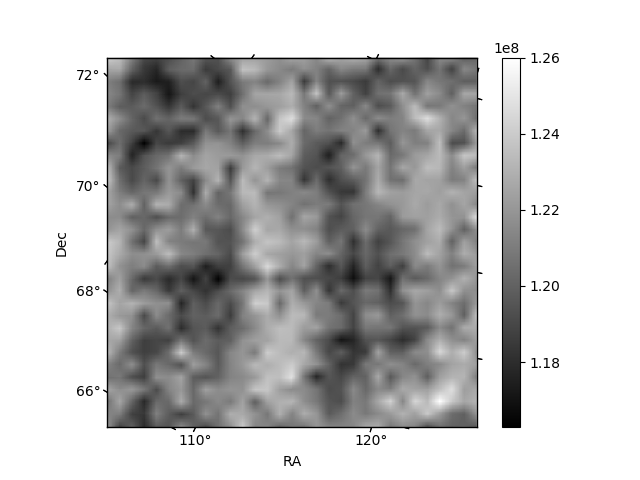
Histogram calculated using DETX and DETY for each event in the final _common_clean file
| Quadrant A | 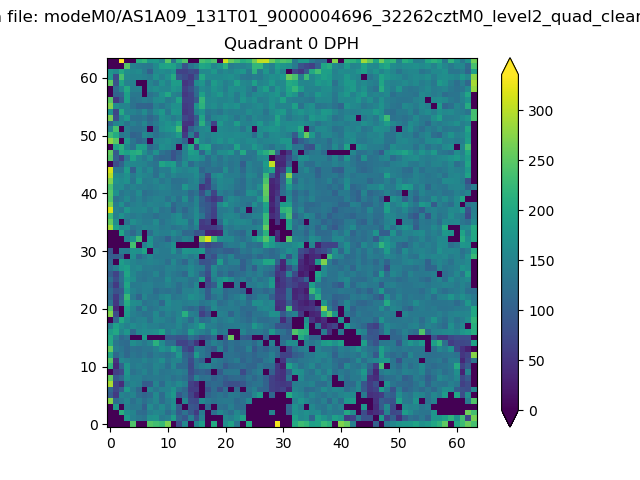 |
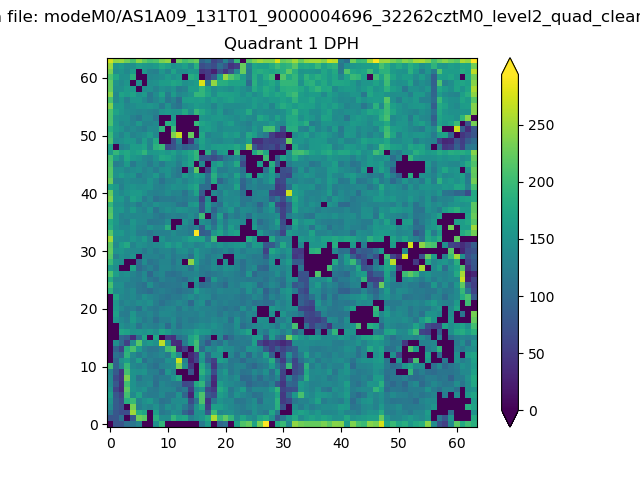 |
Quadrant B |
|---|---|---|---|
| Quadrant D | 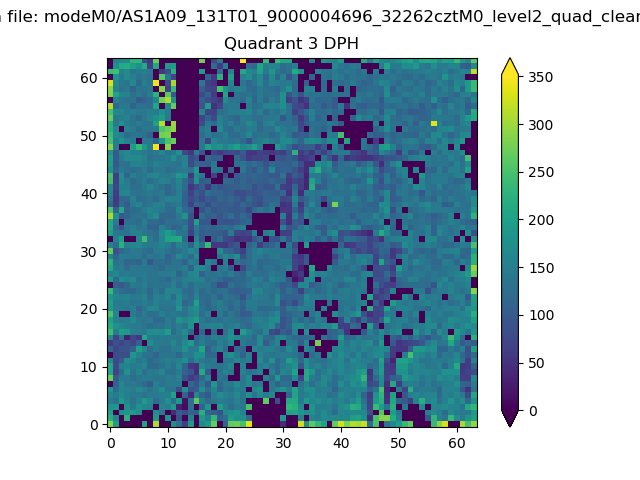 |
 |
Quadrant C |
| Plot type | Count rate plots | Images |
|---|---|---|
| Comparison with Poisson distribution Blue bars denote a histogram of data divided into 1 sec bins. Red curve is a Poisson curve with rate = median count rate of data. |
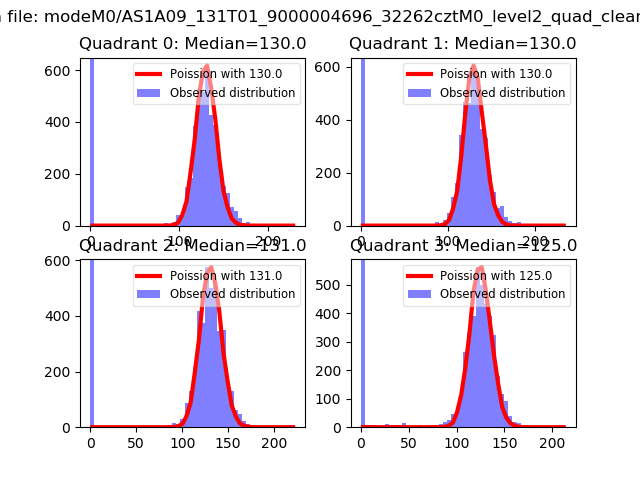 |
 |
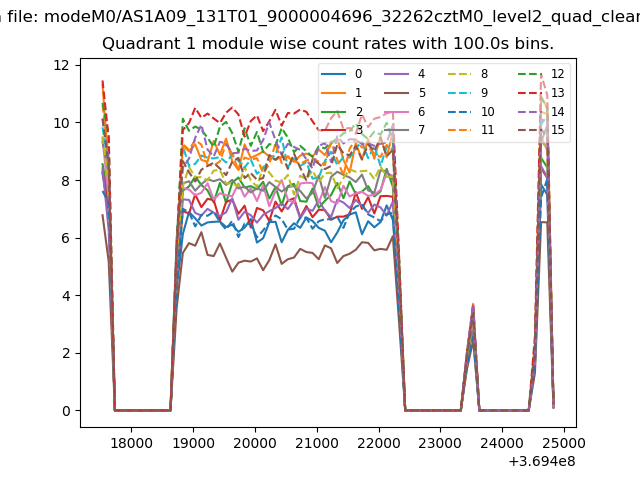
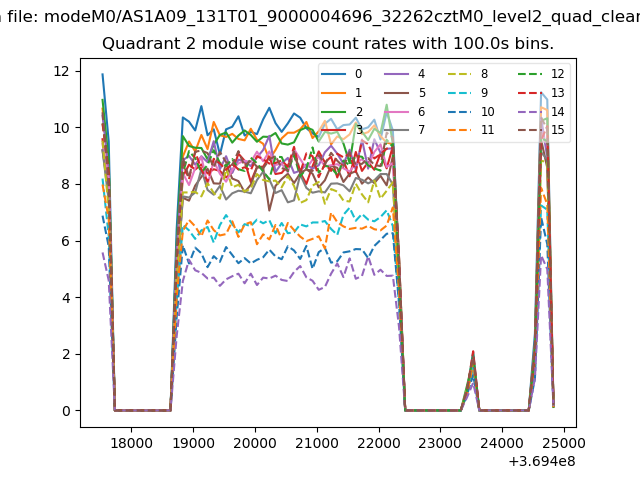
| Quadrant-wise count rates Data is divided into 100 sec bins |
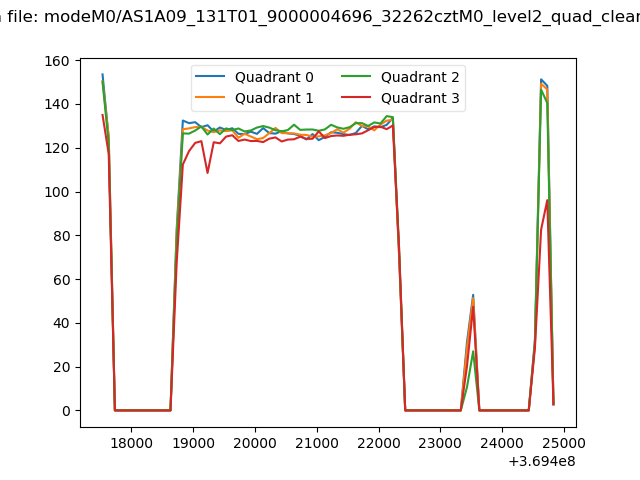 |
|
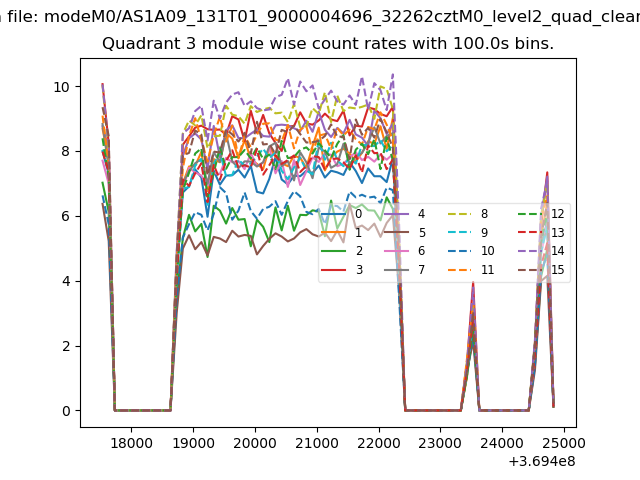
| Module-wise count rates for Quadrant A Data is divided into 100 sec bins |
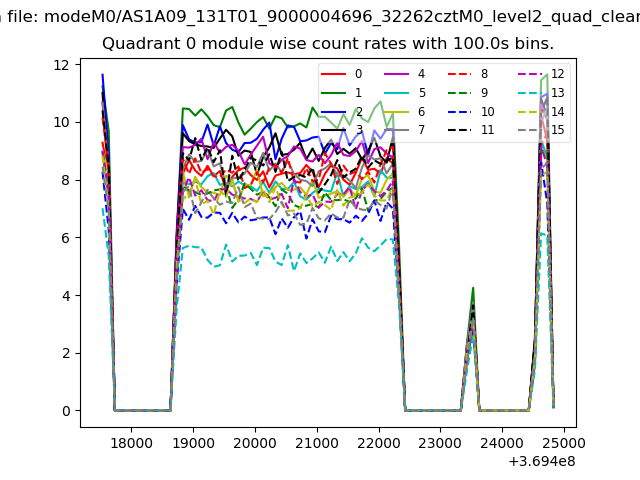 |
 |
| Module-wise count rates for Quadrant B Data is divided into 100 sec bins |
 |
 |
| Module-wise count rates for Quadrant C Data is divided into 100 sec bins |
 |
 |
| Module-wise count rates for Quadrant D Data is divided into 100 sec bins |
 |
 |
| Parameter | Plot |
|---|---|
| CZT HV Monitor | 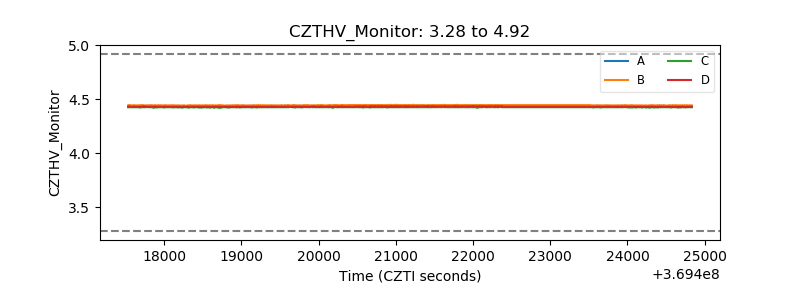 |
| D_VDD | 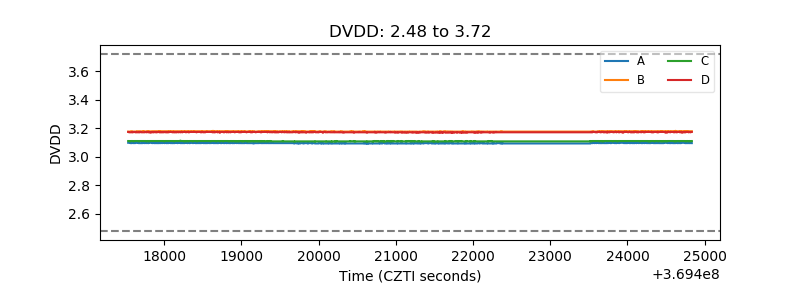 |
| Temperature 1 | 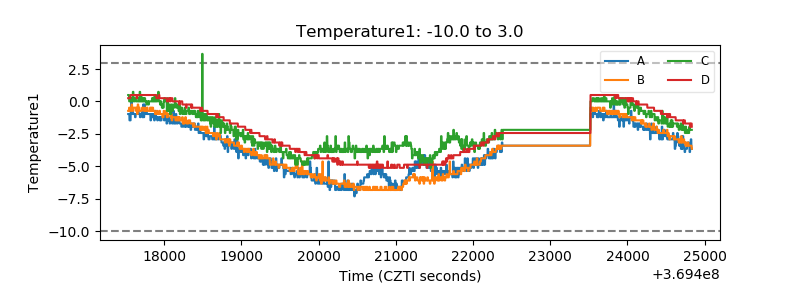 |
| Veto HV Monitor | 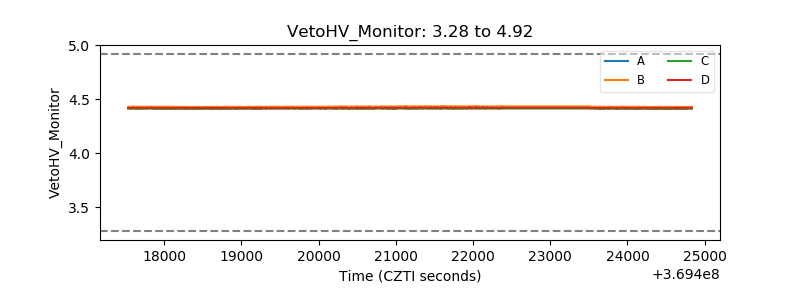 |
| Veto LLD | 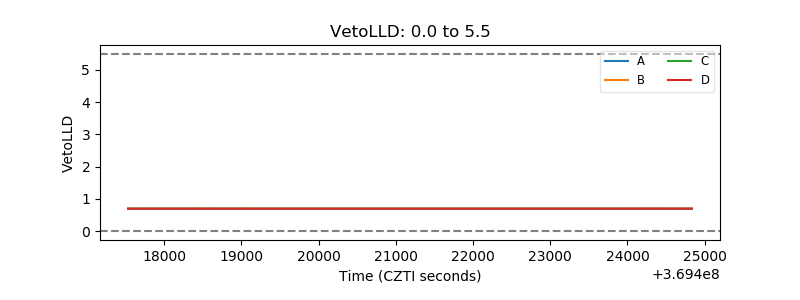 |
| Alpha Counter | 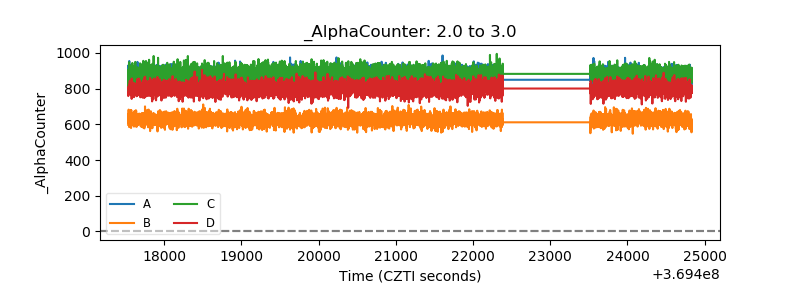 |
| _CPM_Rate | 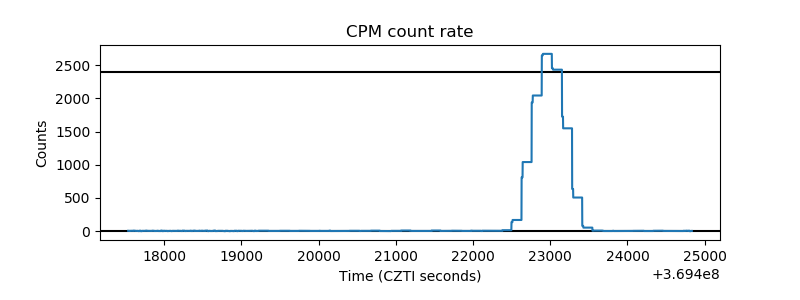 |
| CZT Counter | 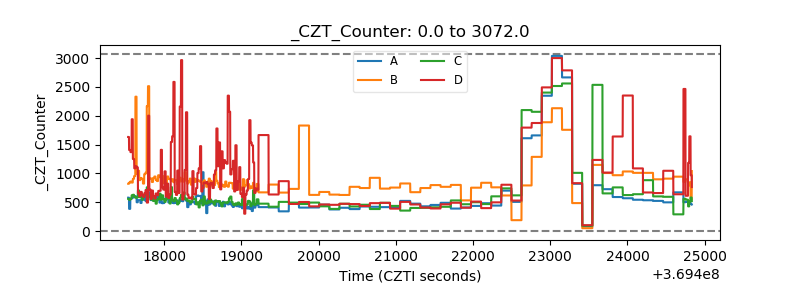 |
| +2.5 Volts monitor | 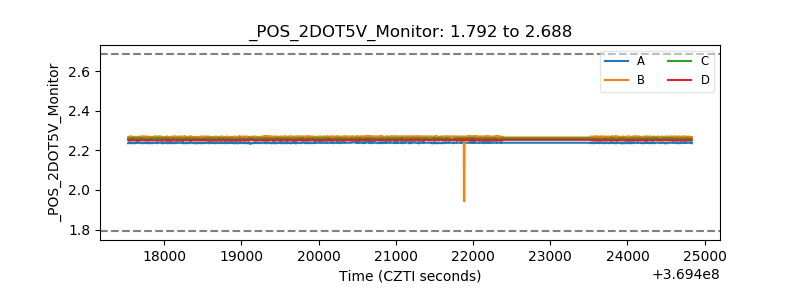 |
| +5 Volts monitor |  |
| _ROLL_ROT | 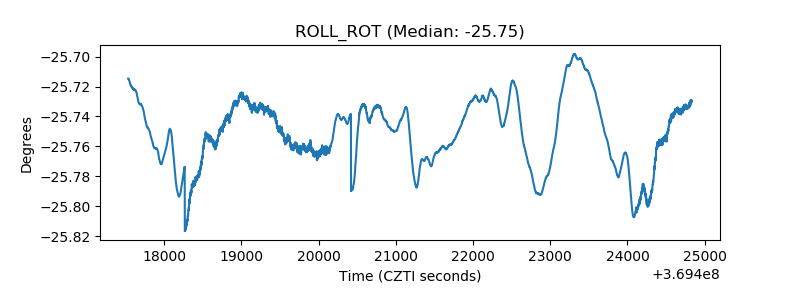 |
| _Roll_DEC | 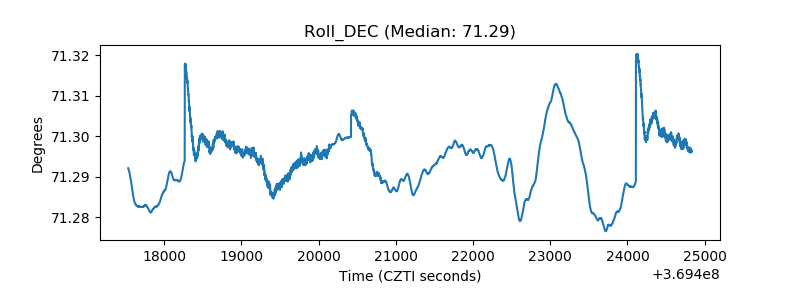 |
| _Roll_RA | 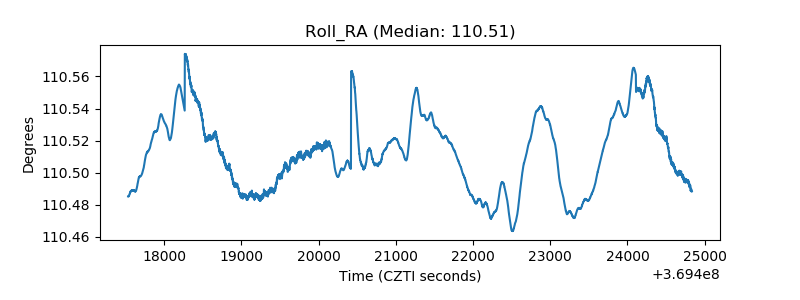 |
| Veto Counter | 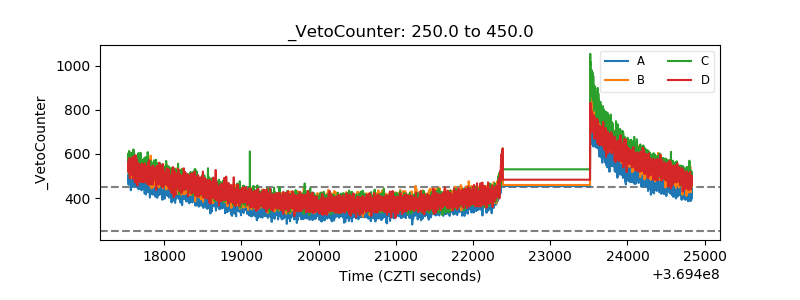 |