| Param | Original file | Final file |
|---|---|---|
| Filename | modeM0/AS1A09_131T01_9000004696_32263cztM0_level2.evt | modeM0/AS1A09_131T01_9000004696_32263cztM0_level2_quad_clean.evt |
| Size (bytes) | 615,418,560 | 97,856,640 |
| Size | 586.9 MB | 93.3 MB |
| Events in quadrant A | 3,216,022 | 637,023 |
| Events in quadrant B | 5,569,117 | 638,988 |
| Events in quadrant C | 3,681,340 | 640,698 |
| Events in quadrant D | 5,744,047 | 605,666 |
| Mode SS | |||
|---|---|---|---|
| Quadrant | BADHDUFLAG | Total packets | Discarded packets |
| A | 0 | 130 | 0 |
| B | 0 | 130 | 0 |
| C | 0 | 130 | 0 |
| D | 0 | 130 | 0 |
| Mode M9 | |||
|---|---|---|---|
| Quadrant | BADHDUFLAG | Total packets | Discarded packets |
| A | 0 | 14 | 0 |
| B | 0 | 15 | 0 |
| C | 0 | 15 | 0 |
| D | 0 | 15 | 0 |
| Mode M0 | |||
|---|---|---|---|
| Quadrant | BADHDUFLAG | Total packets | Discarded packets |
| A | 0 | 13834 | 2 |
| B | 0 | 21145 | 2 |
| C | 0 | 15193 | 2 |
| D | 0 | 21188 | 2 |
| Quadrant | Total seconds | Saturated seconds | Saturation percentage |
|---|---|---|---|
| A | 6316 | 55 | 0.870804% |
| B | 6316 | 156 | 2.469918% |
| C | 6316 | 249 | 3.942369% |
| D | 6316 | 675 | 10.687144% |
Noise dominated data is calculated using 1-second bins in cleaned event files. If a bin has >2000 counts, and if more than 50% of those come from <1% of pixels, then it is considered to be noise-dominated and hence unusable.
| Quadrant | # 1 sec bins | Bins with >0 counts | Bins with >2000 counts | High rate bins dominated by noise | Noise dominated (total time) | Noise dominated (detector-on time) | Marked lightcurve |
|---|---|---|---|---|---|---|---|
| A | 7531 | 6317 | 0 | 0 | 0.00% | 0.00% | 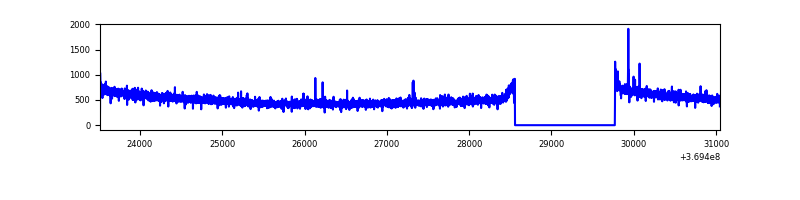 |
| B | 7531 | 6317 | 18 | 18 | 0.24% | 0.28% | 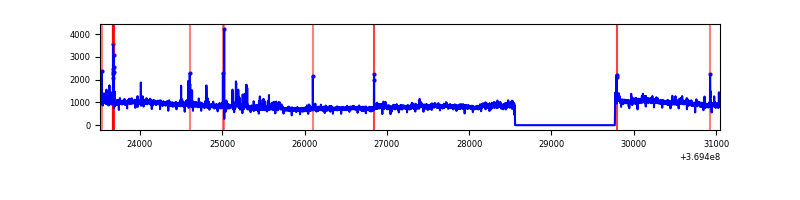 |
| C | 7531 | 6317 | 59 | 59 | 0.78% | 0.93% | 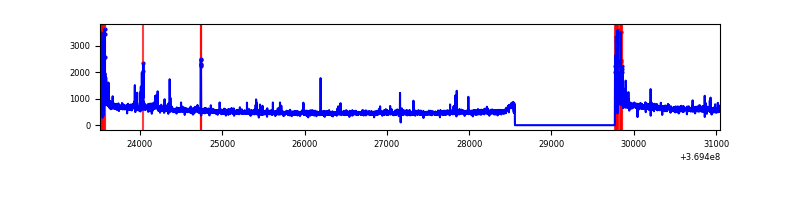 |
| D | 7531 | 6317 | 422 | 422 | 5.60% | 6.68% | 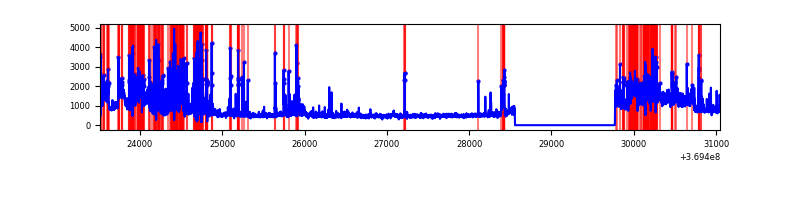 |
Top three noisy pixels from each quadrant. If the there are fewer than three noisy pixels in the level2.evt file, extra rows are filled as -1
| Pixel properties | Quadrant properties | ||||||
|---|---|---|---|---|---|---|---|
| Quadrant | DetID | PixID | Counts | Sigma | Mean | Median | Sigma |
| A | 13 | 254 | 12834 | 73.2 | 827 | 811 | 164.2 |
| A | 13 | 6 | 11268 | 63.67 | 827 | 811 | 164.2 |
| A | 12 | 96 | 8287 | 45.52 | 827 | 811 | 164.2 |
| B | 6 | 159 | 1973037 | 12943.38 | 824 | 805 | 152.4 |
| B | 5 | 172 | 140592 | 917.4 | 824 | 805 | 152.4 |
| B | 0 | 229 | 115226 | 750.92 | 824 | 805 | 152.4 |
| C | 0 | 10 | 288157 | 1569.18 | 804 | 812 | 183.1 |
| C | 14 | 238 | 135893 | 737.67 | 804 | 812 | 183.1 |
| C | 4 | 175 | 47423 | 254.54 | 804 | 812 | 183.1 |
| D | 8 | 195 | 1215497 | 6541.18 | 785 | 766 | 185.7 |
| D | 13 | 249 | 509464 | 2739.27 | 785 | 766 | 185.7 |
| D | 12 | 218 | 275729 | 1480.64 | 785 | 766 | 185.7 |
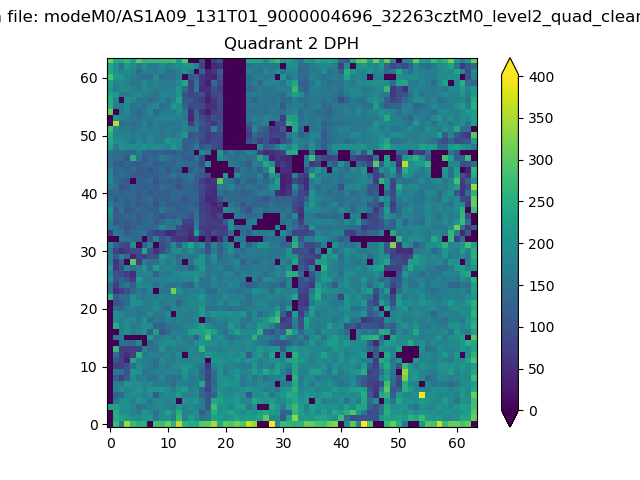
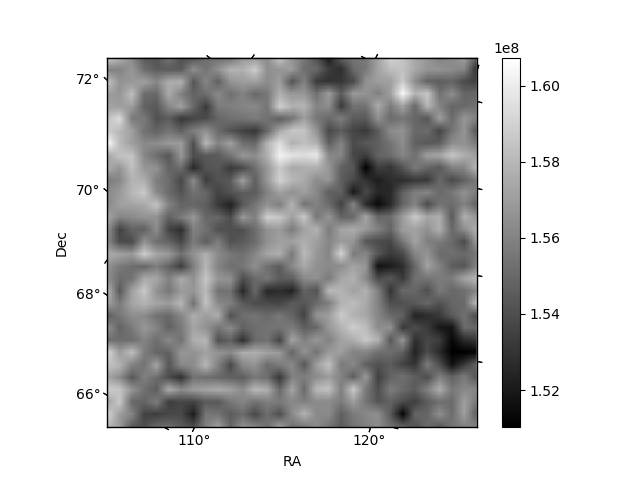
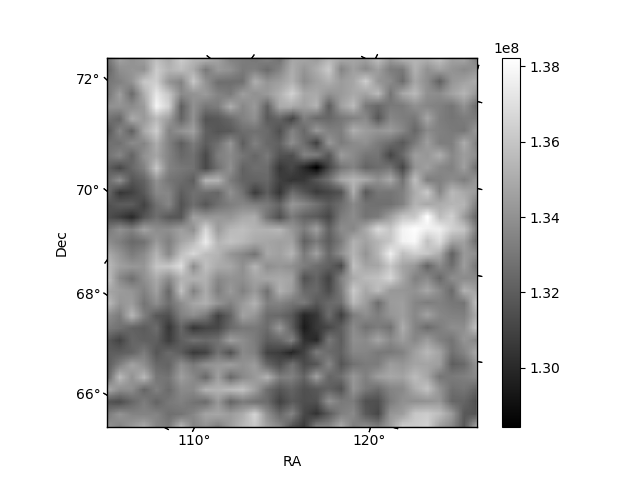
Histogram calculated using DETX and DETY for each event in the final _common_clean file
| Quadrant A | 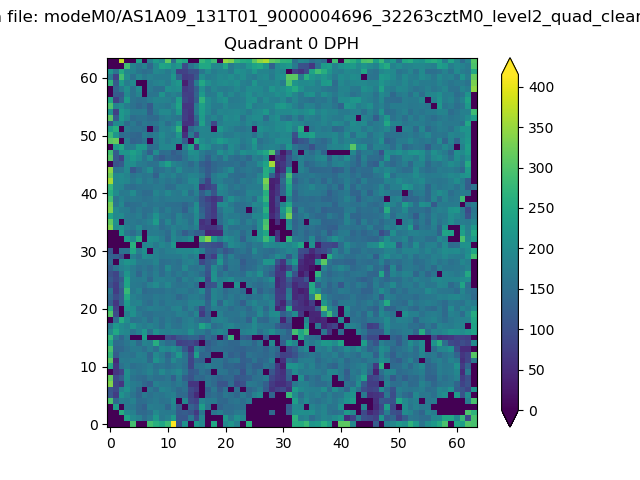 |
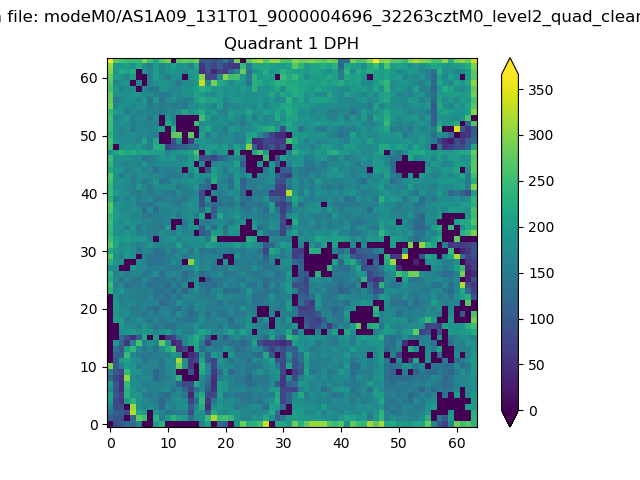 |
Quadrant B |
|---|---|---|---|
| Quadrant D | 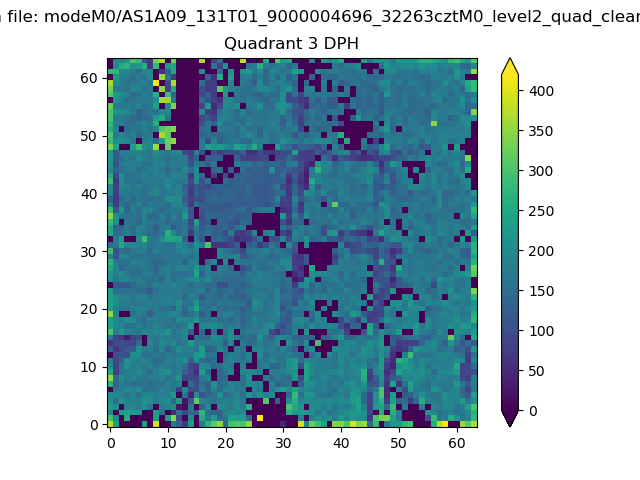 |
 |
Quadrant C |
| Plot type | Count rate plots | Images |
|---|---|---|
| Comparison with Poisson distribution Blue bars denote a histogram of data divided into 1 sec bins. Red curve is a Poisson curve with rate = median count rate of data. |
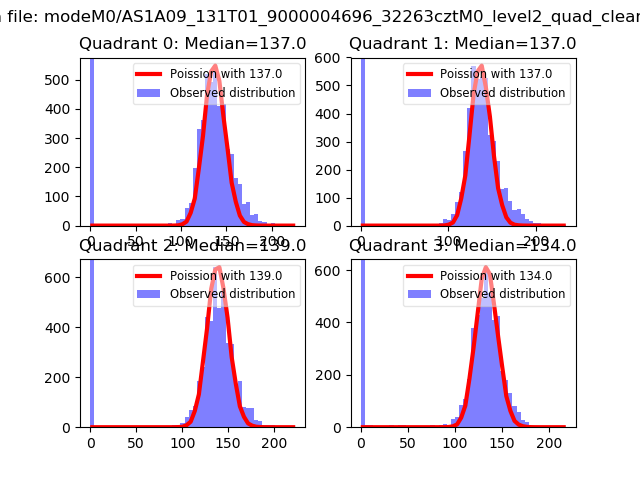 |
 |
| Quadrant-wise count rates Data is divided into 100 sec bins |
 |
|
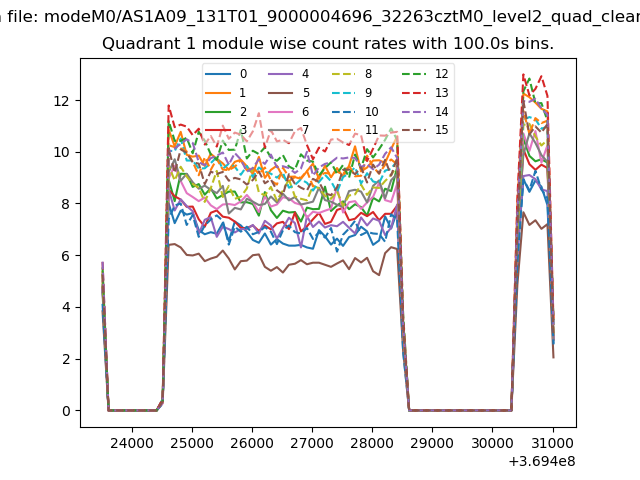
| Module-wise count rates for Quadrant A Data is divided into 100 sec bins |
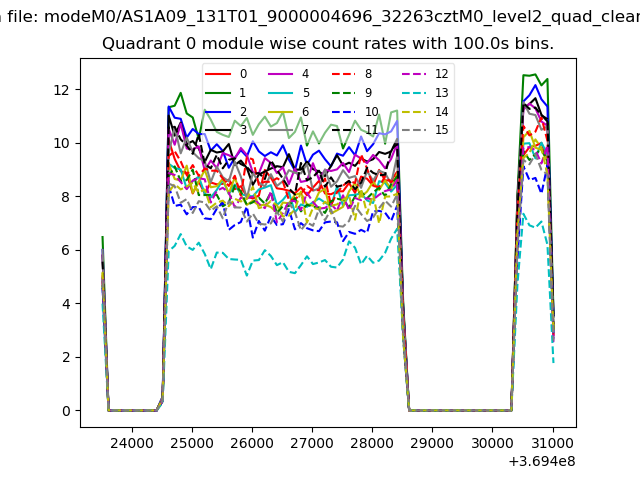 |
 |
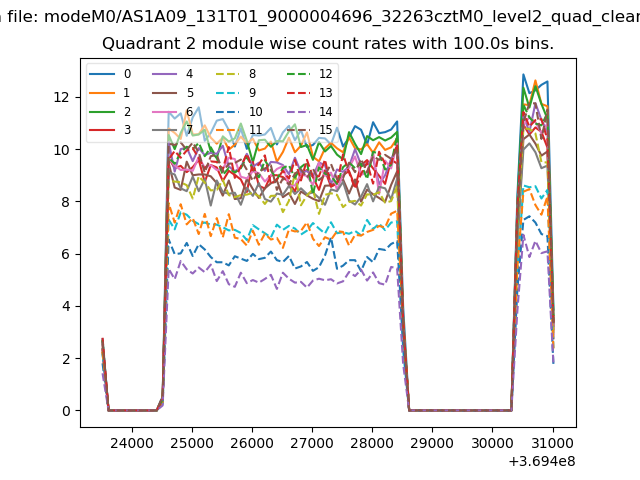
| Module-wise count rates for Quadrant B Data is divided into 100 sec bins |
 |
 |
| Module-wise count rates for Quadrant C Data is divided into 100 sec bins |
 |
 |
| Module-wise count rates for Quadrant D Data is divided into 100 sec bins |
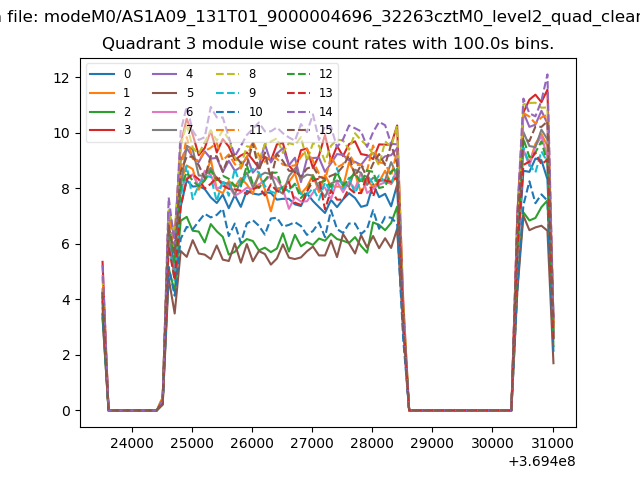 |
 |
| Parameter | Plot |
|---|---|
| CZT HV Monitor | 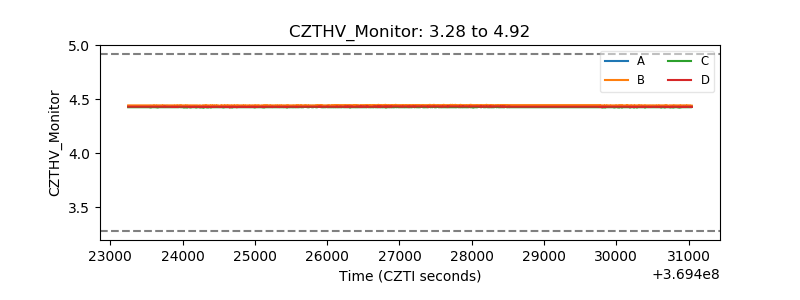 |
| D_VDD | 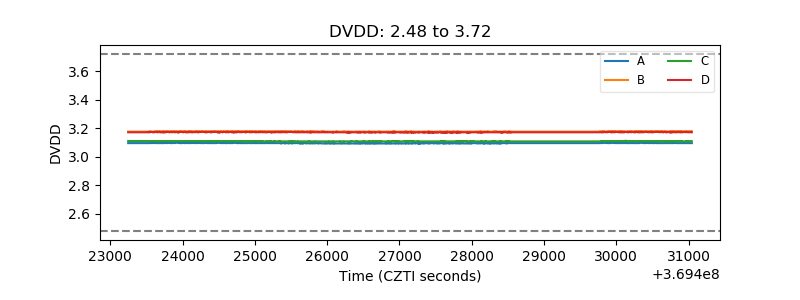 |
| Temperature 1 | 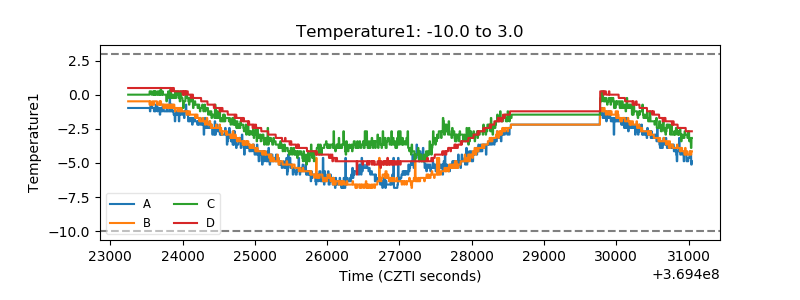 |
| Veto HV Monitor | 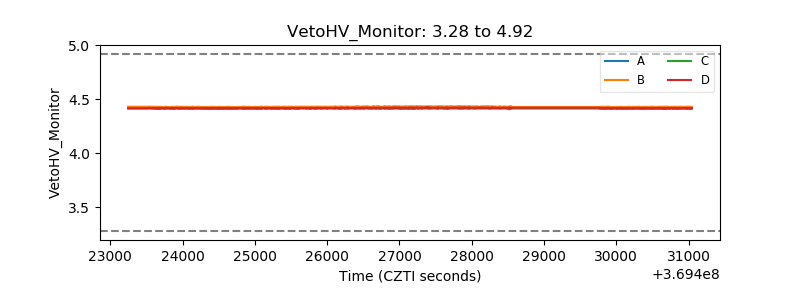 |
| Veto LLD | 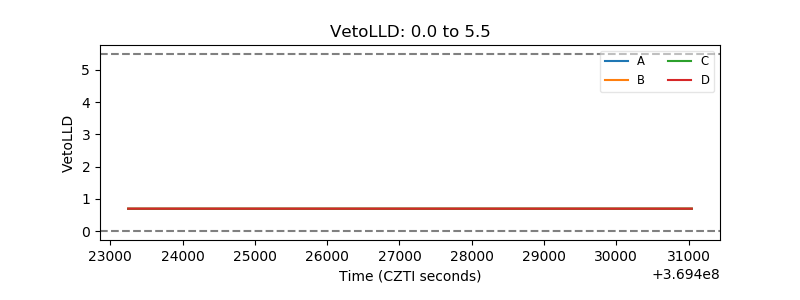 |
| Alpha Counter |  |
| _CPM_Rate | 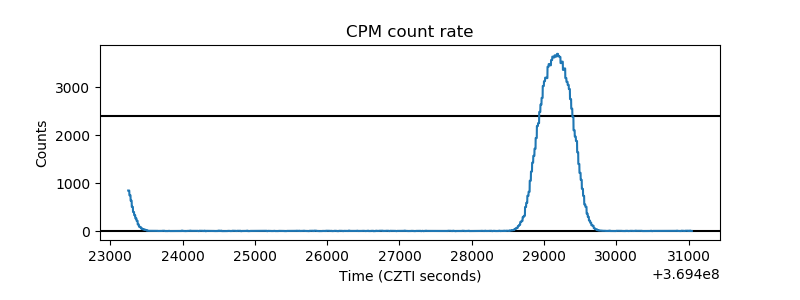 |
| CZT Counter | 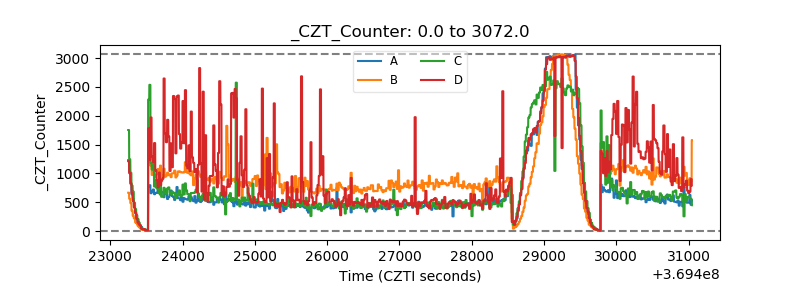 |
| +2.5 Volts monitor |  |
| +5 Volts monitor |  |
| _ROLL_ROT | 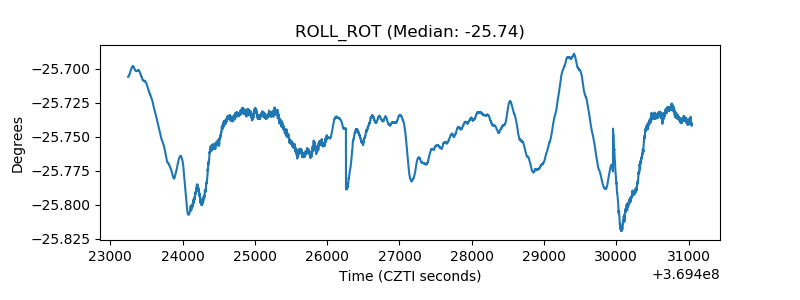 |
| _Roll_DEC | 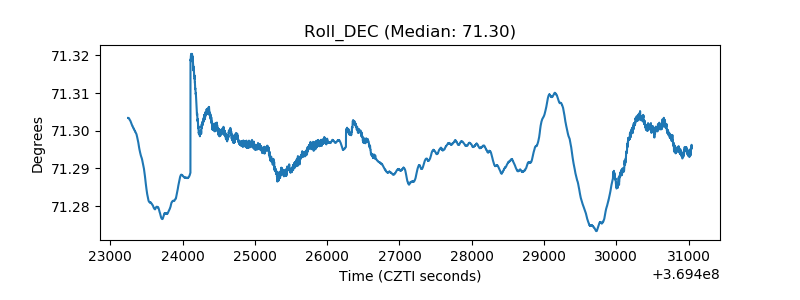 |
| _Roll_RA | 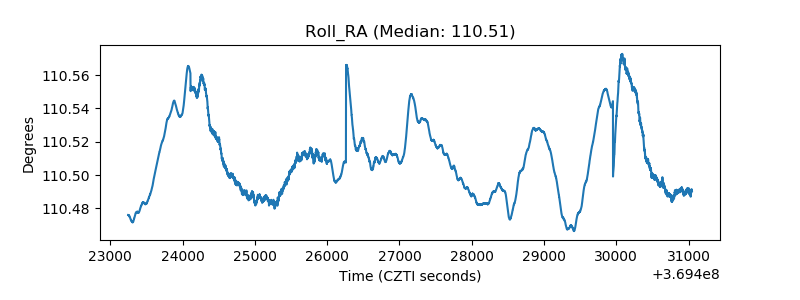 |
| Veto Counter | 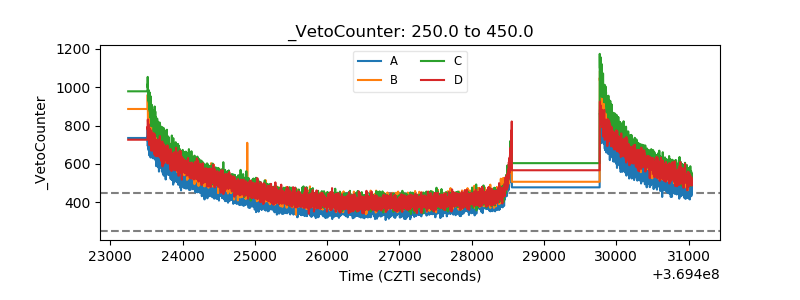 |